Bitcoin consolidates as buyers wait for clarity – Will BTC’s losses deepen?

ambcryptoPublished on 2026-03-29Last updated on 2026-03-29

Abstract

Bitcoin (BTC) retreated from its recent high of $72K, testing local support near $65.6K, though it saw a minor bounce over the weekend. Retail sentiment remains bearish with increasing FUD on social media, yet historical data suggests such conditions often present buying opportunities. Meanwhile, the long/short ratio has risen, indicating traders are taking leveraged long positions—increasing the risk of a long squeeze toward $64K or lower. On-chain data shows significant stablecoin reserves on exchanges, suggesting available buying power, while negative exchange net flows point to accumulation. However, investors may remain cautious amid market uncertainty, waiting for clearer signals before committing.

Bitcoin [BTC] has receded from the $72k level it reached on Wednesday, the 25th of March. It had fallen back to the local lows at $65.6k by Friday, the 27th of March, but has witnessed a minor price bounce over the weekend.

Source: Santiment on X

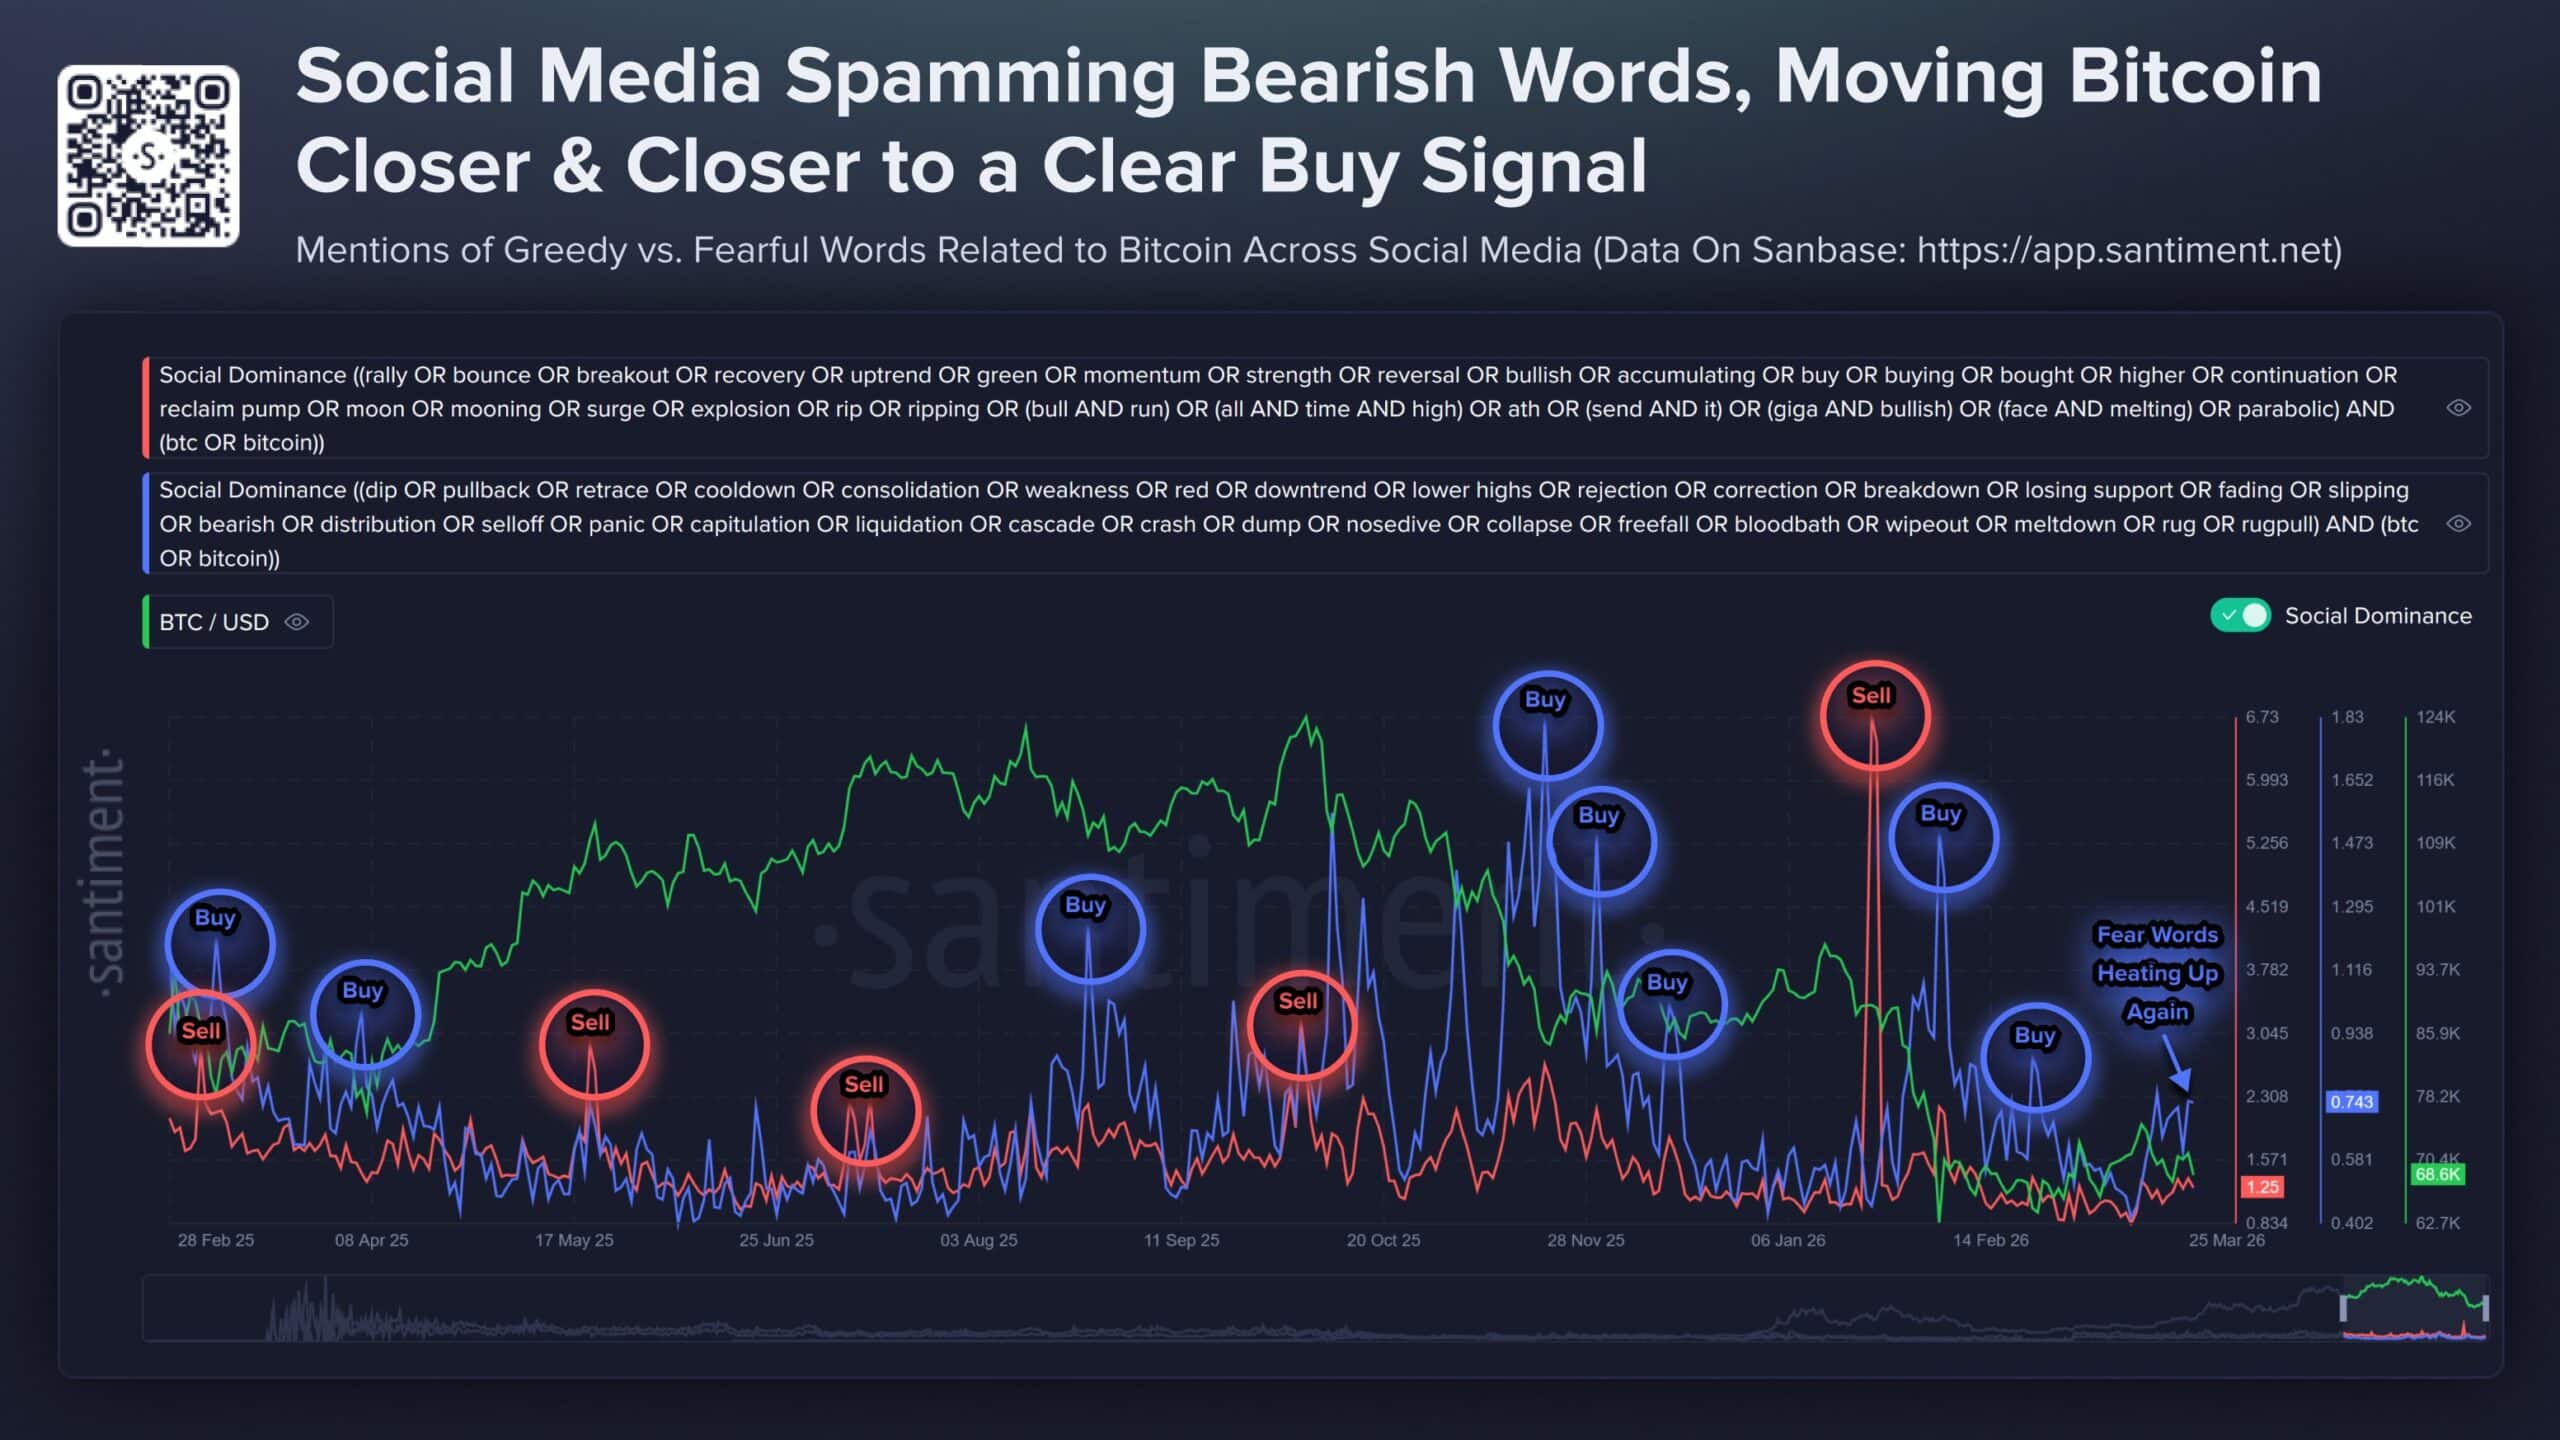
In a post on X, crypto intelligence platform Santiment pointed out that retail FUD was growing. Social media engagement was heavily bearish, and the use of fear words such as “rejection” or “crash” was ramping up.

Yet, as their data showed, it is during the times of retail bloodbath that buying opportunities have come about. These have not seen a sustained uptrend after the higher timeframe trend shift in October, but they do point toward a bounce.

Source: Alphractal on X

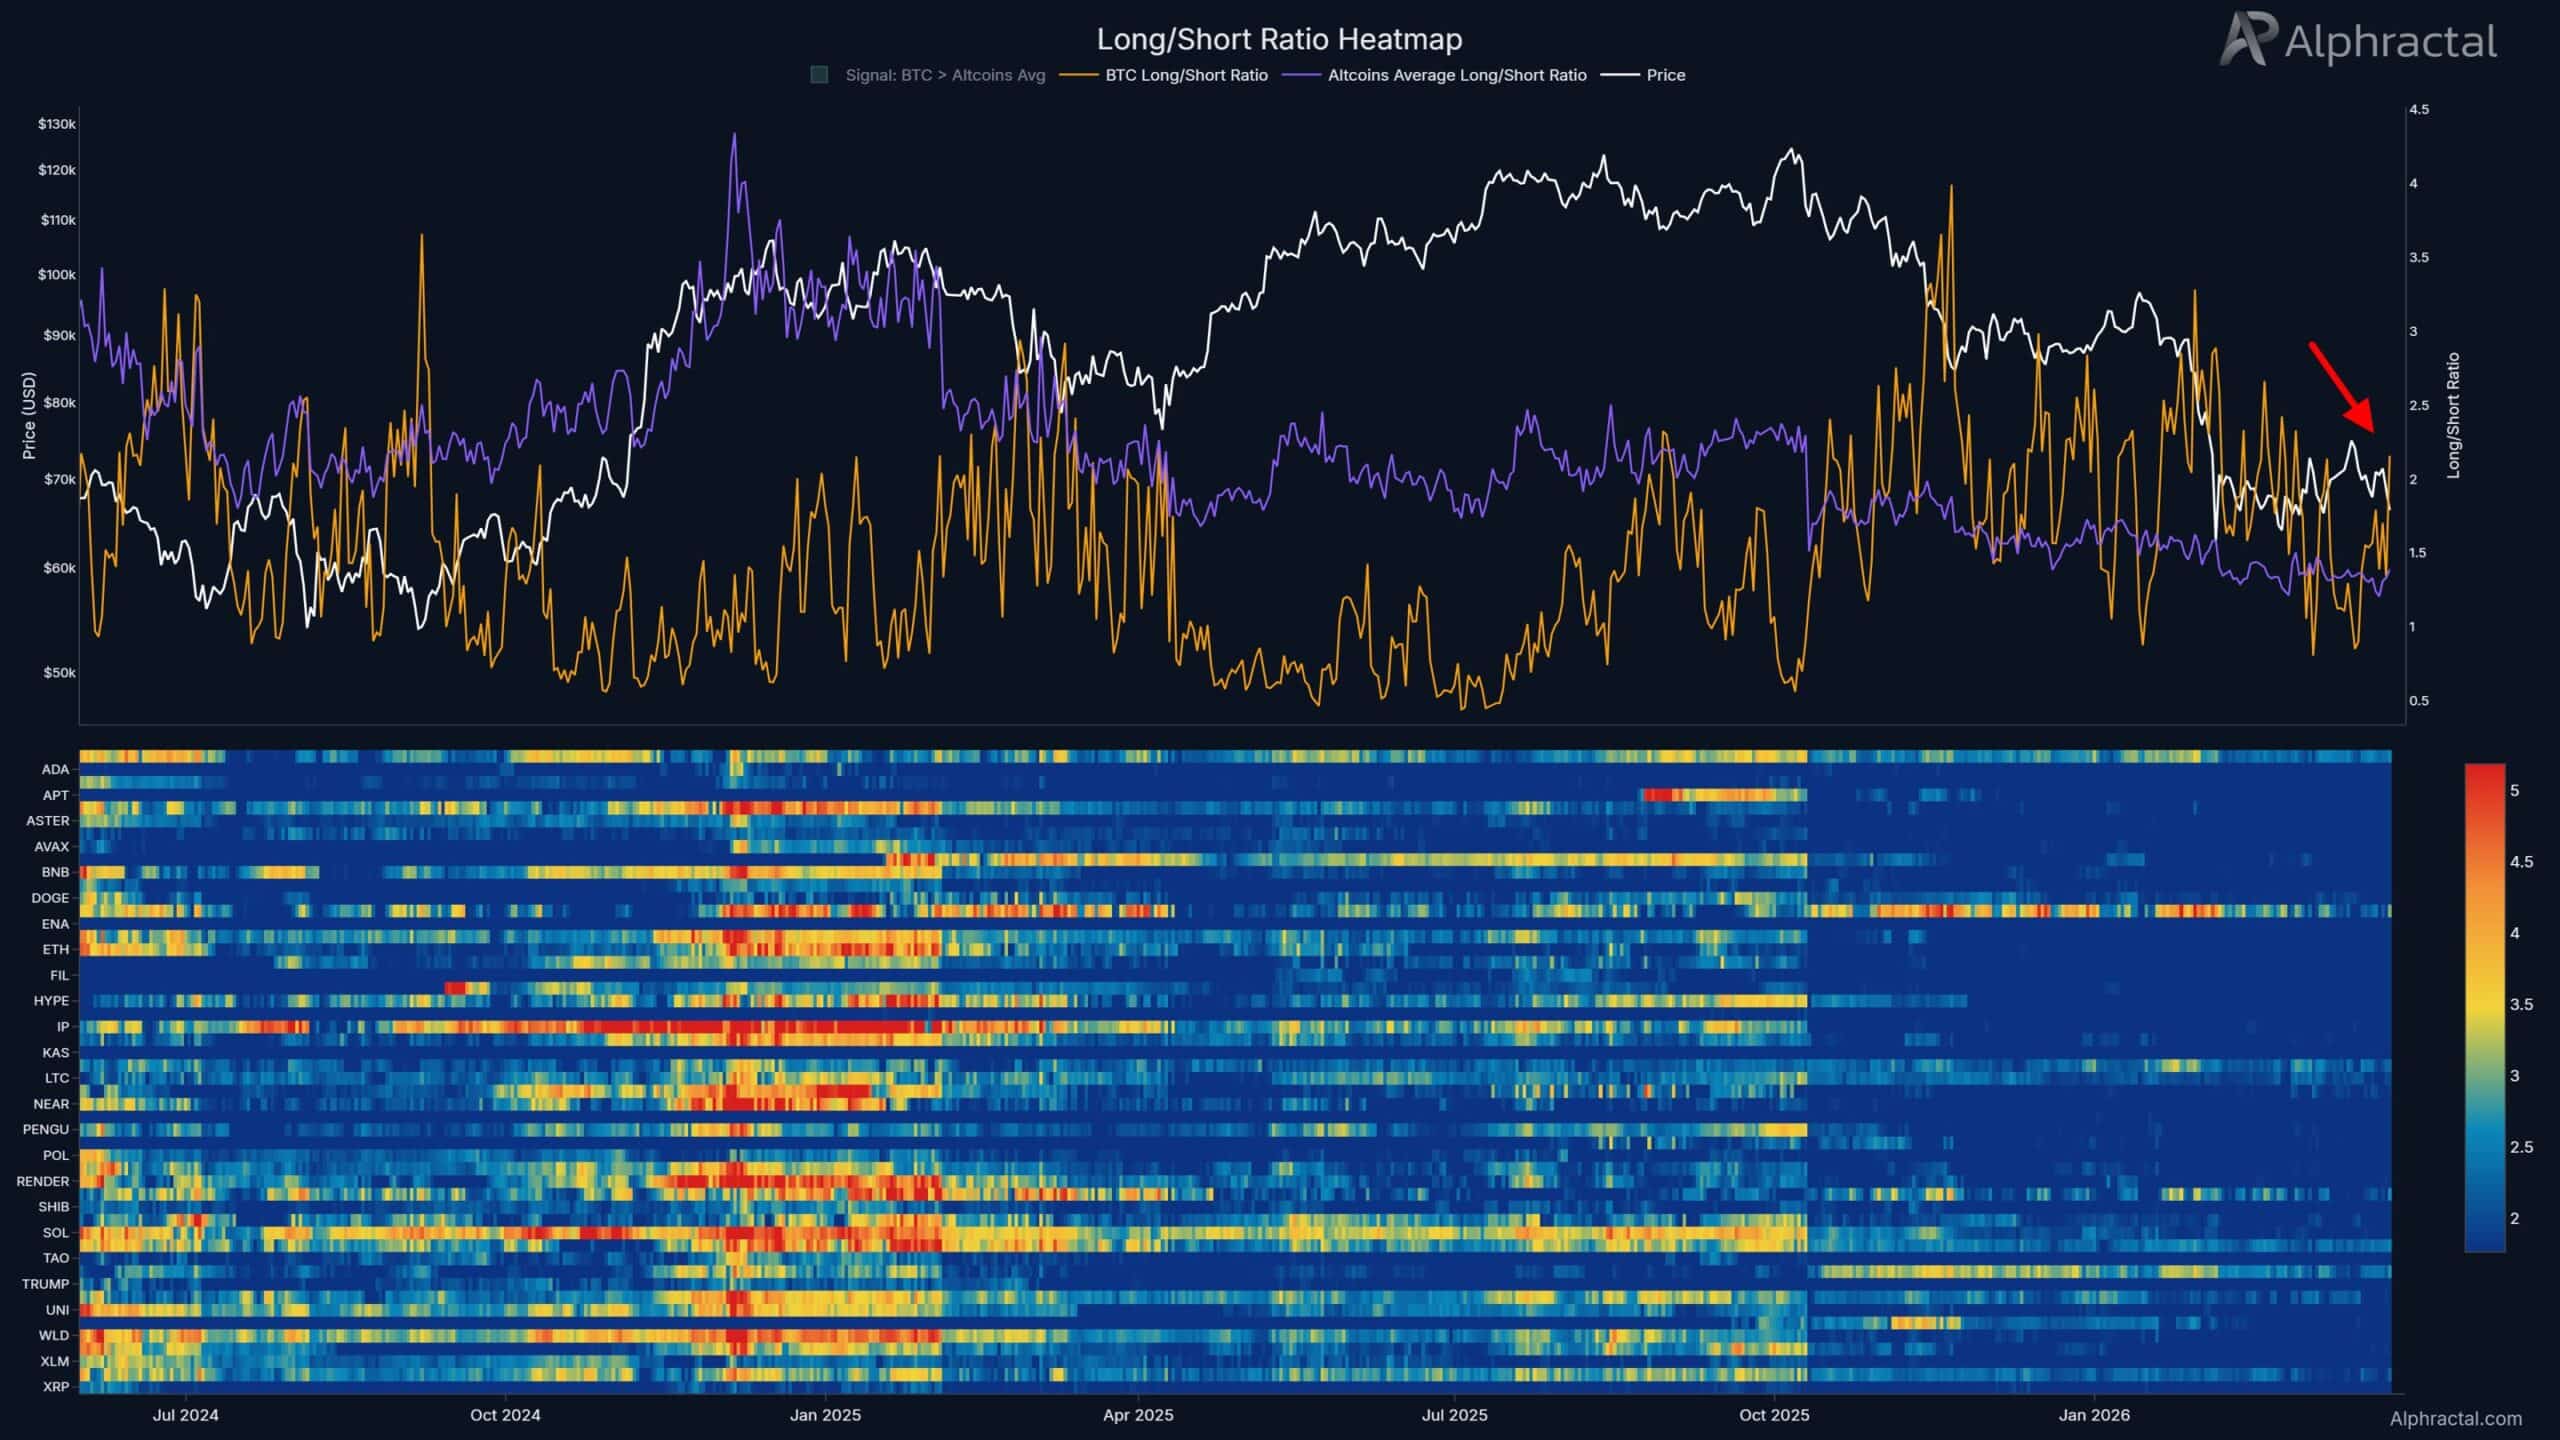
Another crypto market intelligence platform, Alphractal, showed that the long/short ratio was rising in recent days. Despite the pullback from $76k over the past ten days, the rising long positions showed traders were willing to take elevated amounts of risk to catch the local bottom.

This could be dangerous for short-term bulls. Increased willingness to take leveraged long positions means that long liquidations build up below the local lows.

This makes it more attractive for BTC to go on another long squeeze toward $64k or lower.

Buying power sits sidelined, waiting for clarity

Source: CryptoQuant

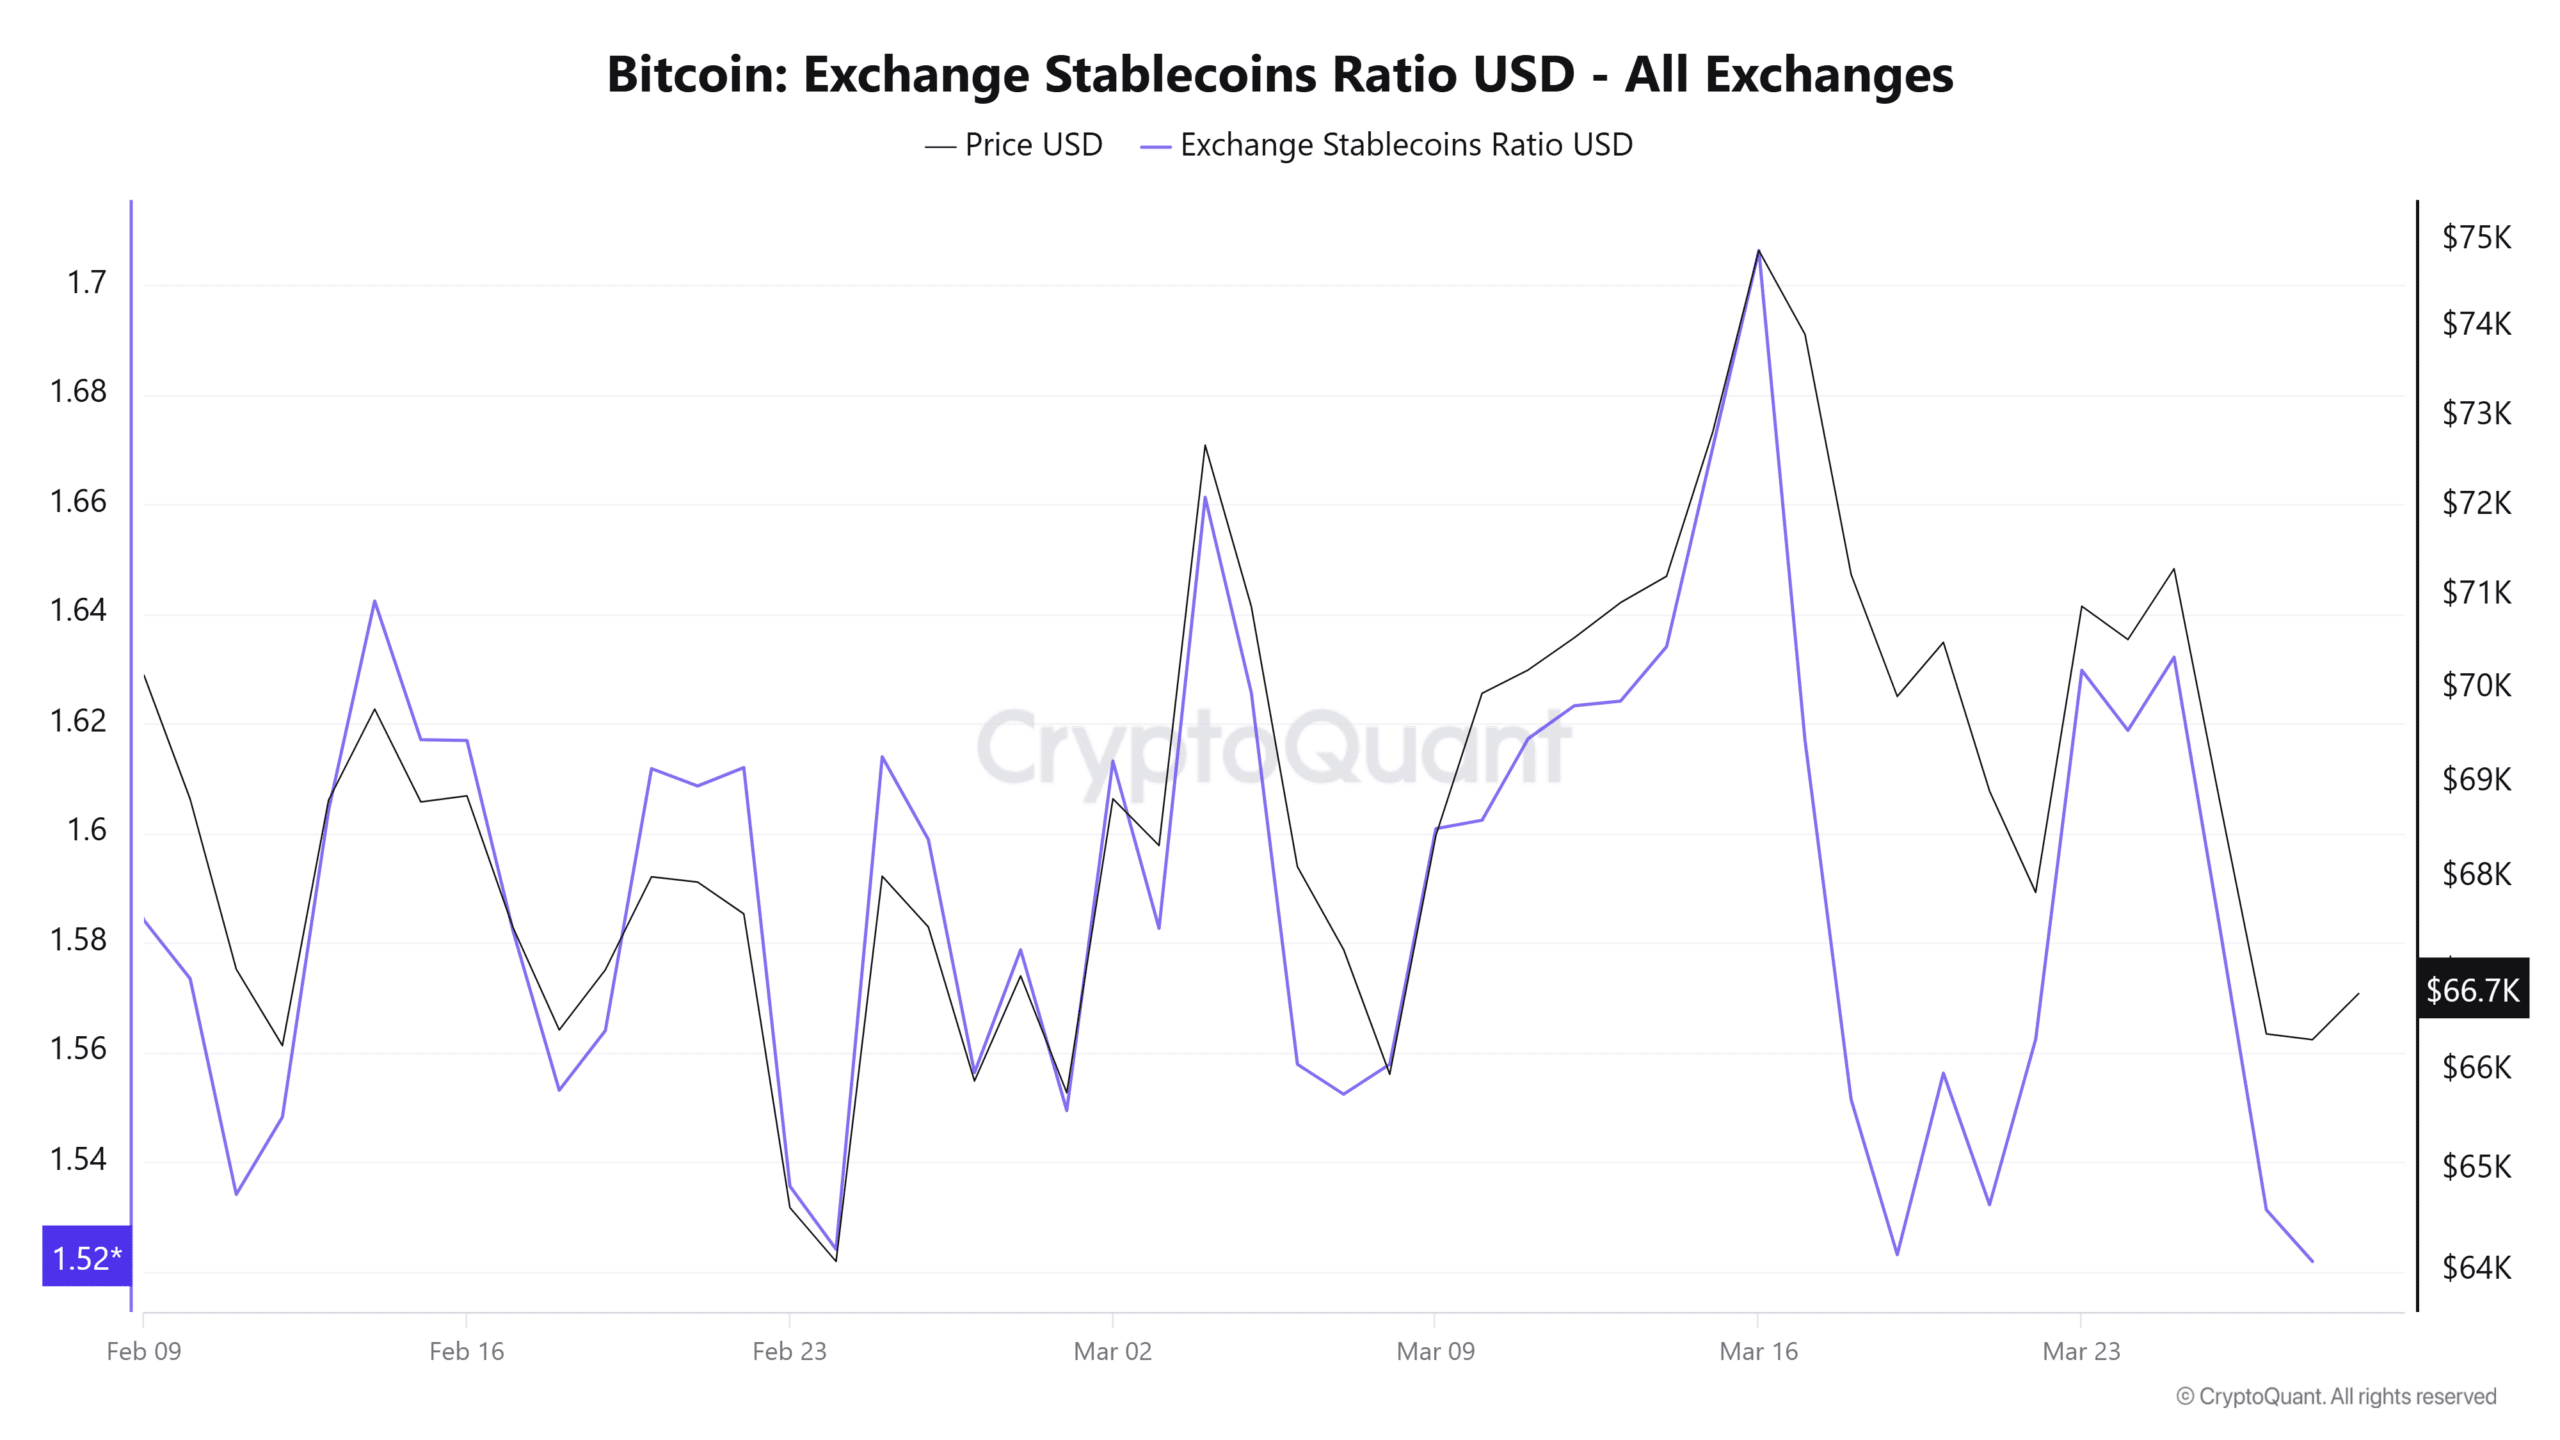
Crypto analyst GugaOnChain used the falling exchange stablecoin ratio to show that there was a high amount of stablecoins sitting on exchanges compared to their Bitcoin reserves.

The recent price drop saw the exchange stablecoin ratio to USD fall to the February lows. This indicates BTC is structurally cheap, and there is sufficient buying power to capture the dip, the analyst concluded.

As the price of BTC increases, the coin’s reserve value increases, pushing the exchange stablecoin ratio USD higher. To understand the implications better, exchange netflow is also needed.

Source: CryptoQuant

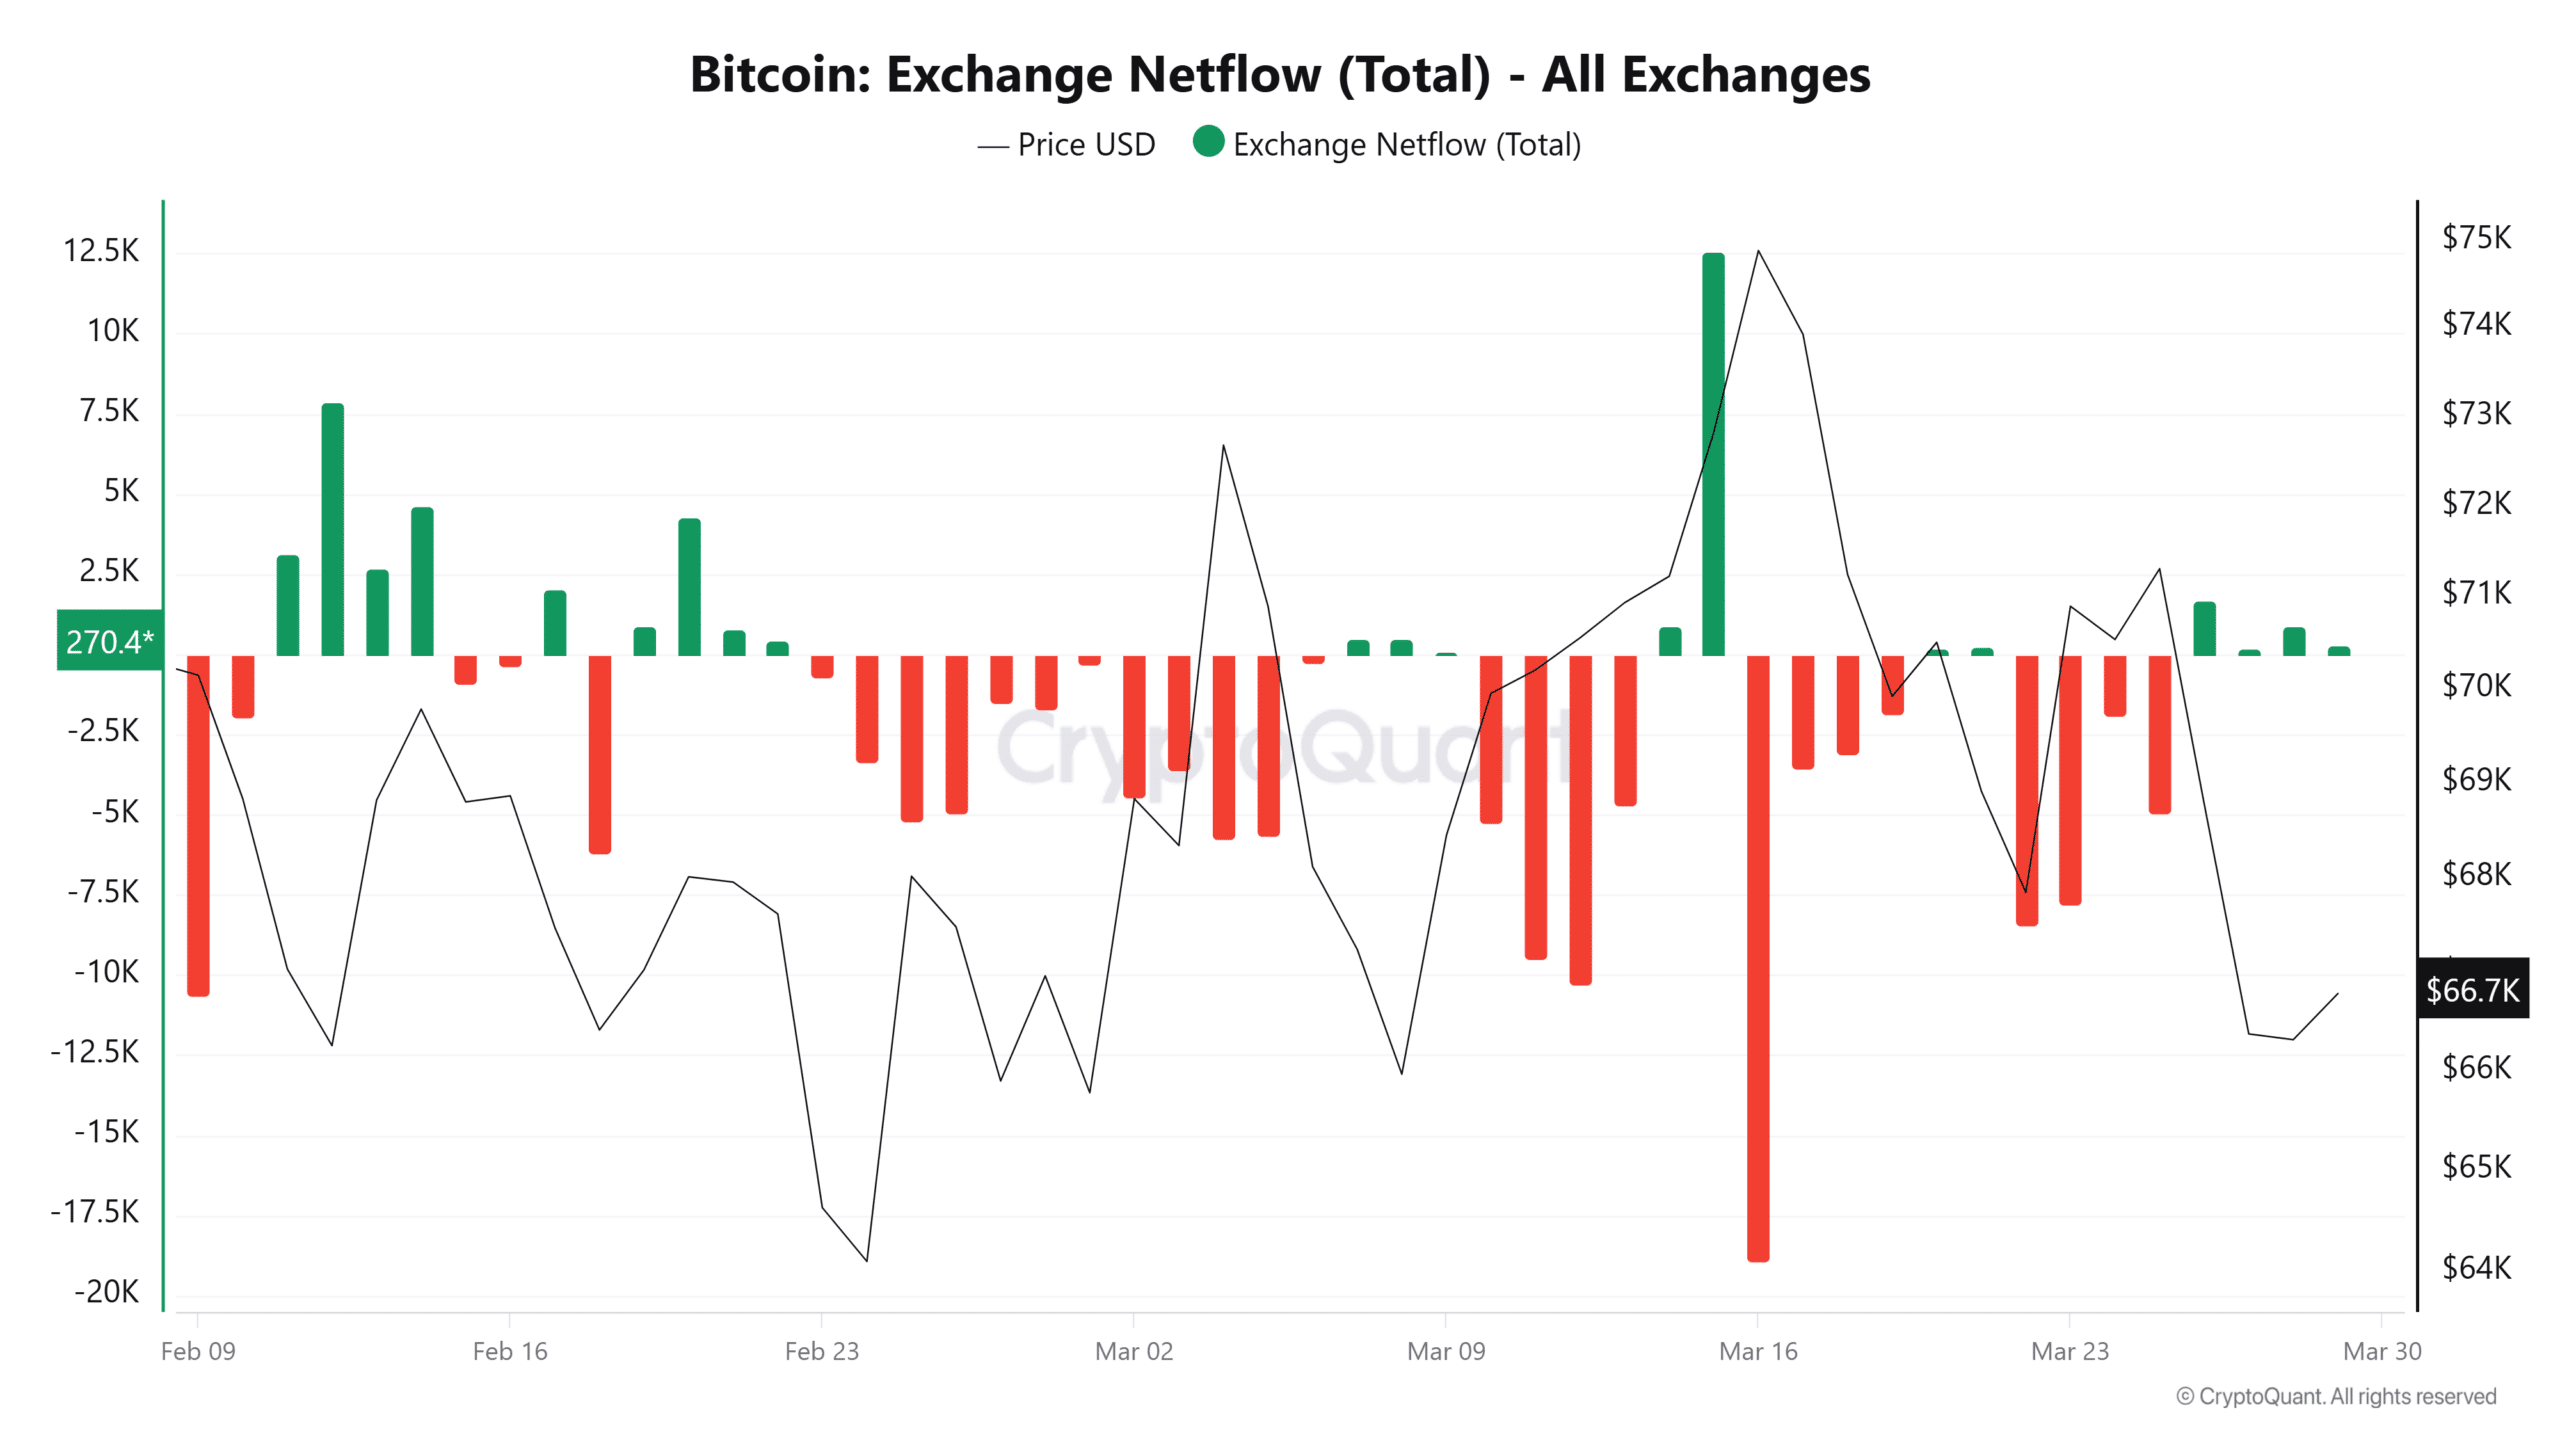
Over the past month, the exchange netflow has been negative, showing steady accumulation. This backs up the idea that buying pressure was there despite the volatility of the past two weeks.

Another phase of negative netflows would mean holders were buying the dip and would be a sign of confidence. With global markets tottering, Bitcoin investors might want to wait for more clarity before buying.


Final Summary

  • Retail sentiment was extremely bearish, but speculative traders were willing to assume extra risk and go long in these conditions.
  • The buying power was high, according to the stablecoin reserve ratio, but netflows were indecisive over the past four days.

Related Questions

QWhat was the price movement of Bitcoin from March 25th to the weekend mentioned in the article?

ABitcoin reached $72k on March 25th, fell back to $65.6k by March 27th, and then witnessed a minor price bounce over the weekend.

QAccording to Santiment, what was the prevailing retail sentiment on social media and what does it historically signal?

ARetail sentiment was heavily bearish, with increased use of fear words like 'rejection' or 'crash'. Historically, such periods of retail FUD have presented buying opportunities and pointed toward a price bounce.

QWhat does the rising long/short ratio indicate about trader behavior, and what risk does it pose?

AThe rising long/short ratio indicates traders were taking on elevated risk by increasing long positions to catch the local bottom. This is dangerous as it builds up long liquidations below the local lows, making another long squeeze toward $64k or lower more attractive.

QWhat does the falling exchange stablecoin ratio signify about the market's buying power?

AThe falling exchange stablecoin ratio, which dropped to February lows, signifies that there is a high amount of stablecoins on exchanges compared to Bitcoin reserves. This indicates that Bitcoin is structurally cheap and that there is sufficient buying power available to capture the dip.

QWhat has the exchange netflow data shown over the past month, and what would a new phase of negative netflows indicate?

AExchange netflow has been negative over the past month, showing steady accumulation and underlying buying pressure. Another phase of negative netflows would indicate that holders are buying the dip, which would be a sign of confidence in the market.

Related Reads

pump.fun's New Feature Brings 'Black Mirror' Into Reality

The article begins by recounting a dark fictional story from *Black Mirror* (Season 7, Episode 1 "Common People"), where a man is forced to perform humiliating tasks online to pay for his wife's life-sustaining medical subscription. It then draws a parallel to a new real-world feature on the crypto platform pump.fun called "Pump.fun Go," which allows users to post and complete paid bounty tasks. This feature gained mainstream attention, often negatively, through extreme examples. A prominent case involved a bounty of 40 SOL (~$2,600) offered to permanently tattoo "$bountywork" on one's forehead. An Indian man completed the task, stating the money "changed his life," and later earned significantly more from a related meme coin. Another bounty paid 200 SOL (~$14,000) for a "bounty.fun" forehead tattoo, with the participant simply stating, "We need the money." The article highlights how this system can amplify darkness, citing the dev behind $Bountywork who spent thousands on bounties for attention-grabbing stunts like eating bugs or drinking hot sauce for small sums. It compares this to past tragic live-streaming incidents where people harmed themselves for money, noting regulation cannot stop those in desperate need. However, it also points to positive, altruistic bounties that have emerged, such as organizing anti-work rallies in New York, performing random acts of kindness for strangers, organizing community food drives, or even helping an elderly person cross the street. The piece concludes by acknowledging the platform reflects both the dark and light sides of human nature when actions are given a price, hoping for more of the latter.

marsbit6m ago

pump.fun's New Feature Brings 'Black Mirror' Into Reality

marsbit6m ago

As the US and Japan Hike Interest Rates, Which Asset Class is Most at Risk?

This week, global markets face two major events: the Bank of Japan's likely interest rate hike and the US Federal Reserve's FOMC meeting. For risk assets, it is a pivotal and volatile week. In the US, expectations for rate cuts have faded dramatically. May's higher-than-expected CPI and resilient jobs data have shifted the Fed's focus from potential cuts to the possibility of future hikes. New Fed Chair Wash is unlikely to raise rates at this meeting, but any hawkish shift in communication, the dot plot, or the policy statement could lead markets to price in tighter policy, pushing up short-term Treasury yields and strengthening the dollar. High-valuation growth stocks, AI-related assets, and small-cap stocks reliant on cheap funding are most vulnerable to rising rates. In Japan, a 25 basis point hike is almost fully priced in (98.3% probability), which would bring the policy rate to 1%, its highest since 1995. The concern is not the hike itself, but its potential to unwind the massive "carry trade," where investors borrowed low-yielding yen to invest globally. Historically, Japan's rate hikes have coincided with global market stress (2000, 2007, 2024). While this well-telegraphed hike may be digested smoothly, two key factors increase uncertainty: 1) Governor Ueda's absence due to illness, putting communication in the hands of less-familiar deputies, and 2) the Fed meeting occurring just days later, creating potential for a compounded market reaction if both central banks sound hawkish. Asset implications: * **Bonds:** US short-term yields sensitive to Fed signals. Japan's rate hike could pressure its massive US Treasury holdings. * **Currencies:** Dollar likely supported by Fed; Yen's reaction hinges on BoJ's forward guidance. * **Equities:** US growth stocks, small-caps most at risk. Japanese stocks face pressure from a stronger yen. * **Crypto:** Assets like Bitcoin face headwinds from higher rates and tighter liquidity; high-beta altcoins are even more vulnerable. The convergence of these two central bank meetings amplifies market volatility risks, with potential spillovers across asset classes globally.

marsbit11m ago

As the US and Japan Hike Interest Rates, Which Asset Class is Most at Risk?

marsbit11m ago

Data Decrypts the BTC Cycle: Three Major Bottom Signals Illuminate Simultaneously, Q4 Could Be a Crucial Turning Point Window?

"Decoding the Bitcoin Cycle: Three Bottom Signals Flash Simultaneously, Is Q4 the Key Turning Point?" The article analyzes Bitcoin's current market position, comparing it to historical cycles. BTC has corrected over 52% from its October 2025 peak of $126,198 to around $59,100 in June 2026. While significant, this drawdown is milder than the 77-86% declines seen in past bear markets. The analysis is framed within Bitcoin's four-year halving cycle. Past cycles show a pattern: prices peak 12-18 months post-halving, bottom 12-14 months after the peak, with lows typically occurring roughly 17 months before the next halving. Following the April 2024 halving and the October 2025 peak, this pattern suggests a potential bottoming window around Q4 2026, ahead of the expected 2028 halving. Three key on-chain metrics are signaling undervaluation: The MVRV Z-Score has dropped near 0.27, approaching historic bottom zones. The market price is only about 9% above the network's average realized price of ~$53,600, a rare low premium. Bitcoin's price recently touched its 200-week moving average (~$62,200), a level that aligned with bottoms in 2015, 2018, and 2020. While US spot Bitcoin ETFs saw record outflows in May/June 2026, indicating retail panic, whale addresses (holding 100+ BTC) reached a yearly high. Entities like MicroStrategy resumed buying, and long-term holders control a near-record 78% of the supply, suggesting accumulation. A major macro overhang was partially removed with a US-Iran ceasefire agreement in mid-June 2026, which eased oil prices and triggered a sharp BTC rally. However, persistent inflation means high-interest rates remain a constraint. The conclusion notes that genuine investment opportunities often arise when confidence is lowest, amidst narratives that "this time is different." While not guaranteeing an immediate bottom, the confluence of cycle timing, undervaluation signals, and shifting macro risks suggests late 2026 may be a critical period for reassessing risk/reward and patient accumulation for long-term believers.

marsbit11m ago

Data Decrypts the BTC Cycle: Three Major Bottom Signals Illuminate Simultaneously, Q4 Could Be a Crucial Turning Point Window?

marsbit11m ago

Trading

Spot
Futures

Hot Articles

What is $BITCOIN

DIGITAL GOLD ($BITCOIN): A Comprehensive Analysis Introduction to DIGITAL GOLD ($BITCOIN) DIGITAL GOLD ($BITCOIN) is a blockchain-based project operating on the Solana network, which aims to combine the characteristics of traditional precious metals with the innovation of decentralized technologies. While it shares a name with Bitcoin, often referred to as “digital gold” due to its perception as a store of value, DIGITAL GOLD is a separate token designed to create a unique ecosystem within the Web3 landscape. Its goal is to position itself as a viable alternative digital asset, although specifics regarding its applications and functionalities are still developing. What is DIGITAL GOLD ($BITCOIN)? DIGITAL GOLD ($BITCOIN) is a cryptocurrency token explicitly designed for use on the Solana blockchain. In contrast to Bitcoin, which provides a widely recognized value storage role, this token appears to focus on broader applications and characteristics. Notable aspects include: Blockchain Infrastructure: The token is built on the Solana blockchain, known for its capacity to handle high-speed and low-cost transactions. Supply Dynamics: DIGITAL GOLD has a maximum supply capped at 100 quadrillion tokens (100P $BITCOIN), although details regarding its circulating supply are currently undisclosed. Utility: While precise functionalities are not explicitly outlined, there are indications that the token could be utilized for various applications, potentially involving decentralized applications (dApps) or asset tokenization strategies. Who is the Creator of DIGITAL GOLD ($BITCOIN)? At present, the identity of the creators and development team behind DIGITAL GOLD ($BITCOIN) remains unknown. This situation is typical among many innovative projects within the blockchain space, particularly those aligning with decentralized finance and meme coin phenomena. While such anonymity may foster a community-driven culture, it intensifies concerns about governance and accountability. Who are the Investors of DIGITAL GOLD ($BITCOIN)? The available information indicates that DIGITAL GOLD ($BITCOIN) does not have any known institutional backers or prominent venture capital investments. The project seems to operate on a peer-to-peer model focused on community support and adoption rather than traditional funding routes. Its activity and liquidity are primarily situated on decentralized exchanges (DEXs), such as PumpSwap, rather than established centralized trading platforms, further highlighting its grassroots approach. How DIGITAL GOLD ($BITCOIN) Works The operational mechanics of DIGITAL GOLD ($BITCOIN) can be elaborated on based on its blockchain design and network attributes: Consensus Mechanism: By leveraging Solana’s unique proof-of-history (PoH) combined with a proof-of-stake (PoS) model, the project ensures efficient transaction validation contributing to the network's high performance. Tokenomics: While specific deflationary mechanisms have not been extensively detailed, the vast maximum token supply implies that it may cater to microtransactions or niche use cases that are still to be defined. Interoperability: There exists the potential for integration with Solana’s broader ecosystem, including various decentralized finance (DeFi) platforms. However, the details regarding specific integrations remain unspecified. Timeline of Key Events Here is a timeline that highlights significant milestones concerning DIGITAL GOLD ($BITCOIN): 2023: The initial deployment of the token occurs on the Solana blockchain, marked by its contract address. 2024: DIGITAL GOLD gains visibility as it becomes available for trading on decentralized exchanges like PumpSwap, allowing users to trade it against SOL. 2025: The project witnesses sporadic trading activity and potential interest in community-led engagements, although no noteworthy partnerships or technical advancements have been documented as of yet. Critical Analysis Strengths Scalability: The underlying Solana infrastructure supports high transaction volumes, which could enhance the utility of $BITCOIN in various transaction scenarios. Accessibility: The potential low trading price per token could attract retail investors, facilitating wider participation due to fractional ownership opportunities. Risks Lack of Transparency: The absence of publicly known backers, developers, or an audit process may yield skepticism regarding the project's sustainability and trustworthiness. Market Volatility: The trading activity is heavily reliant on speculative behavior, which can result in significant price volatility and uncertainty for investors. Conclusion DIGITAL GOLD ($BITCOIN) emerges as an intriguing yet ambiguous project within the rapidly evolving Solana ecosystem. While it attempts to leverage the “digital gold” narrative, its departure from Bitcoin's established role as a store of value underscores the need for a clearer differentiation of its intended utility and governance structure. Future acceptance and adoption will likely depend on addressing the current opacity and defining its operational and economic strategies more explicitly. Note: This report encompasses synthesised information available as of October 2023, and developments may have transpired beyond the research period.

368 Total ViewsPublished 2025.05.13Updated 2025.05.13

What is $BITCOIN

Discussions

Welcome to the HTX Community. Here, you can stay informed about the latest platform developments and gain access to professional market insights. Users' opinions on the price of BTC (BTC) are presented below.

活动图片