The $75 line in the sand: Hyperliquid approaches a key decision point

ambcryptoPublished on 2026-07-03Last updated on 2026-07-03

Abstract

Bitcoin and most altcoins have been in a downtrend since October 2025, with recent gains seen as minor bounces. However, Hyperliquid (HYPE), a large-cap DEX token, has maintained a strong long-term bullish trend for over a year. Trading around $70.11, it was up 74% annually. On the weekly chart, the RSI shows potential for a bearish divergence if prices push past $72.1. Currently, HYPE trades within a one-month range of $53.35 to $74.78, having recently moved above key resistance levels. Despite some whale profit-taking, steady buying pressure, a rising OBV, and an RSI above 50 suggest upside momentum toward the critical $75 supply zone. For swing traders, the optimal risk/reward entry is not yet present. The key action will be a decisive breakout above or a bearish rejection from $75, which would signal the next major directional move.

Since October 2025, Bitcoin [BTC] and most of the altcoins have been trending downward. Many alts, even prominent ones, never really got a long-term uptrend going. The price gains in the past couple of days for BTC and other tokens were only a bounce within a downtrend.

Hyperliquid [HYPE] was one of the large-cap tokens whose long-term trend was firmly bullish.
Source: HYPE/USDT on TradingView

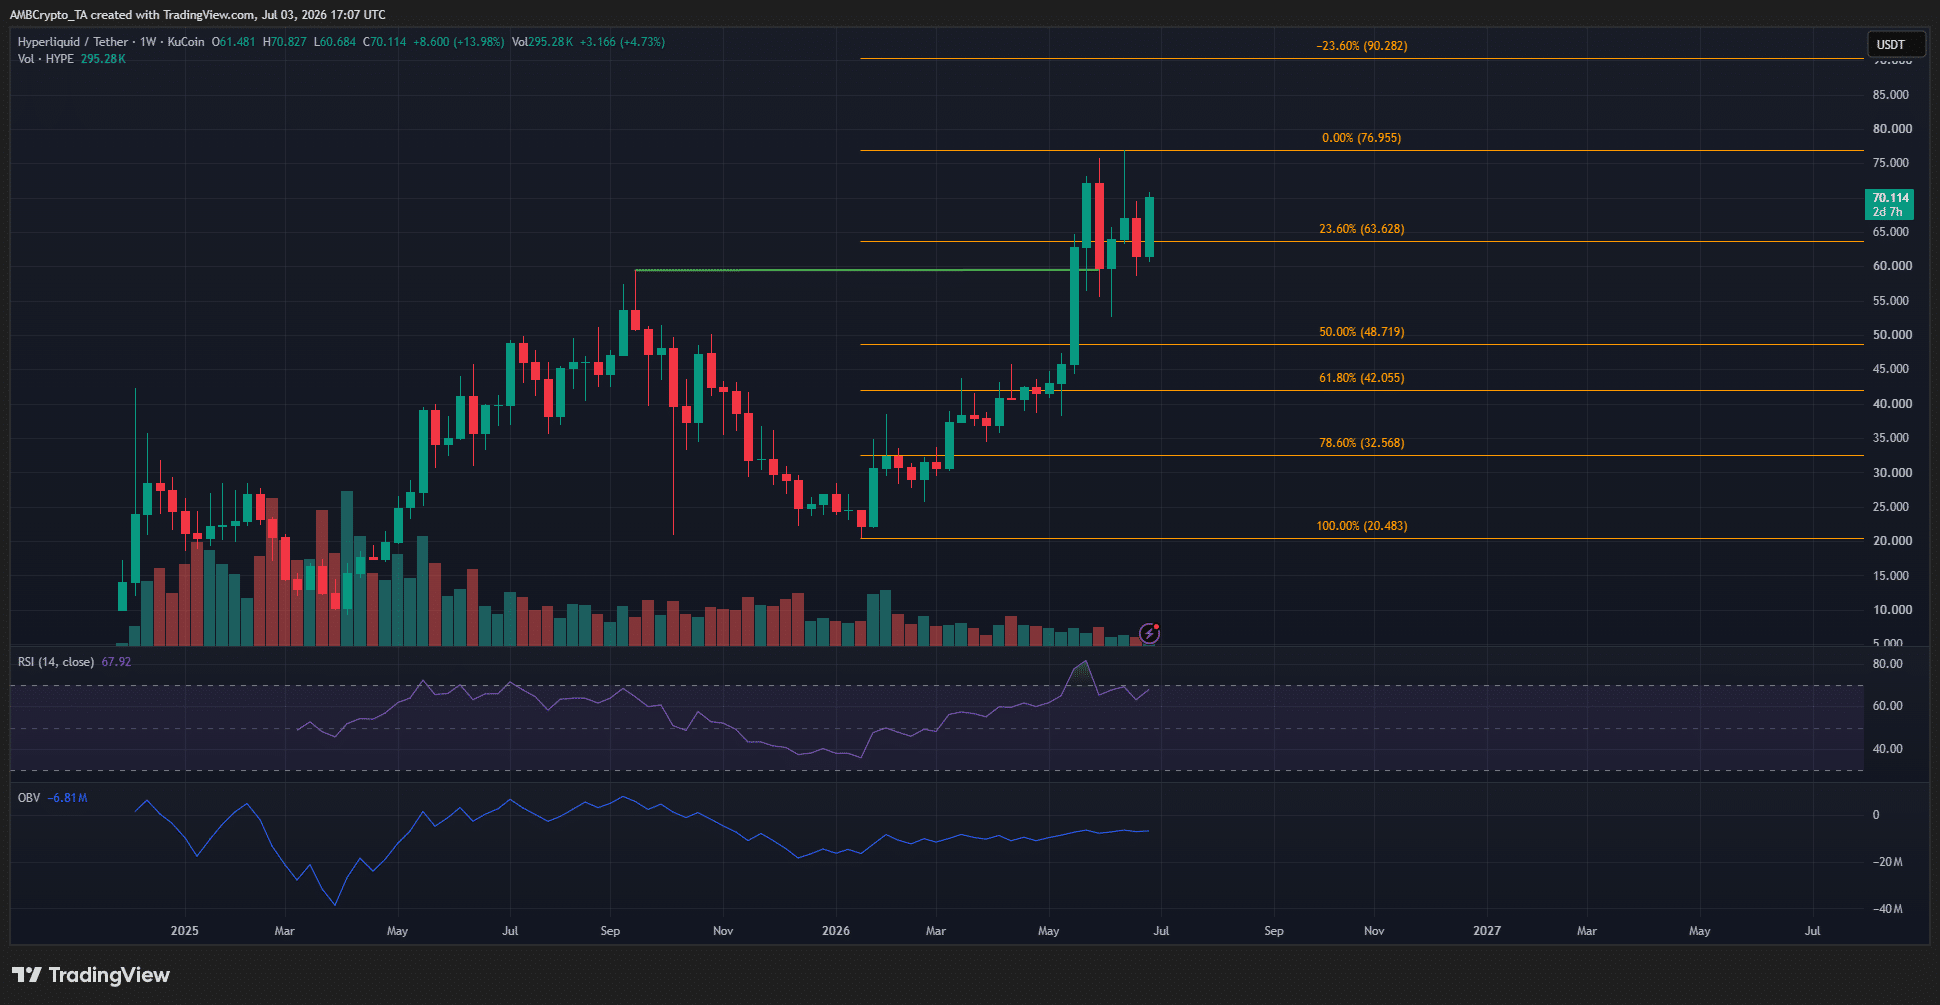
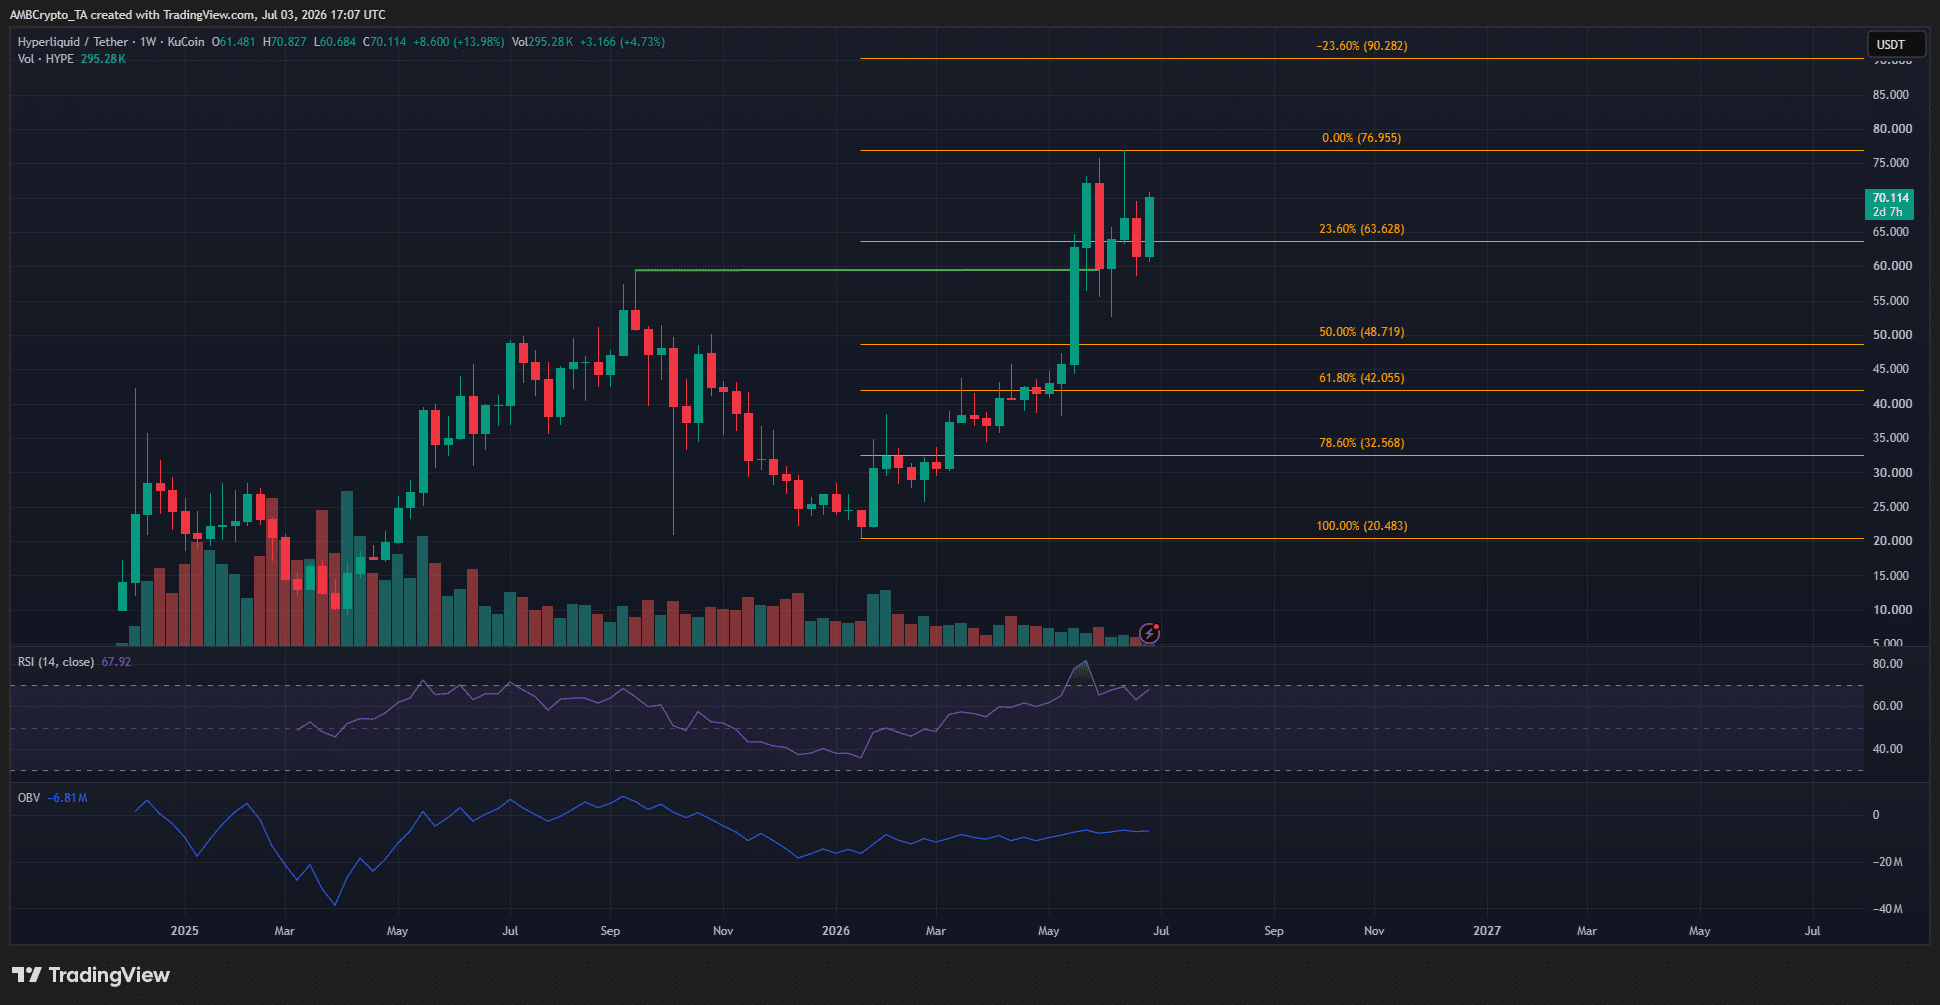
As the 1-week chart above highlights, the swing structure has been bullish for more than a year. It was trading at $70.11, and was up 7.51% in the past week and over 74% up in a year.

This cemented the long-term bullish trend, but the RSI was forming lower highs in recent weeks while HYPE bulls tried to push prices to new highs. Hence, a weekly session move beyond $72.1 would present a bearish divergence, though it doesn’t guarantee an immediate correction.

Here’s what traders and investors can expect from Hyperliquid token’s price action.

HYPE price prediction for July
Source: HYPE/USDT on TradingView

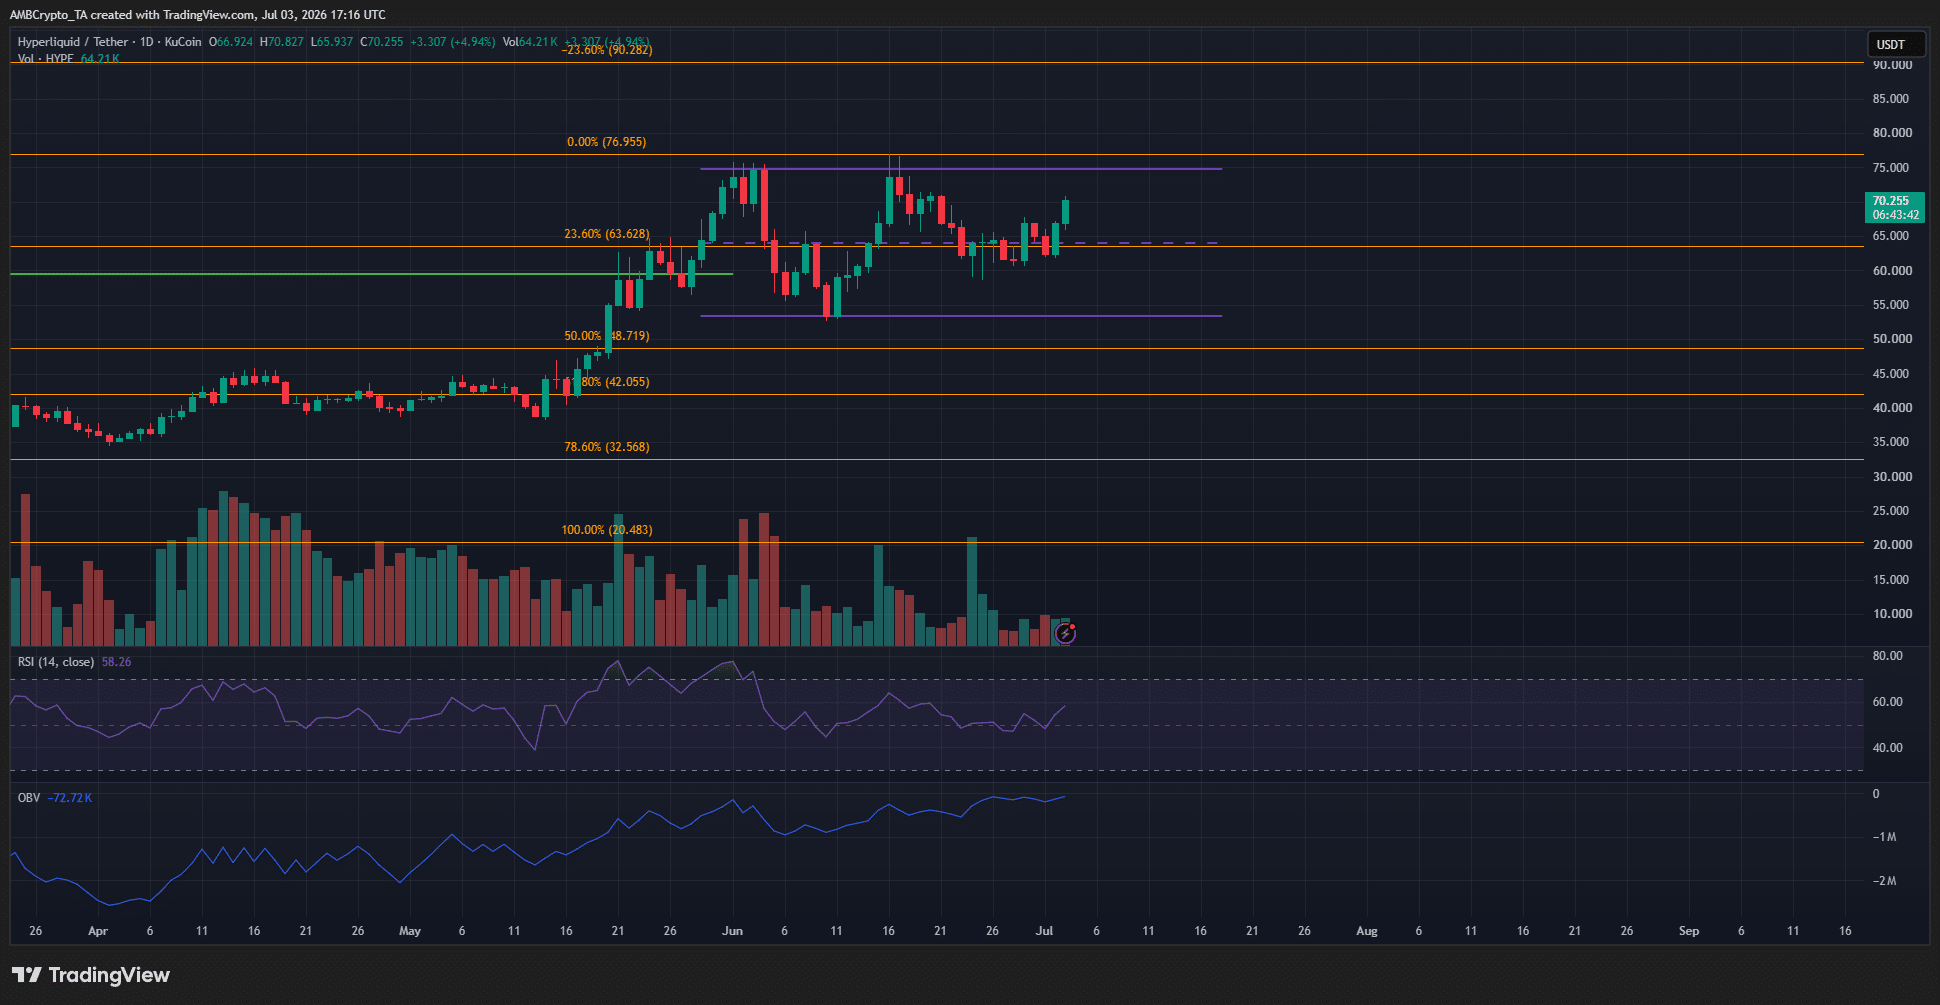
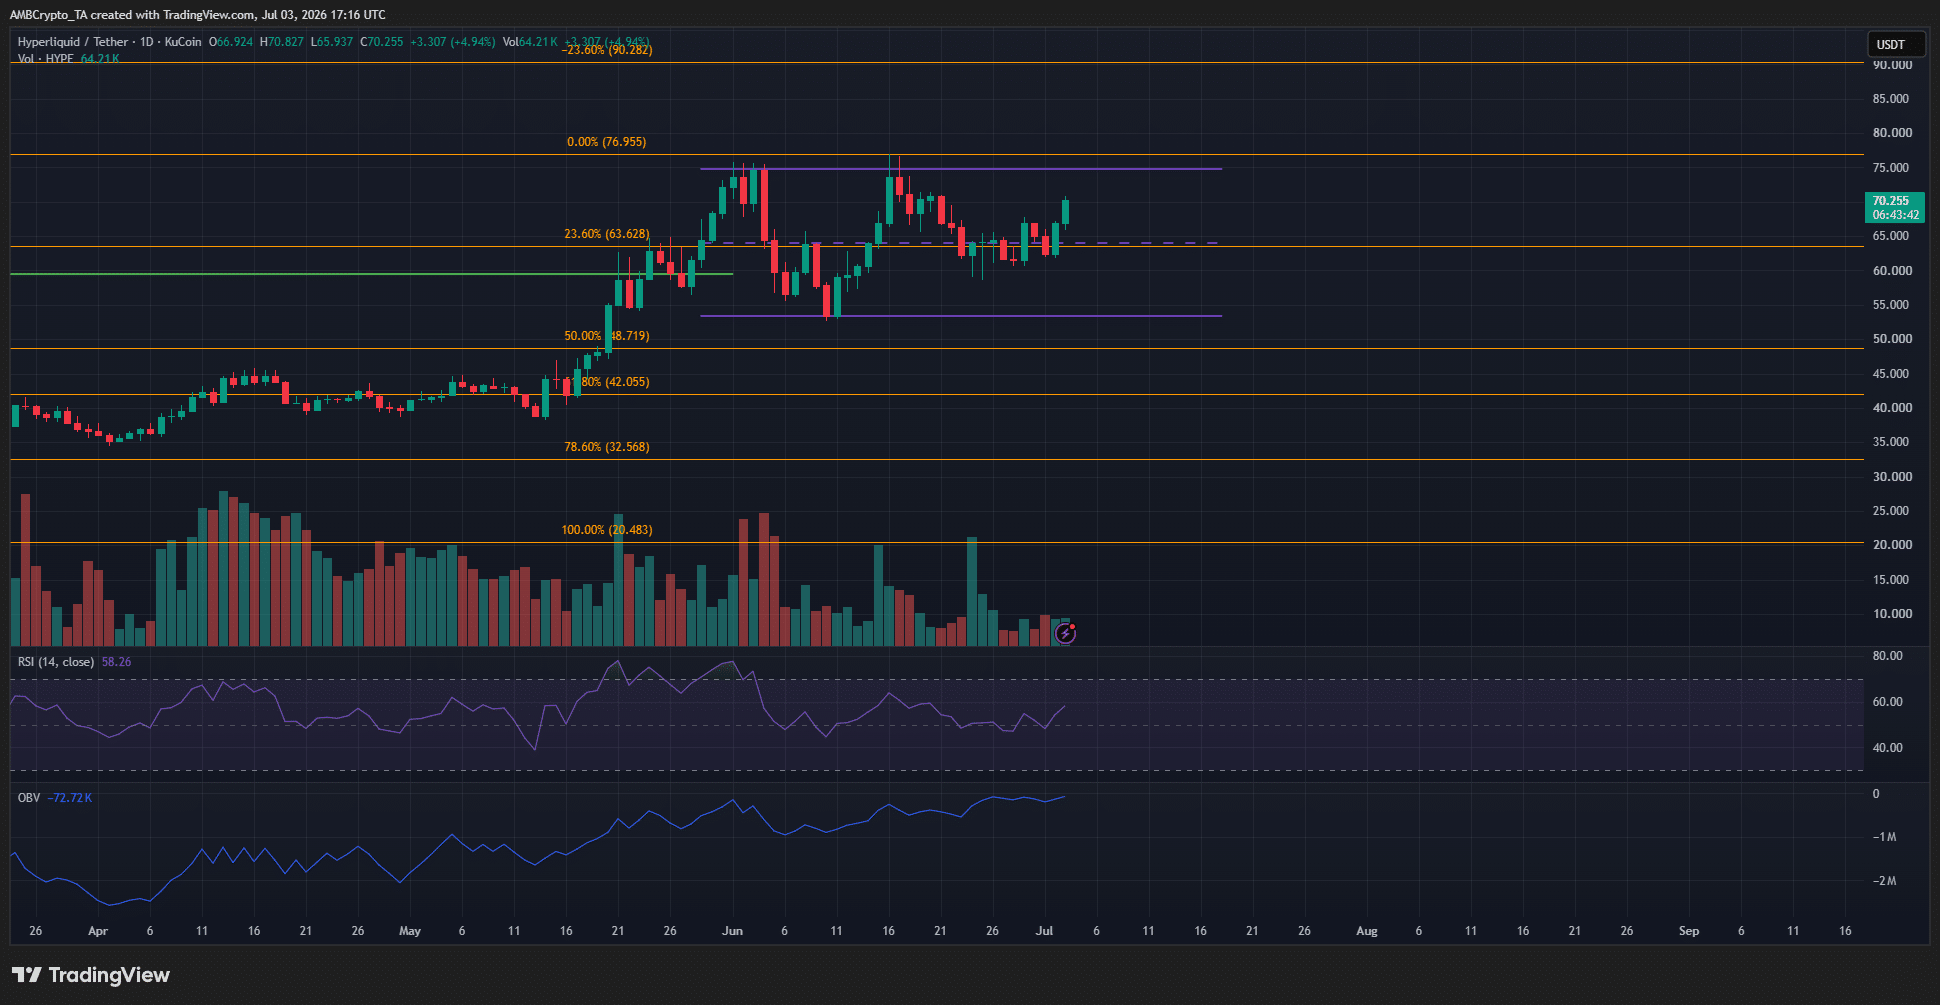
Over the past month of trading, the DEX token has formed a range [purple] between $53.35 and $74.78. At the time of writing, the price was above the mid-range resistance at $64.1 and also the short-term resistance zone at $67.2.

This upward push came despite some profit-taking by whales. The selling was being absorbed by the demand in the market.

Combined with the recent bullish momentum for Bitcoin, it appeared likely that HYPE can continue higher toward $75.

The OBV was climbing steadily, and the RSI remained above neutral 50. Together, they signaled steady buying pressure and intact bullish momentum.

Traders’ call to action- Wait
Source: HYPE/USDT on TradingView

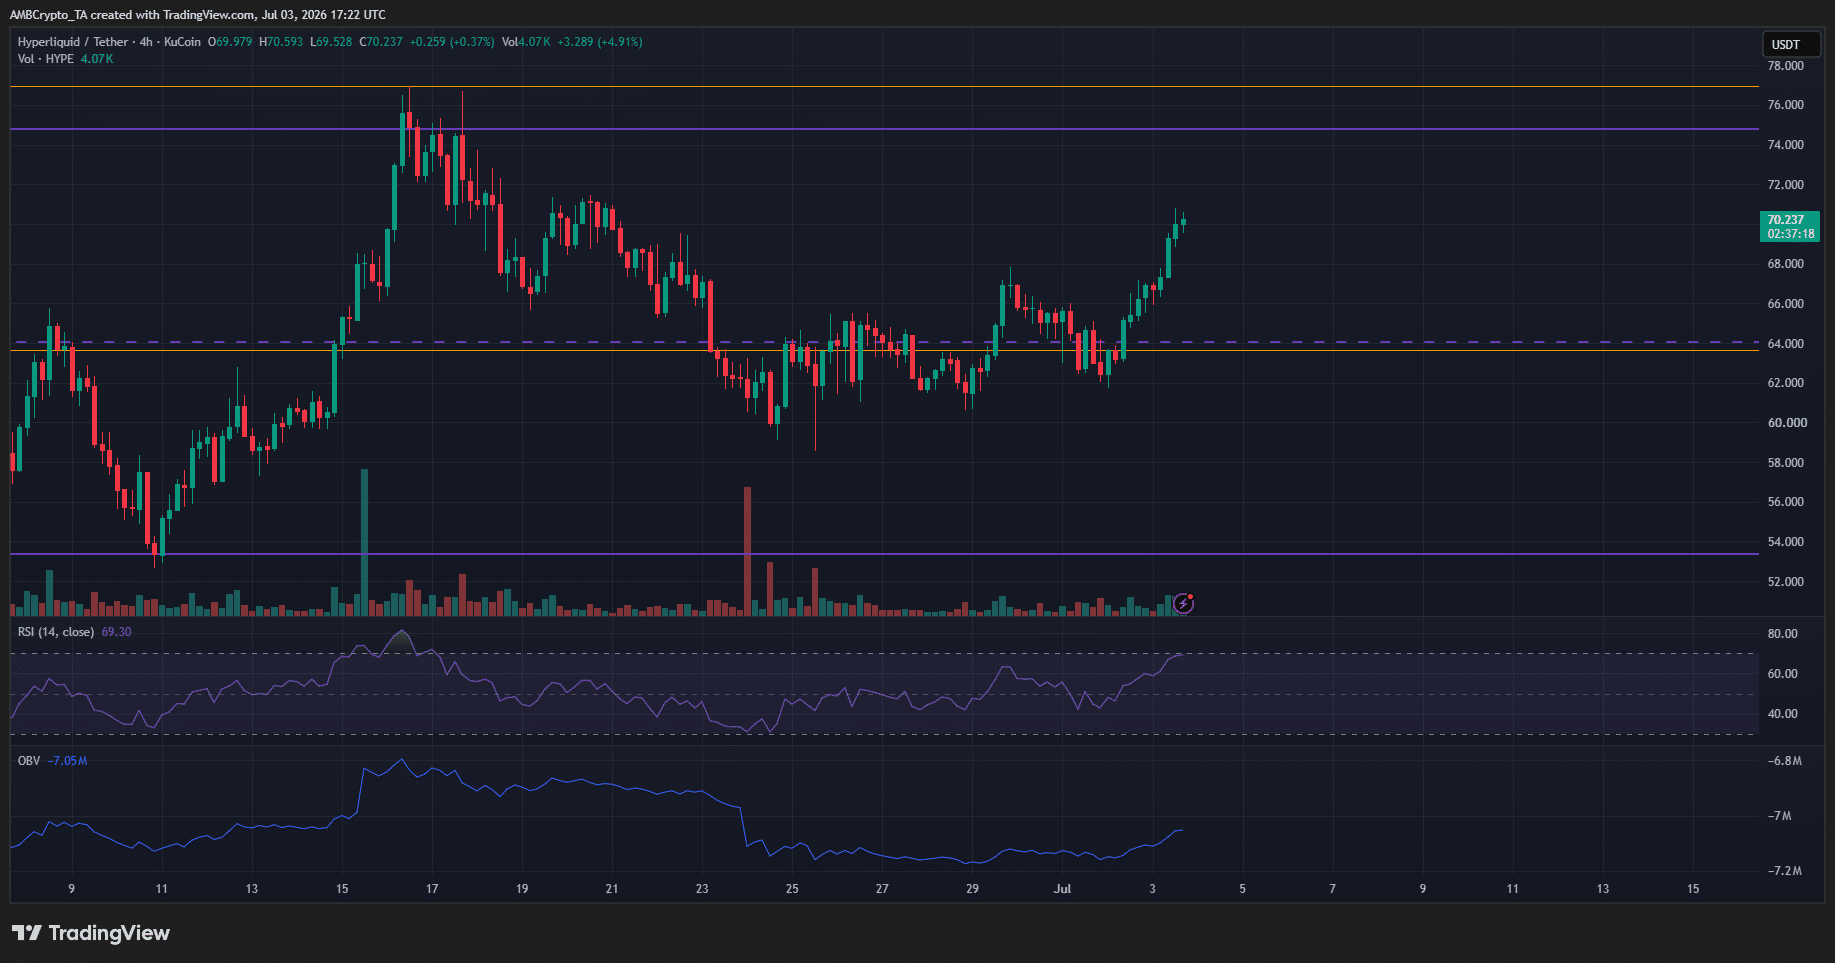
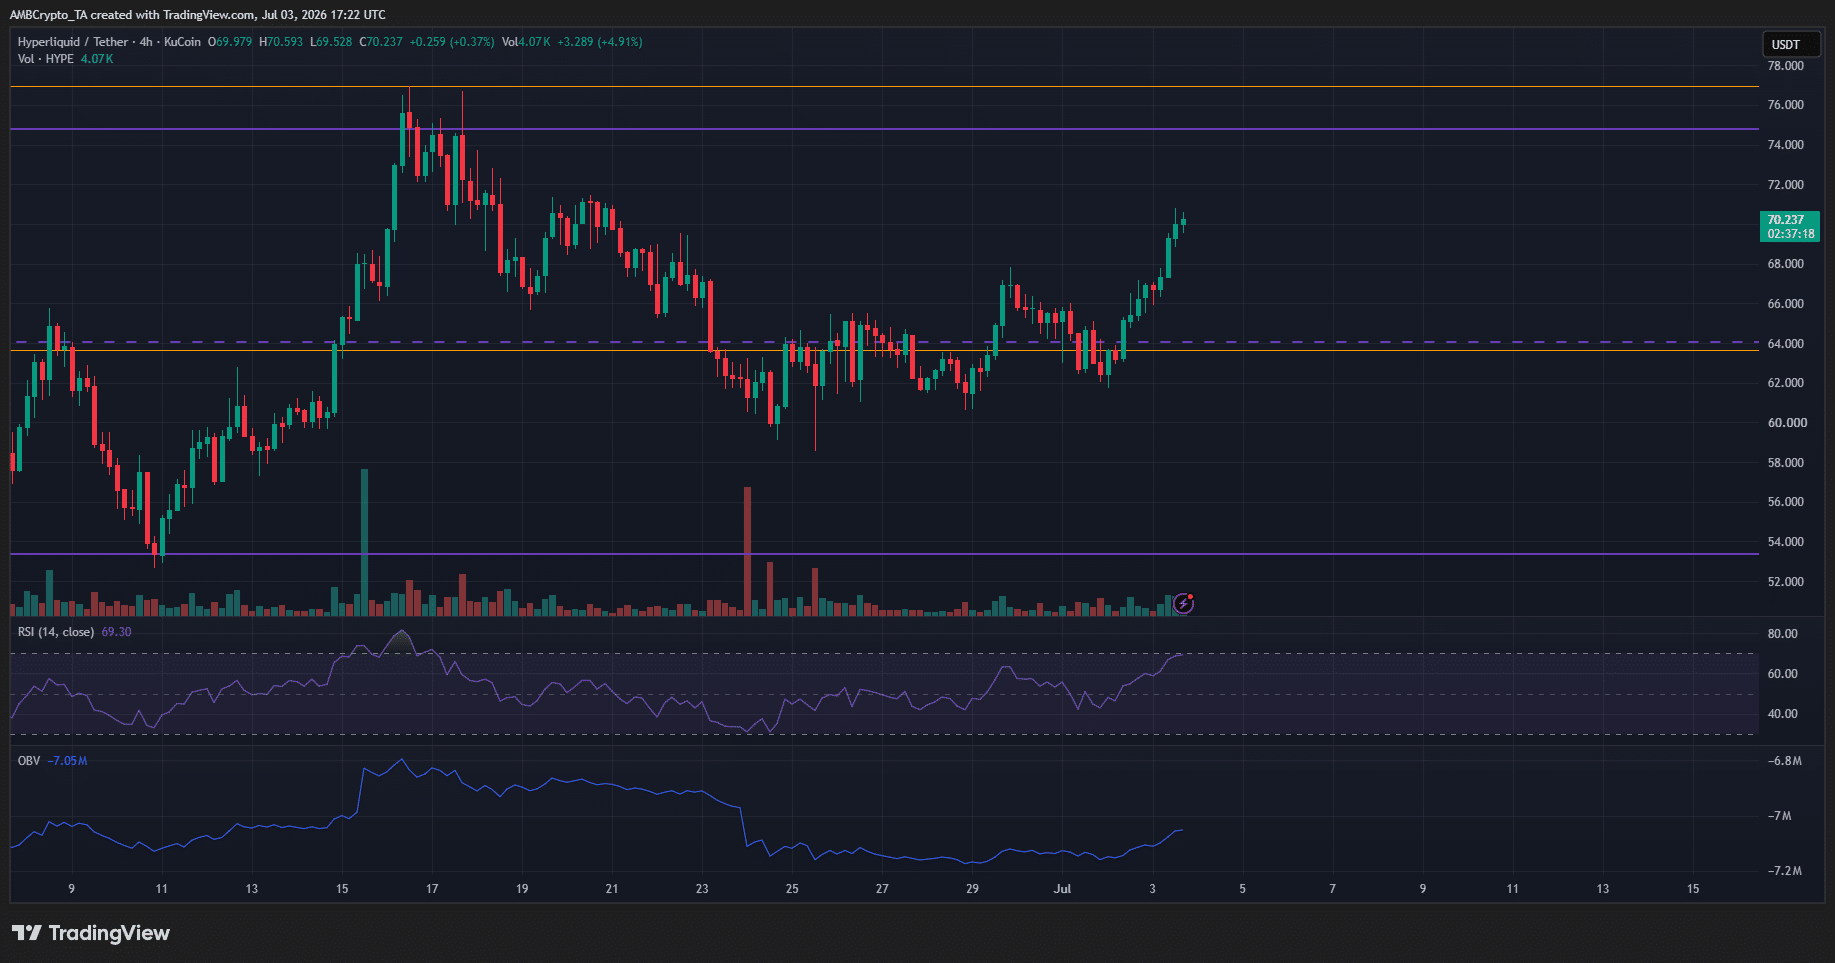
The range formation needs to be cleared for the next decisive higher timeframe move. Within this range, a test of either extreme can offer swing traders an opportunity to enter.

Right now, this opportunity was not at hand. The risk-to-reward was not ideal for swing traders at the time of writing.

The technical indicators favored short-term upside. Therefore, a move toward the $75 supply zone and a bearish reaction from there can be used to sell the token, targeting the mid-range and range-low support levels.


Final Summary

  • Hyperliquid was one of the only large-cap crypto assets that maintained a long-term bullish trend.
  • The $75 supply zone was vital for swing traders. A breakout past, or a rejection from, this area would be a signal for traders to place directional bets.


Trending Cryptos

Related Questions

QWhat is the key price level for Hyperliquid (HYPE) mentioned in the article, and why is it significant for traders?

AThe key price level is $75. It is a significant supply zone. A breakout above this level or a rejection from it would signal traders to place directional bets, as it would help determine the next decisive move for the token's price.

QWhat has been the overall long-term trend for Hyperliquid (HYPE), and how does it differ from most other altcoins mentioned?

AHyperliquid (HYPE) has maintained a firmly bullish long-term trend for over a year. This contrasts with most other altcoins, which have been trending downward since October 2025 and never really established a sustained uptrend.

QAccording to the article, what do the On-Balance Volume (OBV) and RSI indicators suggest about HYPE's current market momentum?

AThe On-Balance Volume (OBV) is climbing steadily, and the Relative Strength Index (RSI) remains above the neutral level of 50. Together, these indicators signal steady buying pressure and intact bullish momentum for HYPE in the short term.

QWhat trading range has HYPE formed over the past month, and what are its key support and resistance levels?

AOver the past month, HYPE has formed a trading range between $53.35 (range-low support) and $74.78. Key levels within this range include the mid-range resistance at $64.1 and a short-term resistance zone at $67.2.

QWhat is the article's primary recommendation for traders regarding HYPE at the time of writing, and why?

AThe primary recommendation for traders is to wait. The article states that the risk-to-reward ratio is not ideal for swing traders at the current moment. It suggests waiting for a move toward the $75 supply zone and observing the market's reaction (breakout or rejection) to place a trade.

Related Reads

The Robinhood Stock Tokens You Bought Are Just Debts from Jersey Island

The Robinhood stock tokens you buy are essentially debt securities issued by a shell company in Jersey, not real equity. These tokens merely track stock prices like NVIDIA or Apple but grant no shareholder rights like voting or dividends. If the underlying company fails, you have no claim on its assets. Instead, you hold a debt instrument from Robinhood Assets (Jersey) Limited, which promises returns based on stock performance. If this Jersey entity goes bankrupt, you become an unsecured creditor. This complex structure stems from Robinhood's past crisis during the 2021 GameStop short squeeze, where T+2 settlement caused liquidity issues. The blockchain-based tokens enable instant settlement, theoretically preventing such trading halts. The product is classified by the SEC as a "linked security" or structured note, carrying counterparty risk not borne by actual shareholders. It is available globally but excluded from the US, UK, and other major markets, while Robinhood offers a fully compliant, asset-backed token model in Europe under MiFID II. The system relies on oracles for pricing, which poses risks like manipulation and faulty liquidations seen in DeFi exploits. Robinhood profits from spreads and aims to become a full-chain settlement layer. Meanwhile, competitors like Ondo have launched SEC-registered, fully compliant equity tokens in the US with actual voting rights and dividends. Robinhood’s Jersey debt model appears as a transitional, regulatory-arbitrage product, aiming to capture market share ahead of future regulatory clarity.

Foresight News5m ago

The Robinhood Stock Tokens You Bought Are Just Debts from Jersey Island

Foresight News5m ago

Can Open USD Support Stripe's Ambitions?

Can Open USD support Stripe's ambition? The article argues that OUSD represents a pivotal strategic move for Stripe, shifting its narrative from being a superior payments API company to becoming a "money movement network." Unlike simply facilitating payments, this new model aims to organize and define the settlement layer, default assets, and economic distribution rules for future commerce. The analysis highlights OUSD's role in giving Stripe a potential default settlement asset, enabling deeper economics through reserve earnings, and providing a programmable money layer for emerging use cases like AI agentic commerce. Crucially, OUSD is presented not as a direct "USDC killer" but as an attempt to redefine the business model of stablecoins, proposing a collaborative governance structure where contributing partners share in the network's economic benefits and governance. For Stripe, this is about evolving from a powerful "abstraction layer" over traditional financial rails into an active participant and potential architect of the next-generation global settlement network. While OUSD alone cannot immediately realize this ambition, it signals Stripe's intent to move closer to the money layer itself, positioning itself at the center of future money flows in an increasingly automated, platform-driven, and AI-powered economy. The ultimate question is whether Stripe can transition from being a best-in-class payment processor to becoming the foundational infrastructure for internet-native money movement.

marsbit24m ago

Can Open USD Support Stripe's Ambitions?

marsbit24m ago

Trading

Spot

Hot Articles

How to Buy SAND

Welcome to HTX.com! We've made purchasing The Sandbox (SAND) simple and convenient. Follow our step-by-step guide to embark on your crypto journey.Step 1: Create Your HTX AccountUse your email or phone number to sign up for a free account on HTX. Experience a hassle-free registration journey and unlock all features.Get My AccountStep 2: Go to Buy Crypto and Choose Your Payment MethodCredit/Debit Card: Use your Visa or Mastercard to buy The Sandbox (SAND) instantly.Balance: Use funds from your HTX account balance to trade seamlessly.Third Parties: We've added popular payment methods such as Google Pay and Apple Pay to enhance convenience.P2P: Trade directly with other users on HTX.Over-the-Counter (OTC): We offer tailor-made services and competitive exchange rates for traders.Step 3: Store Your The Sandbox (SAND)After purchasing your The Sandbox (SAND), store it in your HTX account. Alternatively, you can send it elsewhere via blockchain transfer or use it to trade other cryptocurrencies.Step 4: Trade The Sandbox (SAND)Easily trade The Sandbox (SAND) on HTX's spot market. Simply access your account, select your trading pair, execute your trades, and monitor in real-time. We offer a user-friendly experience for both beginners and seasoned traders.

5.1k Total ViewsPublished 2024.03.29Updated 2026.06.02

How to Buy SAND

Discussions

Welcome to the HTX Community. Here, you can stay informed about the latest platform developments and gain access to professional market insights. Users' opinions on the price of SAND (SAND) are presented below.

活动图片