以太坊价格测试 2400 美元,累积器增持 24.6 万枚 ETH:价格能涨到多高?

Cointelegraph中文Published on 2026-05-07Last updated on 2026-05-07

Abstract

受以太坊累积钱包余额增加和技术结构走强的推动,以太坊价格在未来几天内可能上涨至 3500 美元。

周三,以太坊累积地址的每日资金流入量激增,表明在以太坊 ( ETH ) 价格最近上涨至 2400 美元之后,人们对以太坊的长期价格走势越来越有信心。

要点总结:

周三,累积地址吸收了约 5.92 亿美元的 ETH,表明存在积极的长期买盘。

以太坊上升三角形预示着 ETH 价格将上涨至 3,315 美元。

以太坊累积器新增价值 5.92 亿美元的 ETH

以太坊价格从多年低点 1750 美元以下反弹 39% 后,投资者对以太坊的信心似乎正在改善。

CryptoQuant 的数据显示,自 2025 年年中以来,流入累积地址的每日资金稳步增长,并在 2025 年 11 月达到 114 万 ETH 的历史最高水平。2026 年,资金流入继续攀升,平均每天达到 20 万 ETH。

这些地址周二收到了 246,620 个 ETH,按当前汇率计算价值约 5.92 亿美元。
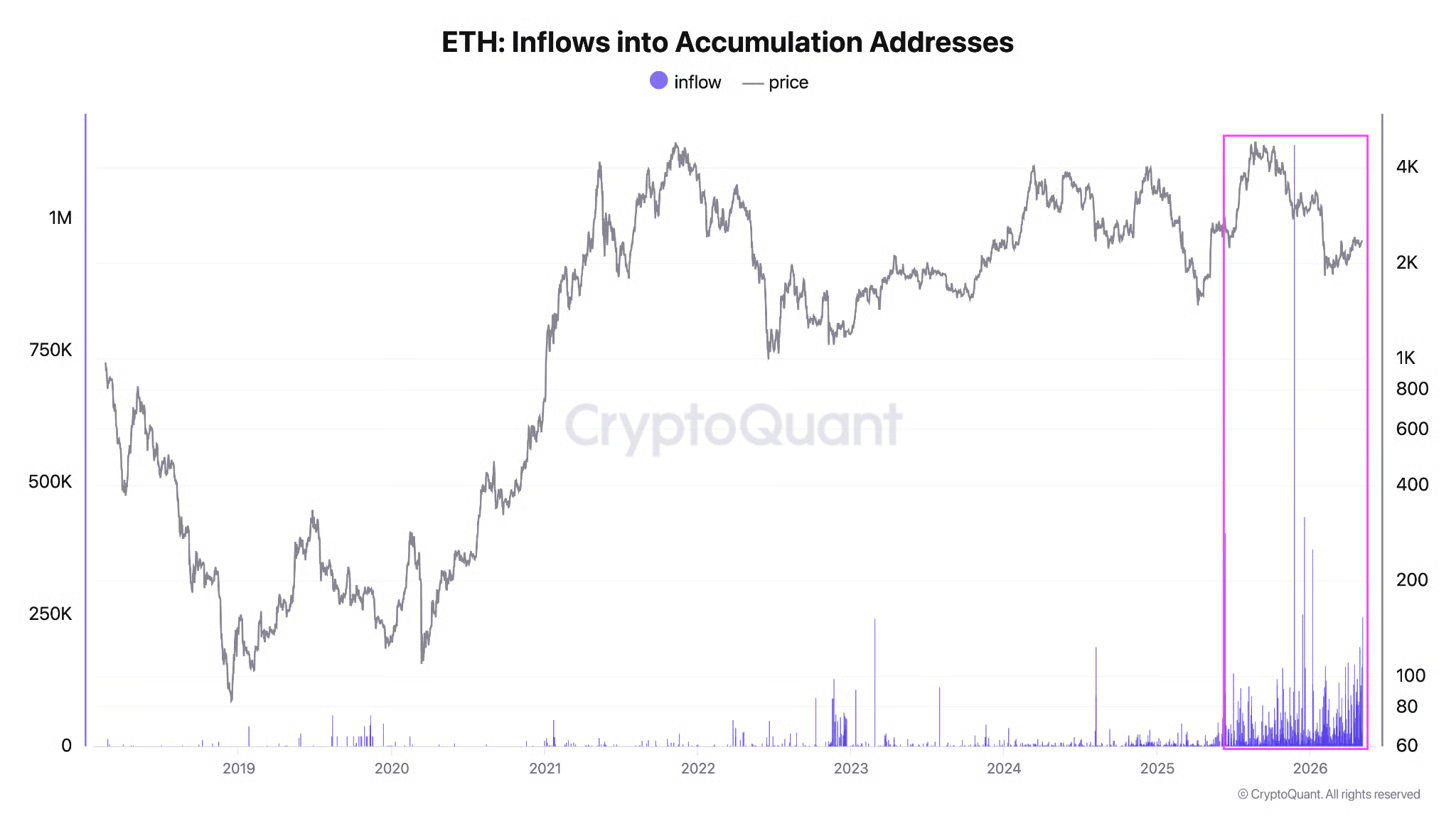
累积地址是指持续接收 ETH 而不进行任何转出交易的钱包。它们可能属于长期持有者、机构投资者或策略性地累积以太坊而非积极交易的实体。

因此,这些长期持有者持有的 ETH 总数达到了创纪录的 2500 万 ETH,2026 年至今增长了 20.36%。

这些地址的资金流入大幅增加通常表明人们对以太坊的长期潜力充满信心,过去的趋势表明,这种激增往往预示着价格上涨。

例如,2025年6月22日,以太坊累积地址记录到超过38万枚ETH的日流入量。近30天后,ETH价格上涨了近85%。2025年11月,累积地址的资金流入激增,随后也出现了类似的价格上涨。

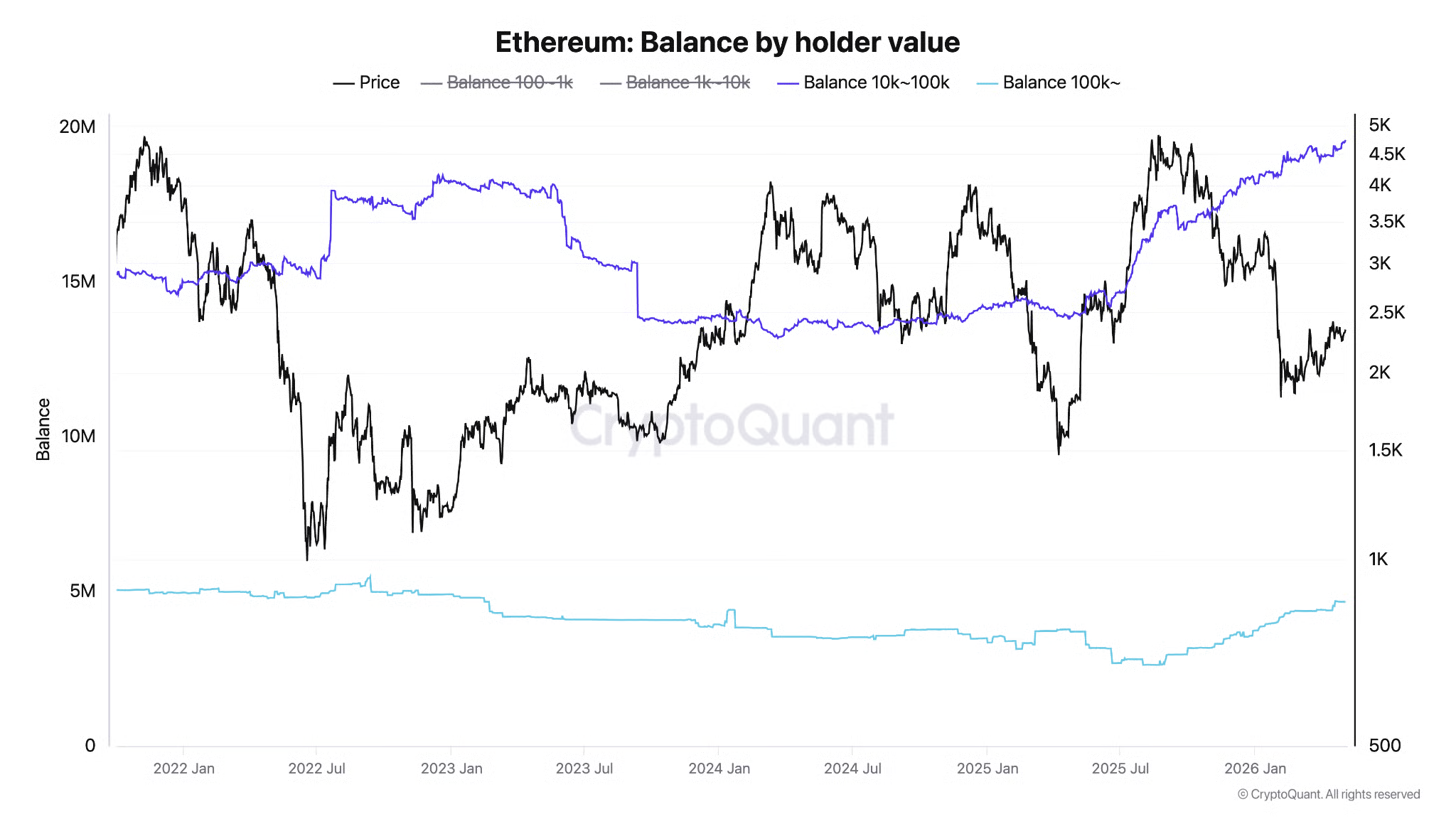
巨鲸钱包也显示出看涨信号。下图显示,余额在 1 万至 10 万 ETH 之间的巨鲸钱包,其持仓量在过去 30 天内快速增长,已达到超过 1950 万的历史新高。

持有超过 10 万枚 ETH 的钱包也将其持有量增加到 470 万枚 ETH,到 2026 年增长了 30%。
据 Cointelegraph报道,以太坊现货交易累计交易量变化自 4 月初以来一直在增加,这也表明买家信心正在增强。

以太坊价格能涨到多高?

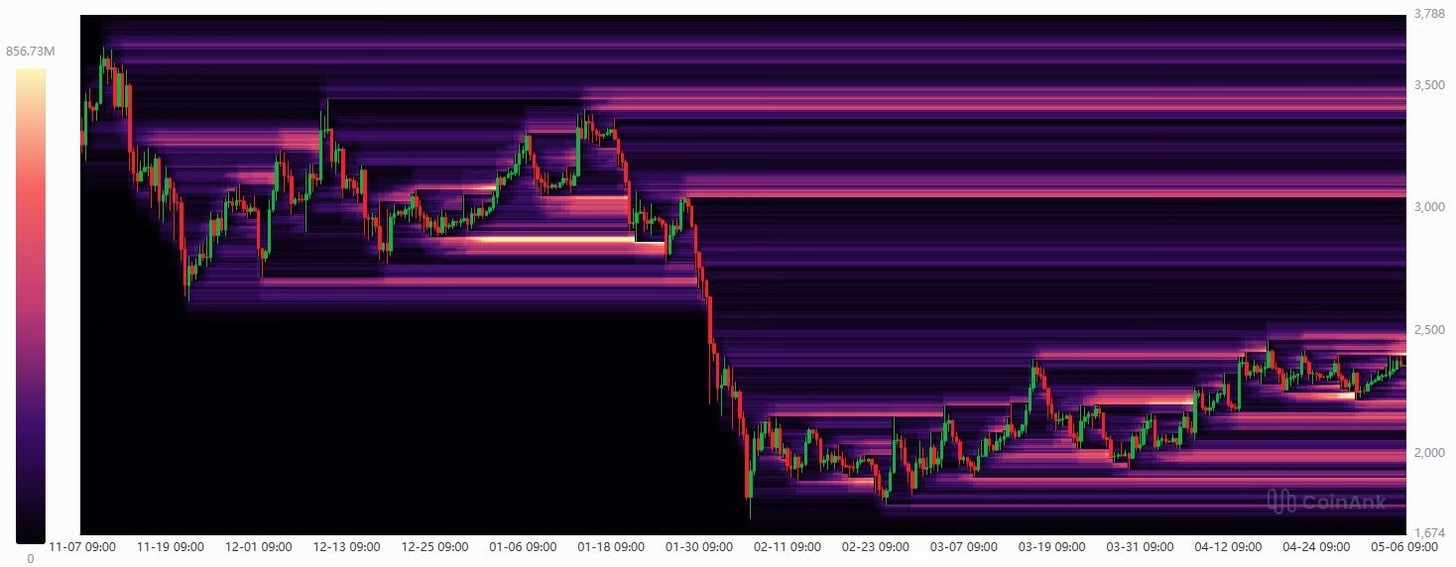
以太坊的清算热图显示,价格正在蚕食 2400 美元附近的流动性,而大额买单仍然停留在 3000 美元,以及 3350 美元到 3500 美元之间。

“如果以太坊价格突破 2500 美元,接下来将稳步上涨至 3000 美元,”加密货币分析师 CW8900周三在 X 论坛上发帖称,并补充道:

“做空几乎没有阻力。”
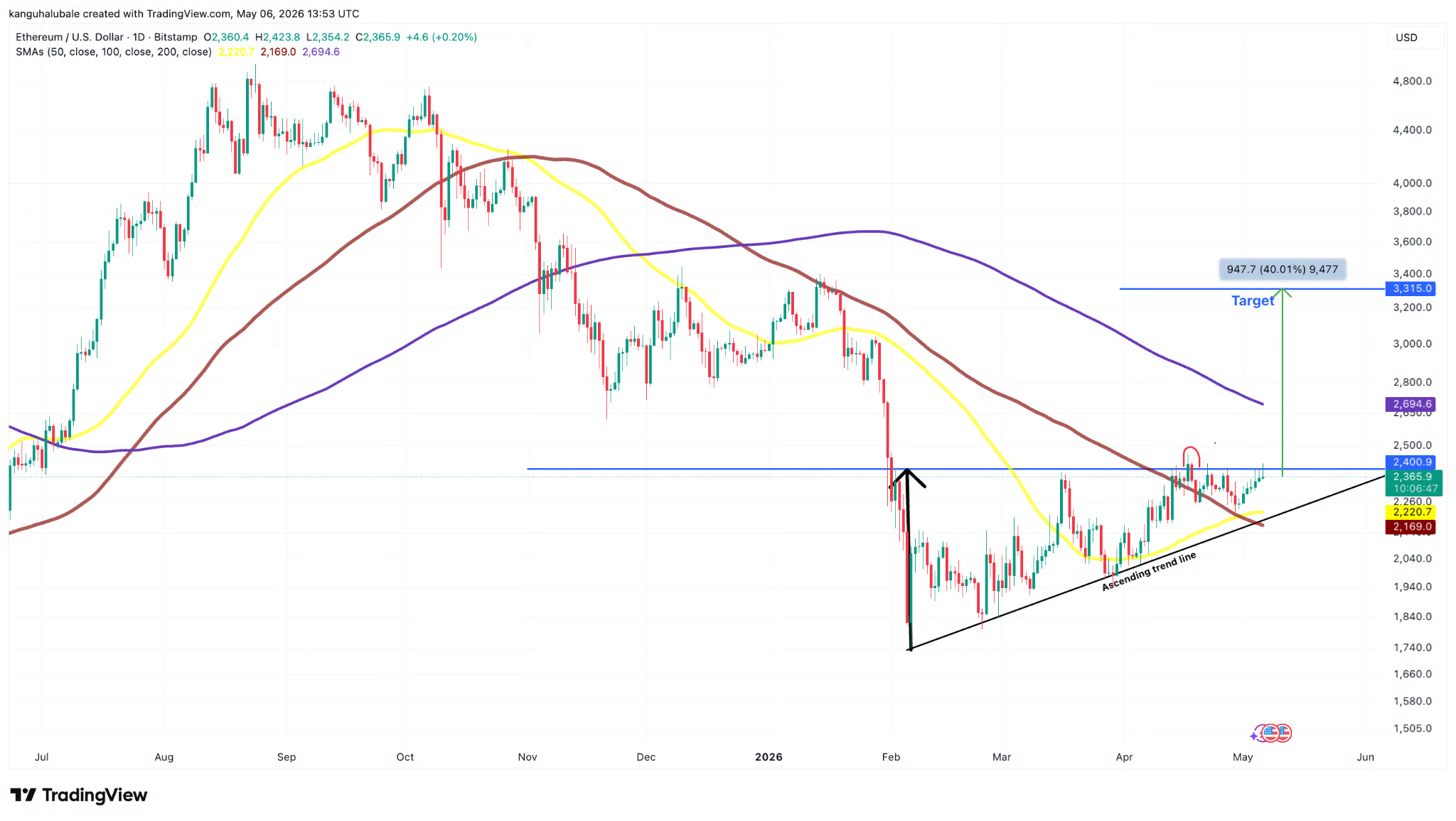
从技术角度来看,ETH/USD 货币对正试图突破 2400 美元的上升三角形水平趋势线。

日线收盘价若高于200日指数移动平均线(2700美元),则将确认上涨趋势延续至三角形目标位3315美元。此举将使总涨幅达到40%。
技术分析师 XForceGlobal分享了一张图表,表明以太坊的宏观底部可能已经形成,艾略特波浪理论分析预测,一旦突破 2600-2700 美元的阻力位,以太坊价格将上涨至 3500 美元。
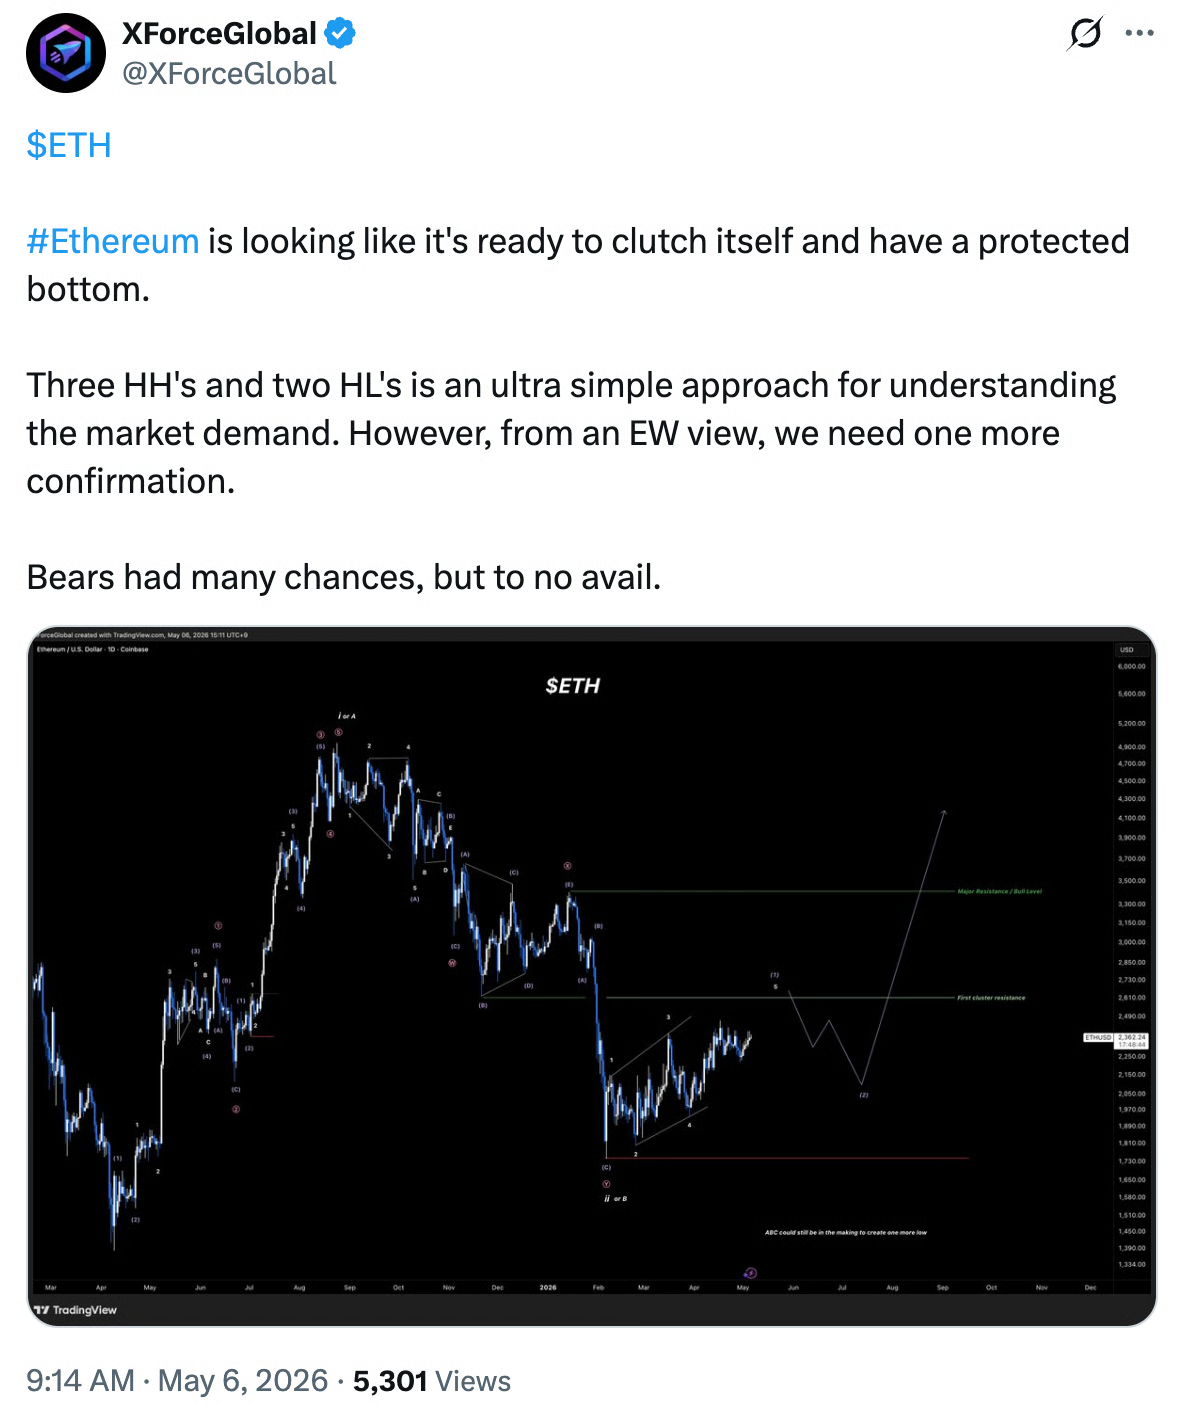
正如 Cointelegraph报道的那样,如果收盘价高于 2600 美元至 2700 美元区域,将确认趋势转变,为 ETH/USD 货币对上涨至 3000 美元铺平道路。


Trending Cryptos

Related Reads

Current State of Web3 Projects: 200 Projects Cease Updates Monthly, Only 70 New Ones Emerge

The article discusses a significant decline in active Web3 projects, based on data from RootData's "2026 Crypto Industry Dead Project Collection." It highlights that approximately 200 projects cease social media updates monthly, while only 70-100 new ones emerge, indicating a net loss in the active project count since mid-2025. RootData's methodology for identifying "dead" projects relies on three objective criteria: official announcements of shutdown, over six months of inactivity across key platforms (like X and Discord), or the inability to access official websites/social accounts. Over 70% of identified dead projects fall into the long-term inactivity category. Currently, RootData tracks over 20,000 crypto projects, with only about 2,200 considered active based on August social media updates. The analysis suggests the crypto industry is undergoing a deep consolidation phase. While infrastructure projects are declining among new entries (now under 10%), new projects are increasingly focused on application and distribution layers, with over 65% in categories like prediction markets, RWA cards, tokenized stocks, perpetual contracts, AI agents, and memecoins. The article concludes that this shakeout, driven by reduced VC funding, may force greater focus on sustainable business models and real user demand, potentially strengthening the ecosystem's long-term health.

marsbit1h ago

Current State of Web3 Projects: 200 Projects Cease Updates Monthly, Only 70 New Ones Emerge

marsbit1h ago

Unexpectedly Negative! US July Retail Sales Drop 0.6% Month-over-Month, Marking the Largest Decline in Over a Year

U.S. Retail Sales Unexpectedly Fall Sharply in July U.S. retail sales in July declined by 0.6% month-on-month, marking the largest drop since May 2025 and falling significantly short of the market expectation for a 0.1% gain. The cooling demand, driven by decreases in auto purchases and online sales, has prompted a more cautious outlook on consumer spending resilience for the second half of the year. The closely watched "control group" sales, which exclude autos, gasoline, building materials, and food services and directly feed into GDP calculations, fell 0.4%, missing expectations of a 0.3% increase. Core retail sales (excluding autos and gasoline) also fell 0.2%, against an anticipated 0.3% rise. Economists attribute the weakness to several factors: the fading boost from excess tax refunds earlier in the year, a decline in personal savings rates, and temporary disruptions. These include the shift of major promotional events like Amazon's Prime Day to June, hot weather around the July 4 holiday, and the post-World Cup spending lull. Specific categories like clothing, gasoline, and furniture saw declines. Notably, the consumption slowdown is accompanied by a shift in spending patterns across income groups. Recent data shows spending growth among low-income households has outpaced that of high-income households in recent weeks, even for discretionary goods, suggesting a potential convergence from the previous "K-shaped" economic recovery into a more uniform "C-shaped" pattern. Year-on-year, retail sales still grew 5.0%, indicating an overall robust level, but the sharp monthly miss is expected to increase pressure for downward revisions to Q3 GDP growth forecasts.

marsbit1h ago

Unexpectedly Negative! US July Retail Sales Drop 0.6% Month-over-Month, Marking the Largest Decline in Over a Year

marsbit1h ago

Trading

Spot

Hot Articles

Discussions

Welcome to the HTX Community. Here, you can stay informed about the latest platform developments and gain access to professional market insights. Users' opinions on the price of ETH (ETH) are presented below.

活动图片