Bitcoin Cash fails at $478 – But can BCH bulls defend $406 next?

ambcryptoPublished on 2026-04-09Last updated on 2026-04-09

Abstract

Bit# 1. 两数之和 ## 一个无序数组,找到两个数,等于目标值,返回这两个数的下标 ### 思路 1. 暴力法,两层循环,时间复杂度O(n^2) 2. 使用哈希表,存储每个数对应的下标,遍历数组,对于每个数,查找目标值减去该数的值是否在哈希表中,如果在,返回两个下标,时间复杂度O(n) ### 代码 ```java class Solution { public int[] twoSum(int[] nums, int target) { Map<Integer, Integer> map = new HashMap<>(); for (int i = 0; i < nums.length; i++) { int complement = target - nums[i]; if (map.containsKey(complement)) { return new int[] { map.get(complement), i }; } map.put(nums[i], i); } throw new IllegalArgumentException("No two sum solution"); } }

Bitcoin Cash [BCH] was only down by less than 1% over the past week, and has shed only 1.25% over the past month. It has underperformed Bitcoin [BTC], which has rallied 7.5% in a week and was up by just over 1% in 30 days.

This relative weakness of Bitcoin Cash indicated a lack of market belief, but on the surface, it looks harmless.

However, its price action in April has been illuminating. In the battle between bulls and bears, one side was clearly winning.

Spoiler alert, it’s not the Bitcoin Cash bulls
Source: BCH/USDT on TradingView

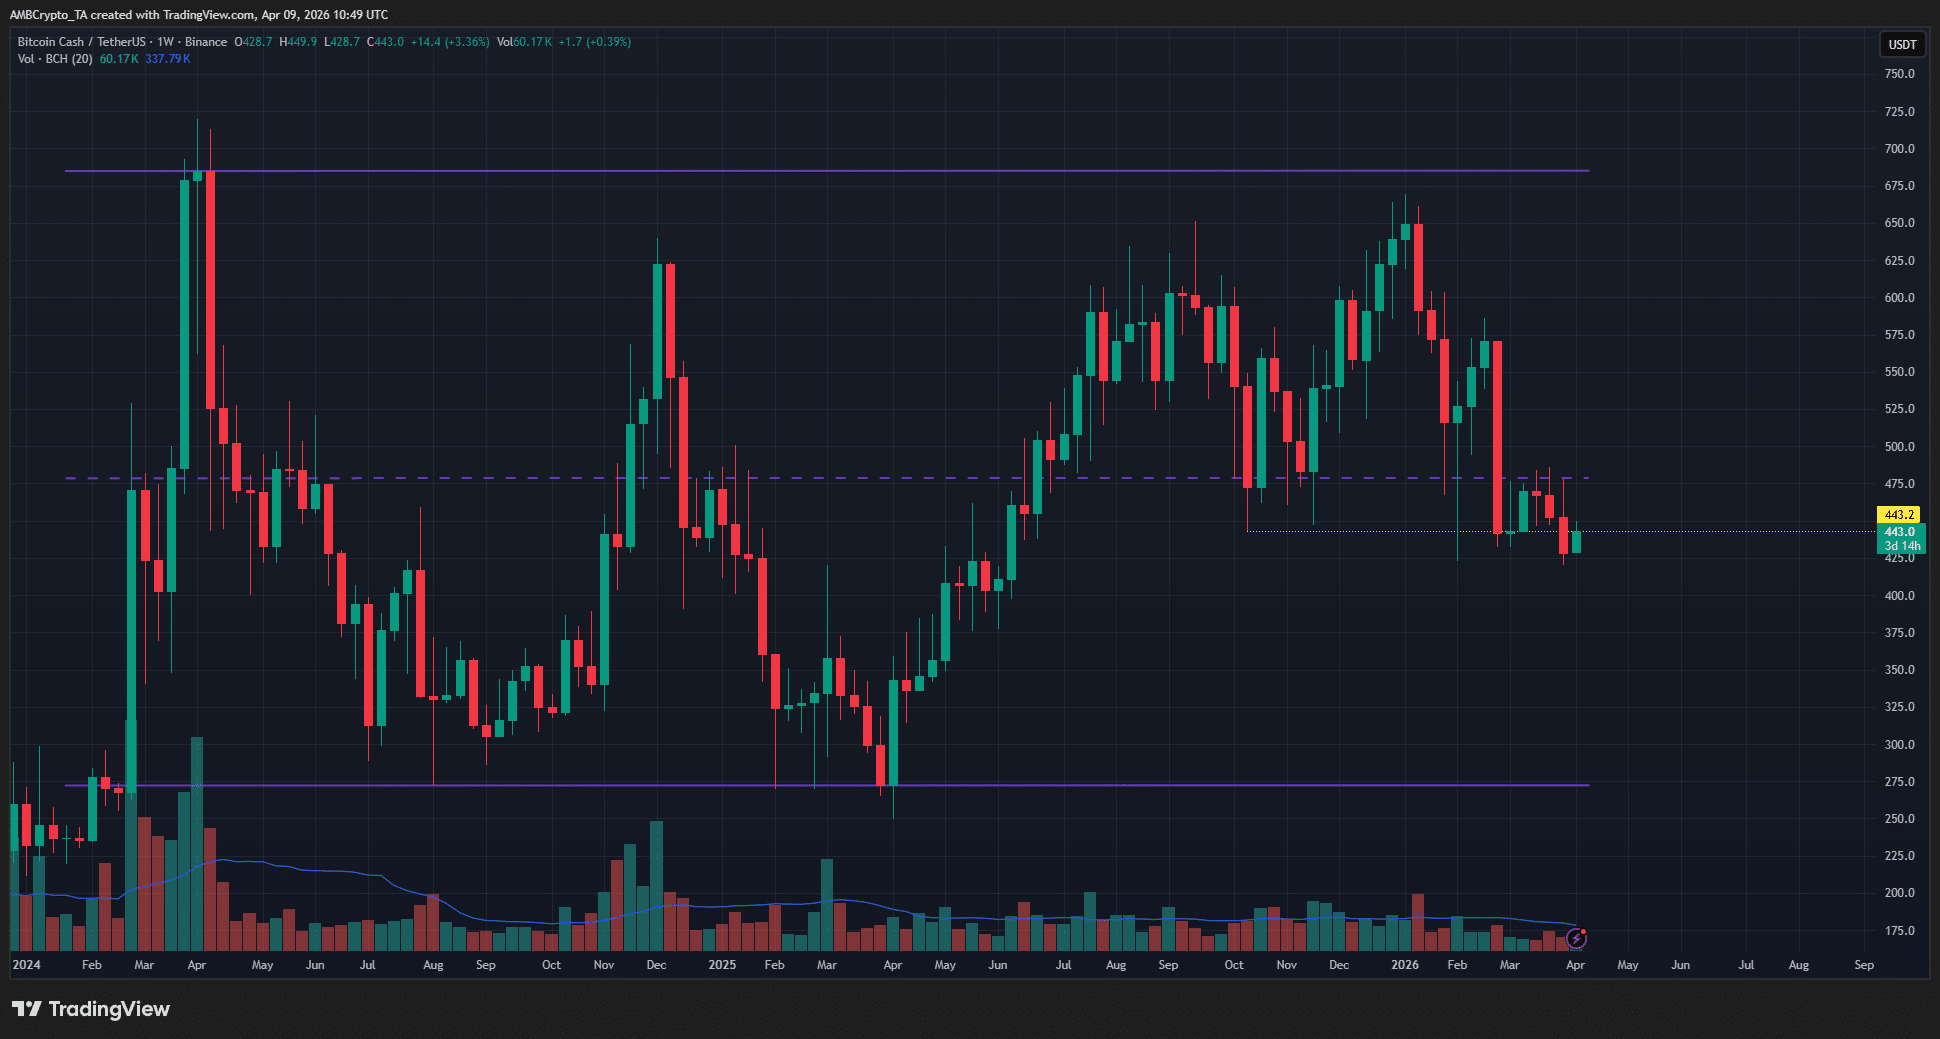
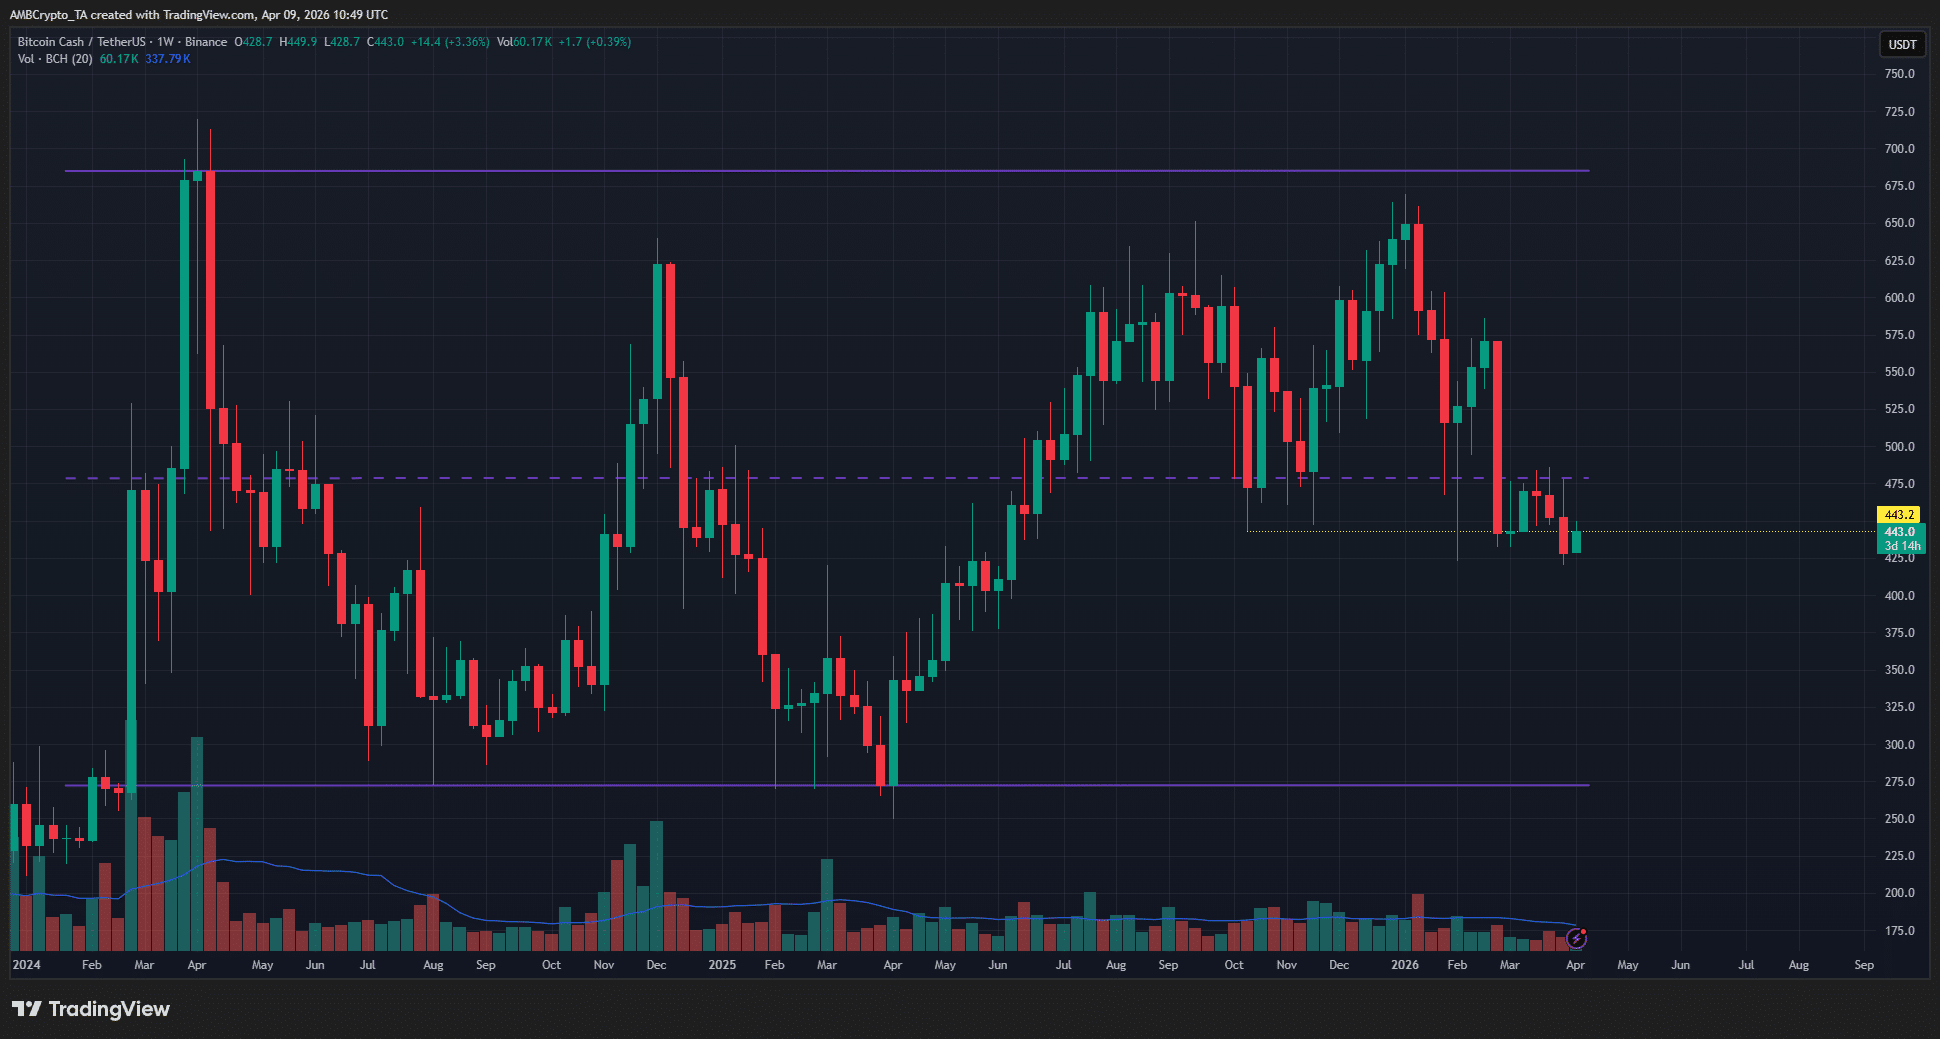
Since February 2024, Bitcoin Cash has been trading within a range (purple) from $272 to $685. The altcoin has tried, and failed, to reach the range highs thrice since December 2024.

In 2025, the mid-range support at $478 acted as support multiple times. Over the past month, it has been tested as a resistance. The failure to break beyond this level during the mid-March crypto rally confirmed that bears were in control.

The $443 low from the October crash was being retested as resistance at the time of writing. Further price losses will likely arrive in the coming months.

Long-term investors can wait for a drop below $300 before looking to buy BCH.

Traders’ call to action- Is it time to sell now?
Source: BCH/USDT on TradingView

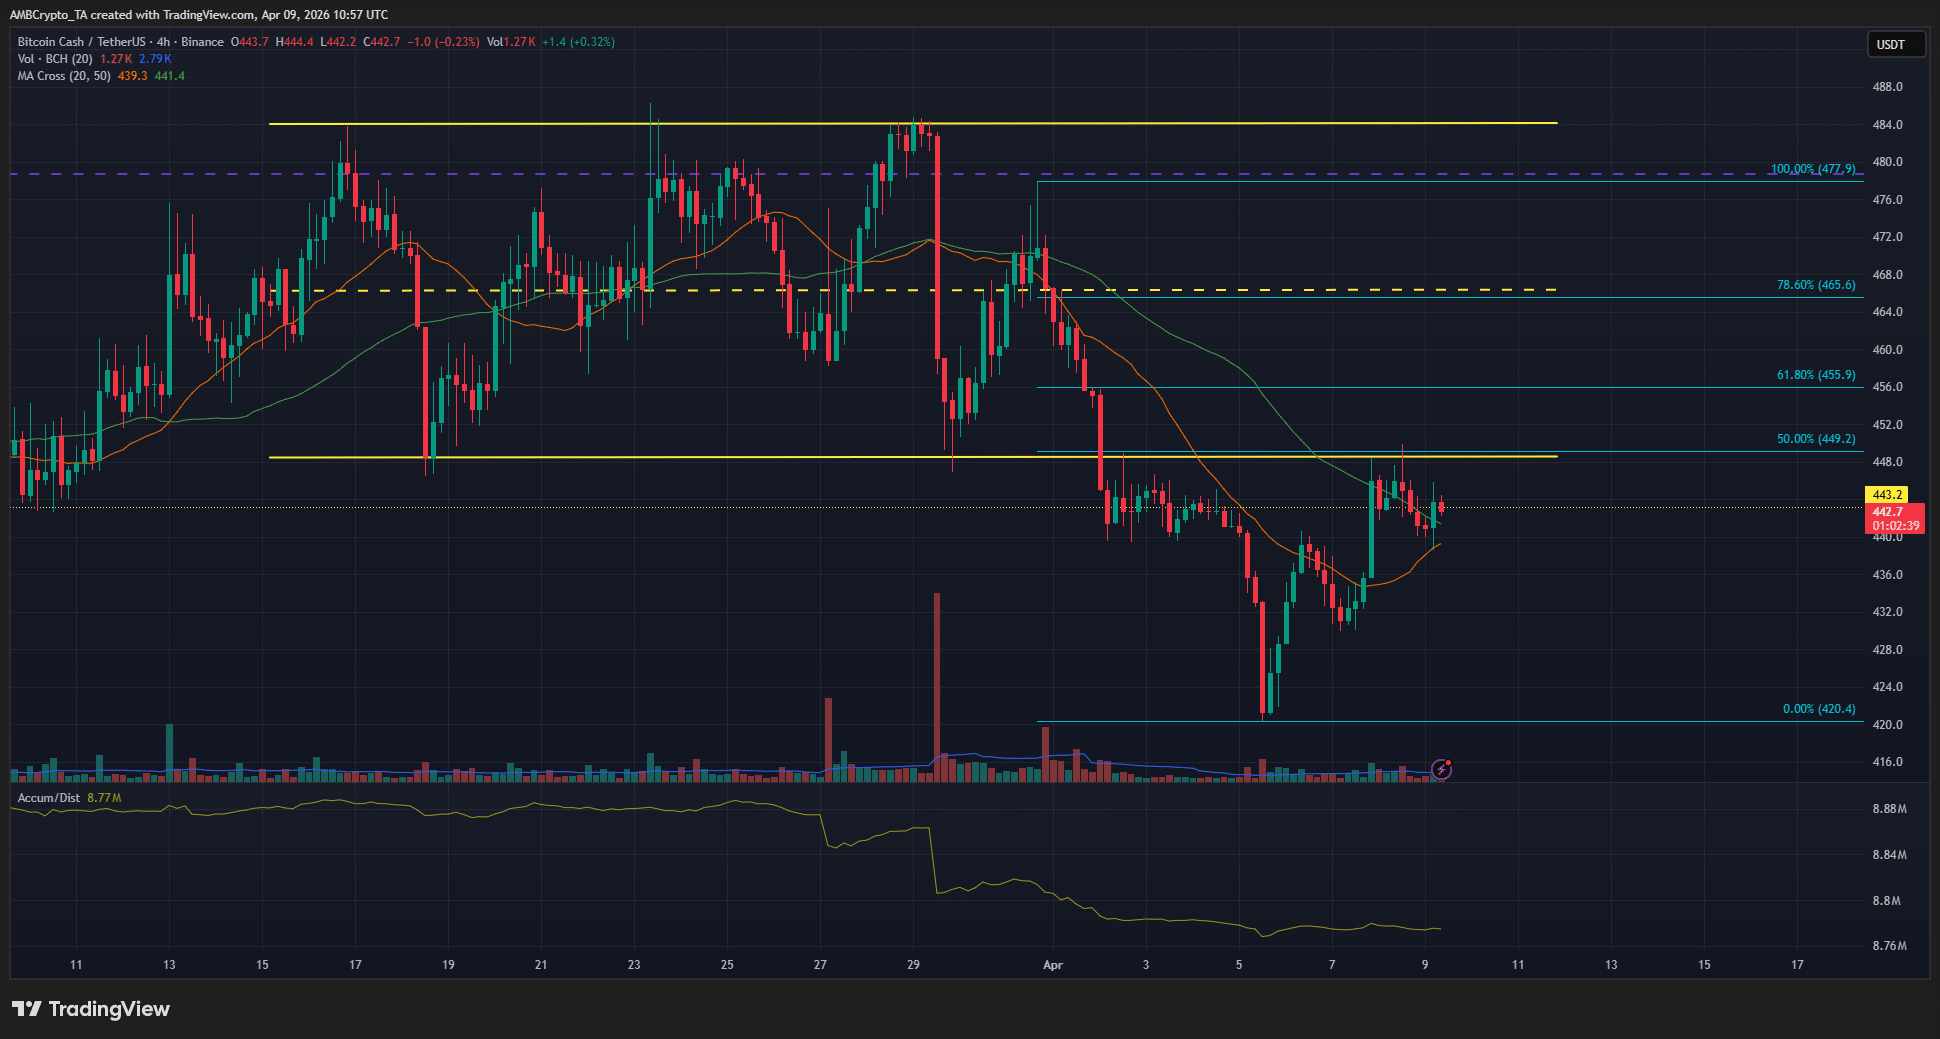
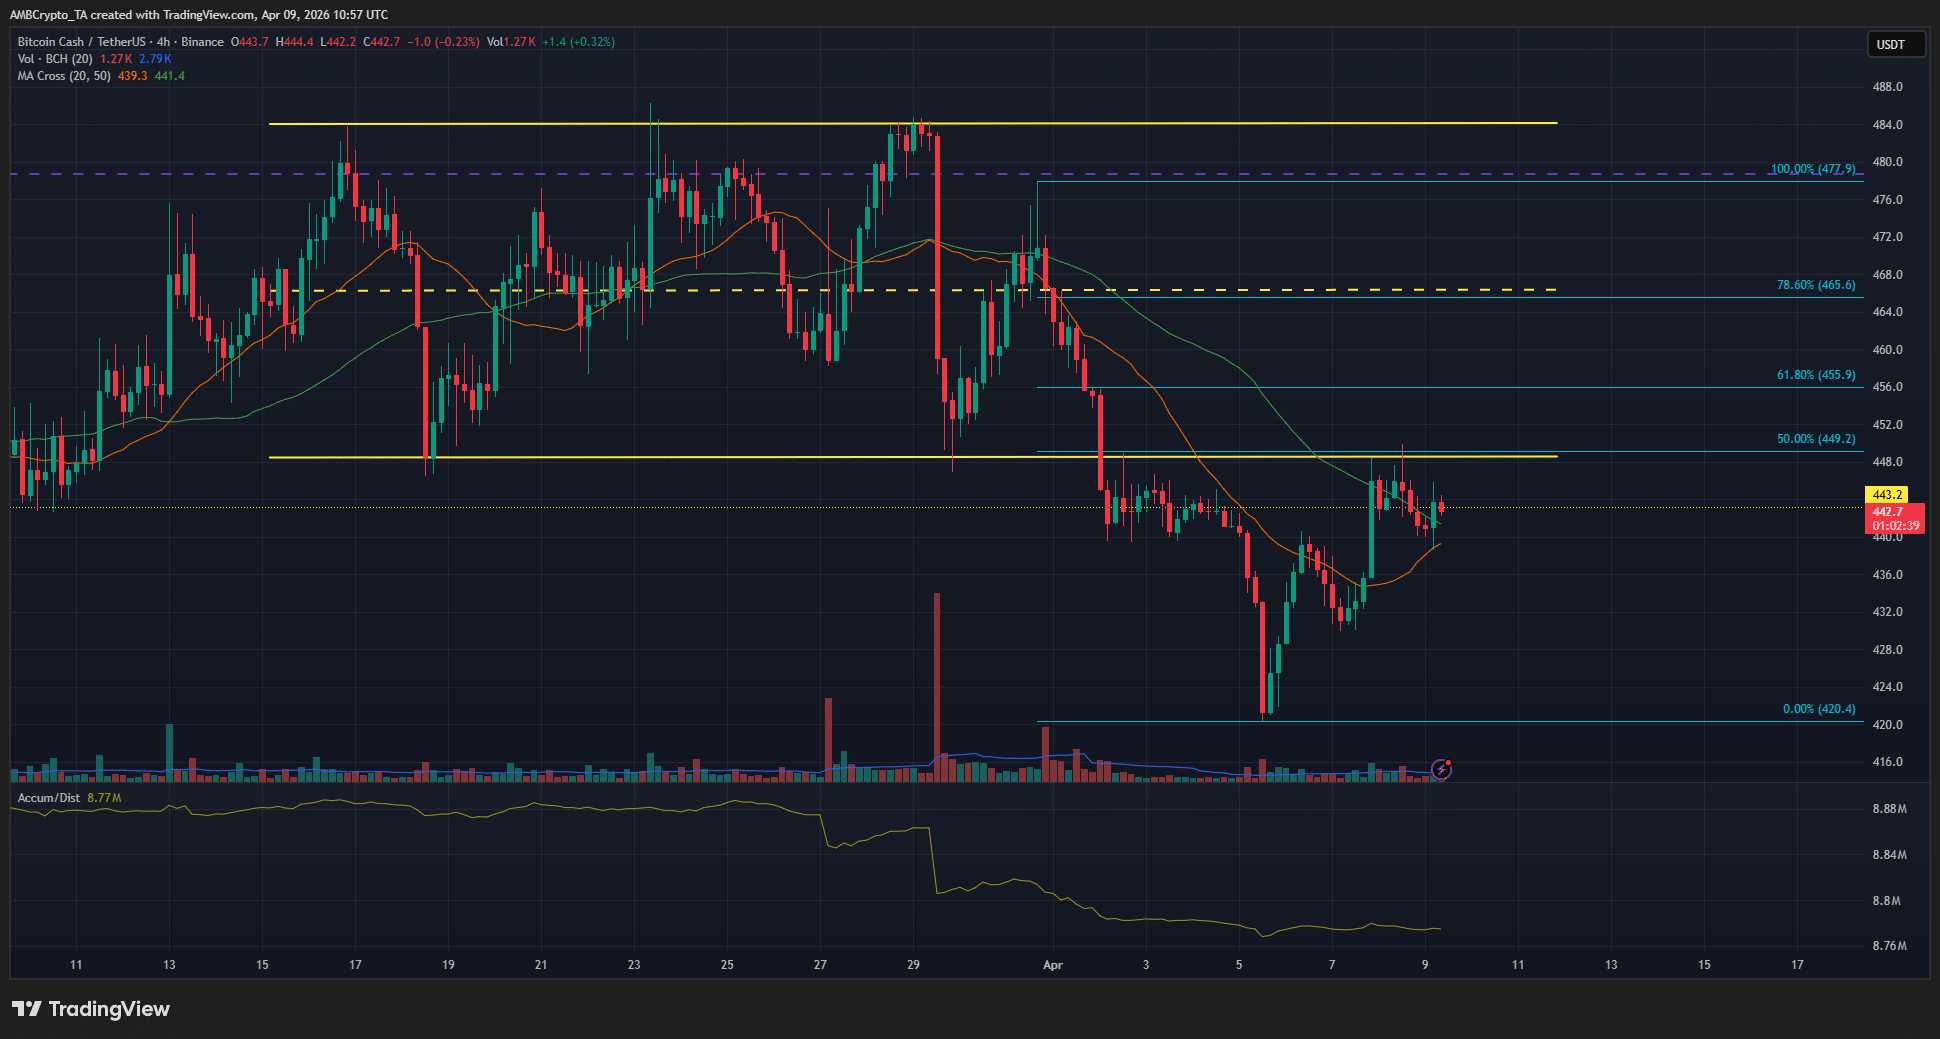
The 4-hour chart showed a bearish swing structure. The short-term range between $448 and $484 was breached at the start of April. The range lows were being retested as resistance at the time of writing.

Moreover, using the H4 swing move downward, a set of Fibonacci retracement levels (cyan) was plotted.

The 50% level at $449.2 has been tested, and the price was beginning to fall lower from there.

There is a chance the current bounce could extend toward $455-$465.

However, the direction of the trend was bearish, and Bitcoin Cash traders need to prepare for a price drop in the coming weeks.

The Fibonacci extension levels showed that $406 and $385 were the next bearish price targets.


Final Summary

  • The short and long-term range formations showed key levels have been breached and warned of further bearish price movement.
  • The next BCH price targets are $306 and $385, although a bounce to $455-$465 was a possibility before such a drop.


Trending Cryptos

Related Questions

QWhat is the current price trend of Bitcoin Cash (BCH) compared to Bitcoin (BTC) over the past week and month?

ABitcoin Cash was down by less than 1% over the past week and shed 1.25% over the past month, underperforming Bitcoin, which rallied 7.5% in a week and was up by just over 1% in 30 days.

QWhat key resistance level did Bitcoin Cash fail to break beyond during the mid-March crypto rally?

ABitcoin Cash failed to break beyond the mid-range resistance at $478 during the mid-March crypto rally, confirming bearish control.

QWhat are the next bearish price targets for Bitcoin Cash according to the Fibonacci extension levels?

AThe next bearish price targets for Bitcoin Cash are $406 and $385.

QWhat is the suggested action for long-term investors regarding Bitcoin Cash based on the analysis?

ALong-term investors are advised to wait for a drop below $300 before looking to buy BCH.

QWhat is the possibility of a price bounce before a further drop, and to what level could it extend?

AThere is a possibility the current bounce could extend toward $455-$465 before a further price drop occurs.

Related Reads

Interview with Robinhood Executive: Meme + Tokenized US Stocks as "Barbell" Customer Acquisition Strategy, All Business Lines Achieve Hundreds of Millions in Revenue

Interview with Robinhood executive Johann Kerbrat reveals the company's "barbell" customer acquisition strategy for its new Robinhood Chain, combining meme tokens with tokenized stocks. Three weeks after mainnet launch, the chain has seen over $3B in weekly DEX volume and 105M transactions. Kerbrat explains the logic behind the permissionless chain: meme tokens attract DeFi users, while tokenized real-world assets (RWA), currently over 90 US stocks and ETFs accessible in 120+ countries, serve global users. The goal is to bring Robinhood's 27 million funded accounts on-chain by simplifying DeFi with a user-friendly interface, exemplified by features like Robinhood Earn which offers yield without requiring wallet management. Built on Arbitrum's technology stack for its speed, low cost, and Ethereum's security, the chain focuses on financial products like Earn, spot trading, and perpetuals. Kerbrat downplays direct competition with platforms like Base, emphasizing the goal of expanding the overall market for on-chain assets. He details selective partnerships (e.g., Morpho, Lighter) based on compliance, unique UX, and differentiation. While regulatory clarity is pending for US perpetuals, the expansion continues via Bitstamp in Europe. Finally, Kerbrat positions Robinhood as a "super app" integrating stocks, options, crypto, banking, and AI trading, with all major business lines generating hundreds of millions in revenue. For the chain, current priority is driving adoption over maximizing gas fee revenue.

marsbit1h ago

Interview with Robinhood Executive: Meme + Tokenized US Stocks as "Barbell" Customer Acquisition Strategy, All Business Lines Achieve Hundreds of Millions in Revenue

marsbit1h ago

Fidelity Q3 Report: BTC, ETH, and SOL Continue to Build Bottoms; How Much Further Will This Crypto Bear Market Go?

Fidelity's Q3 Crypto Signal Report analyzes the current bear market, noting Bitcoin (BTC), Ethereum (ETH), and Solana (SOL) are in a prolonged bottoming phase. Key indicators like the weighted Net Unrealized Profit/Loss (NUPL) have turned negative (-0.01), signaling the market is slightly below its aggregate cost basis, with BTC acting as the primary stabilizing asset. BTC's dominance has risen to 68%, indicating a lack of capital rotation to other digital assets. Performance has been weak across the board, with BTC, ETH, and SOL down significantly year-to-date. Market sentiment is depressed, exacerbated by substantial outflows from spot ETPs and a challenging macro environment. The report compares the current ~203-day downtrend to historical ~300-day bottoming cycles, suggesting the process may be two-thirds complete, with late 2026 as a potential timeframe to monitor. For Bitcoin, NUPL at 0.09 indicates cautious sentiment, while momentum signals remain negative. The Yardstick metric points to potential undervaluation relative to network security (hashrate). Ethereum's NUPL is deep in the "capitulation" zone at -0.43, a historically positive signal for future returns, though its momentum and network fee revenue are negative. Solana shows the deepest NUPL at -0.72 but demonstrates relative resilience in on-chain activity and stablecoin transfer volume. The report concludes that while several metrics are near historical capitulation levels, a definitive market bottom has not yet been established. The path forward likely involves continued consolidation, with BTC's relative strength and fundamental on-chain usage for ETH and SOL providing key areas for investor observation.

marsbit1h ago

Fidelity Q3 Report: BTC, ETH, and SOL Continue to Build Bottoms; How Much Further Will This Crypto Bear Market Go?

marsbit1h ago

Trading

Spot

Hot Articles

How to Buy BCH

Welcome to HTX.com! We've made purchasing Bitcoin Cash (BCH) simple and convenient. Follow our step-by-step guide to embark on your crypto journey.Step 1: Create Your HTX AccountUse your email or phone number to sign up for a free account on HTX. Experience a hassle-free registration journey and unlock all features.Get My AccountStep 2: Go to Buy Crypto and Choose Your Payment MethodCredit/Debit Card: Use your Visa or Mastercard to buy Bitcoin Cash (BCH) instantly.Balance: Use funds from your HTX account balance to trade seamlessly.Third Parties: We've added popular payment methods such as Google Pay and Apple Pay to enhance convenience.P2P: Trade directly with other users on HTX.Over-the-Counter (OTC): We offer tailor-made services and competitive exchange rates for traders.Step 3: Store Your Bitcoin Cash (BCH)After purchasing your Bitcoin Cash (BCH), store it in your HTX account. Alternatively, you can send it elsewhere via blockchain transfer or use it to trade other cryptocurrencies.Step 4: Trade Bitcoin Cash (BCH)Easily trade Bitcoin Cash (BCH) on HTX's spot market. Simply access your account, select your trading pair, execute your trades, and monitor in real-time. We offer a user-friendly experience for both beginners and seasoned traders.

6.2k Total ViewsPublished 2024.03.29Updated 2026.06.02

How to Buy BCH

Discussions

Welcome to the HTX Community. Here, you can stay informed about the latest platform developments and gain access to professional market insights. Users' opinions on the price of BCH (BCH) are presented below.

活动图片