Dogwifhat Jumpstarting The Solana Meme Coin Season: Analyst Predicts 750% Rally For WIF

bitcoinistPublished on 2026-03-18Last updated on 2026-03-18

Abstract

The Solana meme coin season is potentially being jumpstarted by Dogwifhat (WIF), with analyst John Carter predicting a massive 750% price rally. Carter's technical analysis points to a descending channel pattern on WIF's chart, with the coin currently testing a critical support zone between $0.170 and $0.185. He suggests this indicates potential accumulation and a staged recovery, targeting key resistance levels at $0.27, $0.36, $0.48, $0.70, $0.85, and $1.03, with the upper channel boundary near $1.35 representing the final profit-taking zone. This outlook comes as WIF experiences a 15% weekly surge, rebounding from a prolonged bearish trend and leading a recovery in meme coins alongside Dogecoin and Shiba Inu.

The Solana meme coin season could be getting an early push from Dogwifhat (WIF) as an analyst outlines a potential recovery from prolonged downside pressure. Market technician John Carter has thrown his full weight behind WIF, laying out a technical case for a massive 750% price rally that could surpass what most traders are expecting from the dog-themed meme coin. The analyst’s forecast arrives as meme coins begin to climb again, signaling a return of momentum and renewed speculative interest in the cryptocurrency.

Analyst Maps Key Levels For A 750% WIF Rally

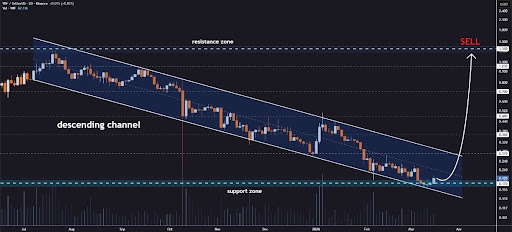
In an X post published on Monday, Carter points to a developing structure on Dogwifhat’s two-day chart that could position the WIF price for a potential 750% upside move from current levels. The chart reveals a clearly defined descending channel that stretches back to mid-2024, steering price action lower over the past several months.

Within this channel pattern, WIF has repeatedly formed lower highs and lower lows, underscoring former bearish trends and relentless selling pressure. However, recent price movement shows the meme coin testing the lower boundary of this channel, which currently sits at a critical support zone between $0.170 and $0.185.

Carter has stated that WIF’s behavior around this key support band hints at potential accumulation, which could be seen as strategic positioning by larger market players ahead of a perceived opportunity. Supporting this view, volume trends at the bottom of the chart indicate steady activity throughout WIF’s recent consolidation phase.
Source: Chart from John Carter on X

If the support zone between $0.170 and $0.185 holds, Carter forecasts a staged recovery for Dogwifhat through key levels within the descending channel. He marked the first upside target at $0.27, followed by $0.36 and $0.48. Should momentum continue, the analyst projects that WIF could push toward higher resistance zones at $0.70, $0.85, and $1.03.

The upper boundary of the channel near $1.35 also represents a major long-term resistance level. Based on the trajectory of his outlook, a full move from WIF’s current price levels around $0.188 to this final resistance could deliver a potential rally of roughly 750%. Carter has marked this top resistance level as a potential sell zone where holders can take profit.

Dogwifhat Sees Major Recovery With 15% Upside

The latest report from CoinMarketCap shows that the WIF price is rebounding from lower levels and now seems to be in a major recovery mode. Over the past seven days, Dogwifhat has surged by more than 15%, modestly outperforming the broader bear market.

This price increase has been largely attributed to improved sentiment toward higher-risk altcoins. The price rally also comes after months of downside pressure, with WIF recording a year-to-date decline of roughly 60%, according to CMC. Alongside Dogwifhat, other popular meme coins such as Shiba Inu and Dogecoin appear to be in a similar recovery phase, with DOGE and SHIB prices up by over 7%.

WIF trading at $0.18 on the 1D chart | Source: WIFUSDT on Tradingview.com

Trending Cryptos

Related Questions

QWhat is the main prediction made by analyst John Carter regarding Dogwifhat (WIF)?

AJohn Carter predicts a potential 750% price rally for WIF from its current levels, targeting a move to around $1.35.

QWhat key support zone does Carter identify as critical for WIF's potential rally?

ACarter identifies the support zone between $0.170 and $0.185 as critical for WIF's potential rally.

QWhat pattern on WIF's chart does Carter use to support his analysis?

ACarter points to a clearly defined descending channel on WIF's two-day chart that has been steering price action lower since mid-2024.

QHow has WIF performed over the past seven days according to CoinMarketCap?

AOver the past seven days, WIF has surged by more than 15%, indicating a major recovery.

QBesides WIF, which other meme coins are mentioned to be in a recovery phase?

AOther popular meme coins such as Shiba Inu (SHIB) and Dogecoin (DOGE) are also mentioned to be in a similar recovery phase, with their prices up by over 7%.

Related Reads

Interview with Robinhood Executive: Meme + Tokenized US Stocks as "Barbell" Customer Acquisition Strategy, All Business Lines Achieve Hundreds of Millions in Revenue

Interview with Robinhood executive Johann Kerbrat reveals the company's "barbell" customer acquisition strategy for its new Robinhood Chain, combining meme tokens with tokenized stocks. Three weeks after mainnet launch, the chain has seen over $3B in weekly DEX volume and 105M transactions. Kerbrat explains the logic behind the permissionless chain: meme tokens attract DeFi users, while tokenized real-world assets (RWA), currently over 90 US stocks and ETFs accessible in 120+ countries, serve global users. The goal is to bring Robinhood's 27 million funded accounts on-chain by simplifying DeFi with a user-friendly interface, exemplified by features like Robinhood Earn which offers yield without requiring wallet management. Built on Arbitrum's technology stack for its speed, low cost, and Ethereum's security, the chain focuses on financial products like Earn, spot trading, and perpetuals. Kerbrat downplays direct competition with platforms like Base, emphasizing the goal of expanding the overall market for on-chain assets. He details selective partnerships (e.g., Morpho, Lighter) based on compliance, unique UX, and differentiation. While regulatory clarity is pending for US perpetuals, the expansion continues via Bitstamp in Europe. Finally, Kerbrat positions Robinhood as a "super app" integrating stocks, options, crypto, banking, and AI trading, with all major business lines generating hundreds of millions in revenue. For the chain, current priority is driving adoption over maximizing gas fee revenue.

marsbit59m ago

Interview with Robinhood Executive: Meme + Tokenized US Stocks as "Barbell" Customer Acquisition Strategy, All Business Lines Achieve Hundreds of Millions in Revenue

marsbit59m ago

Fidelity Q3 Report: BTC, ETH, and SOL Continue to Build Bottoms; How Much Further Will This Crypto Bear Market Go?

Fidelity's Q3 Crypto Signal Report analyzes the current bear market, noting Bitcoin (BTC), Ethereum (ETH), and Solana (SOL) are in a prolonged bottoming phase. Key indicators like the weighted Net Unrealized Profit/Loss (NUPL) have turned negative (-0.01), signaling the market is slightly below its aggregate cost basis, with BTC acting as the primary stabilizing asset. BTC's dominance has risen to 68%, indicating a lack of capital rotation to other digital assets. Performance has been weak across the board, with BTC, ETH, and SOL down significantly year-to-date. Market sentiment is depressed, exacerbated by substantial outflows from spot ETPs and a challenging macro environment. The report compares the current ~203-day downtrend to historical ~300-day bottoming cycles, suggesting the process may be two-thirds complete, with late 2026 as a potential timeframe to monitor. For Bitcoin, NUPL at 0.09 indicates cautious sentiment, while momentum signals remain negative. The Yardstick metric points to potential undervaluation relative to network security (hashrate). Ethereum's NUPL is deep in the "capitulation" zone at -0.43, a historically positive signal for future returns, though its momentum and network fee revenue are negative. Solana shows the deepest NUPL at -0.72 but demonstrates relative resilience in on-chain activity and stablecoin transfer volume. The report concludes that while several metrics are near historical capitulation levels, a definitive market bottom has not yet been established. The path forward likely involves continued consolidation, with BTC's relative strength and fundamental on-chain usage for ETH and SOL providing key areas for investor observation.

marsbit1h ago

Fidelity Q3 Report: BTC, ETH, and SOL Continue to Build Bottoms; How Much Further Will This Crypto Bear Market Go?

marsbit1h ago

Trading

Spot

Hot Articles

Discussions

Welcome to the HTX Community. Here, you can stay informed about the latest platform developments and gain access to professional market insights. Users' opinions on the price of MEME (MEME) are presented below.

活动图片