Bitcoin Vs. Altcoins: You Should See This Chart That Shows Another Alt Season Is About To Begin

bitcoinistPublished on 2026-02-27Last updated on 2026-02-27

Abstract

Based on a long-term chart analysis by crypto expert @CyrilXBT, the total altcoin market cap relative to Bitcoin has returned to a critical historical level of approximately 0.129, which has previously signaled the start of major altcoin seasons. This ratio, representing the total crypto market excluding the top 10 assets compared to Bitcoin, is now in what the analyst describes as the "base" or "accumulation zone." Historically, this level has preceded significant altcoin rallies, such as those in 2017-2018 and the largest recorded alt season in 2021 when the ratio surged above 0.55. Despite recent Bitcoin dominance and price declines, the current market reset suggests that conditions may be forming for a new alt season. The analyst notes that if historical patterns repeat, the ratio could potentially reach between 0.80 and 0.90 in the current cycle. This indicates that altcoins are not "dead" but may be poised for a significant upward movement as market dynamics align with past bullish trends.

Talks of a potential altcoin season this cycle have since subsided compared to previous years, despite the recent decline in the Bitcoin (BTC) price and dominance. Notably, a crypto analyst has shared a new long-term chart showing the total altcoin market capitalization relative to Bitcoin at a level that has historically preceded major alt seasons. Based on his analysis, the alt market has fully reset and could be gearing up for a fresh altcoin season if historical trends play out as expected.

Historic Alt Season Setup Forms As Bitcoin Ratio Hits Base Zone

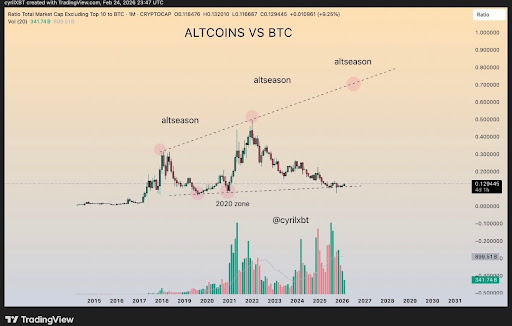
In a recent analysis on X, market expert @CyrilXBT shared a monthly chart tracking the ratio of the total crypto market, excluding the top 10 assets, to Bitcoin. According to the analysis, the chart currently sits at approximately 0.129, a level the analyst describes as the same base or accumulation zone that has launched every major altcoin season in crypto history.

@CyrilXBT noted that this zone is where all alt seasons are born, with each past altcoin rally beginning when the ratio stopped falling and stabilized around the $0.12 to $0.13 range. Looking at the chart, the analyst noted that during the 2015-2016 cycle, the ratio starts near zero and remains flat, with minimal volatility. Following this, a dramatic spike occurred during the 2017-2018 bull run, pushing the altcoin vs Bitcoin ratio above 0.3, marking one of the first major alt seasons.
Source: X

By 2020, the ratio crashed back below the 0.129 level, erasing most of its previous gains as it consolidated near the low-ranged accumulation/base zone. Notably, 2021 marked the largest altcoin season spike in history, with the ratio exploding upward to over 0.55 amid the bull market frenzy. During this time, volume hit new highs, with bars towering above those of previous years.

New Alt Season Conditions Take Shape

Similar to the 2020 crash, the 2022-2024 cycle saw a post-peak correction, with the ratio trending downward as Bitcoin regained dominance. In the current 2025-2026 cycle, the altcoin vs Bitcoin ratio has finally returned to the historically significant 0.129 accumulation zone, with BTC.D falling to a yearly low of 57.9%.

@CyrilXBT has suggested that the current positioning mirrors the pre-altseason setup that led to a major altcoin explosion in previous years. He noted that the rising trendline connecting successive altcoin season peaks on the chart points to a ratio of roughly 0.80 to 0.90 as the next potential target for this cycle.

As the ratio stabilizes and historical trends repeat, @CyrilXBT argues that recent market performance does not indicate that altcoins are dead. Rather, it shows that the market has fully reset and could be quietly creating the conditions for its next alt season.

Total altcoin market cap remains below $1 trillion | Source: Crypto Total Market Cap Excluding BTC from Tradingview.com

Trending Cryptos

Related Questions

QAccording to the analyst @CyrilXBT, what is the significance of the total altcoin market cap to Bitcoin ratio reaching the 0.129 level?

AThe analyst states that the 0.129 level is the historic accumulation or base zone where every major altcoin season in crypto history has been launched from. It is the level where the ratio stops falling and stabilizes, signaling the potential start of a new alt season.

QWhat was the peak value of the altcoin vs. Bitcoin ratio during the 2021 bull market, as mentioned in the article?

ADuring the 2021 bull market, the altcoin vs. Bitcoin ratio exploded upward to over 0.55, marking the largest altcoin season spike in history.

QWhat recent market development, besides the ratio, supports the potential for a new alt season as described in the analysis?

ABitcoin's dominance (BTC.D) has fallen to a yearly low of 57.9%, which, combined with the ratio returning to the 0.129 base zone, helps create the conditions for a potential alt season.

QBased on the historical trendline of alt season peaks, what is the next potential target for the altcoin vs. Bitcoin ratio in the current cycle?

AThe rising trendline connecting successive altcoin season peaks points to a ratio of roughly 0.80 to 0.90 as the next potential target for this cycle.

QHow does the analyst, @CyrilXBT, interpret the recent market performance and the decline in the altcoin ratio?

AHe argues that it does not indicate that altcoins are dead. Instead, it shows that the market has fully reset and could be quietly creating the conditions for its next alt season, mirroring pre-altseason setups from previous years.

Related Reads

Why Has the Bitcoin Market Stalled Amid Positive Macroeconomic Data?

Bitcoin's price remains stagnant despite positive macroeconomic data, such as stabilized U.S. core inflation at 2.5%, which pushed traditional stock markets to new highs. This indifference signals underlying structural issues in the current market cycle, according to analysts. Bitcoin is trapped in a narrow range between the realized price support at $63,000 and the short-term holder cost basis resistance at $68,700. Short-term holders are sitting on unrealized losses and tend to sell as prices approach their break-even point, creating significant selling pressure. This price compression occurs alongside spot trading volumes at their lowest since 2019, indicating a severe lack of retail interest. While selling pressure has shown signs of exhaustion, buyers have not returned. Capital is flowing into the surging stock market, particularly AI-related sectors, instead of Bitcoin. This is evidenced by minimal inflows into spot Bitcoin ETFs and a continued transfer of coins to exchanges, often a precursor to selling. A major concern is the derivatives market, where leveraged long positions are being aggressively accumulated despite the lack of underlying spot demand. This creates a dangerous liquidity imbalance. A negative macro event or sharp price drop could trigger a cascade of long liquidations, potentially crashing the price to the next key support level around $58,500. For a sustained recovery, Bitcoin needs to firmly break above $68,700, accompanied by a significant rise in spot volumes and renewed ETF inflows. Until then, the risk of a sharp decline remains high.

cryptonews.ru1m ago

Why Has the Bitcoin Market Stalled Amid Positive Macroeconomic Data?

cryptonews.ru1m ago

Asia is Becoming a Testing Ground for Stablecoin-Based Payment Systems

Asia is emerging as the primary testing ground for stablecoin-based payment systems, with Singapore, Hong Kong, and Japan leading the regulatory charge. These jurisdictions are moving from policy consultation to practical implementation, establishing legal frameworks that permit licensed stablecoins for payments and settlements. In 2026, Singapore has authorized major firms like Circle and Coinbase under its digital payment token regime. Hong Kong enacted its Stablecoin Law in 2025, issuing its first two licenses in April 2026. Japan has amended its rules to enhance transaction transparency for crypto exchanges. This regulatory push follows significant existing activity. Hong Kong-based Reap processes about $6 billion annually, with Asia's inter-enterprise stablecoin flows surging from under $100 million monthly in early 2023 to over $3 billion by 2025. The region accounted for $12.5 trillion in stablecoin volume in 2025, with the Singapore-China corridor being the most active. A key insight from a BIS study is that stablecoin transactions are complex; about 60% involve multi-step operations like trading and borrowing, not simple peer-to-peer transfers. This challenges regulators to view stablecoins as programmable settlement tools rather than just digital cash. While progress is uneven—South Korea's legislation is delayed due to debates over issuer eligibility—Asia's advanced banking infrastructure and experience with cross-border finance position it as the natural leader in building the global infrastructure for dollar-denominated stablecoins.

cryptonews.ru3m ago

Asia is Becoming a Testing Ground for Stablecoin-Based Payment Systems

cryptonews.ru3m ago

Former ASML Employee at the Helm, China's AMEC's Peer Files for IPO, Focusing on Integrated Circuit Metrology and Inspection Equipment

Eastern Jingyuan Microelectronics Technology (Beijing) Co., Ltd. ("Eastern Jingyuan"), led by a former ASML employee, has filed for a Shanghai STAR Market IPO. The company specializes in integrated circuit (IC) metrology/inspection equipment and manufacturing EDA software, key upstream segments in the semiconductor supply chain. Driven by demand from automotive electronics and AI, China's semiconductor equipment market is expanding rapidly. Eastern Jingyuan's products, including CD-SEM and EBI equipment, as well as computational lithography software (PanGen), aim to break the dominance of international giants like Applied Materials, ASML-HMI, and Siemens EDA in these high-tech, low-domestication-rate fields. Financially, the company's performance is mixed. While revenue grew from 191 million yuan in 2023 to 375 million yuan in 2024, it dipped to 317 million yuan in 2025. The firm has been consistently unprofitable, with net losses totaling approximately 860 million yuan over the past three years. Its gross margin has declined steadily from 67.5% to 39.7%, and both equipment and software毛利率 lag behind industry peers. High R&D expenses (exceeding 90% of revenue) and rising debt levels further pressure profitability. The IPO aims to raise 2.5 billion yuan to fund R&D upgrades for metrology/inspection equipment and EDA tools, alongside working capital. Despite being a domestic pioneer, the company acknowledges gaps versus international leaders in technology, product breadth, and scale, while also facing growing competition from local rivals.

marsbit6m ago

Former ASML Employee at the Helm, China's AMEC's Peer Files for IPO, Focusing on Integrated Circuit Metrology and Inspection Equipment

marsbit6m ago

The Era of Easy Gains in AI Ends: 13F Rebalancing Map Points the Way – The Latest 13F Reveals Where Top Institutions' Money is Flowing

The era of easy AI profits is ending, as evidenced by the latest 13F filings from major institutions for Q2 2026. These reports, which are delayed by over 45 days, reveal a significant shift in strategy: capital is moving from a broad "AI frenzy" towards assets with strong cash flows, tangible technology, and durable competitive advantages. Key institutional moves highlight this trend. Temasek increased stakes in SpaceX (representing next-gen infrastructure), Alphabet (for its AI infrastructure and cash flow), and semiconductor equipment giant ASML. Baillie Gifford made SpaceX its top holding. Berkshire Hathaway ended its passive stance with a major $10 billion purchase of Alphabet, while Bridgewater maintains significant positions in tech giants but with a balanced, macro-aware approach. Notably, asset manager JingLin dramatically reduced overall exposure by 43%, completely exiting Nvidia and Meta, and pivoting towards semiconductor equipment and optical communication stocks like ASML and Applied Materials. The analysis reveals several key conclusions: 1. **Alphabet is becoming a consensus holding**, valued for its blend of AI infrastructure, stable cash flows, and reasonable valuation. 2. **Nvidia remains core but faces scrutiny**; its future depends on sustaining growth and justifying its valuation. 3. **Capital is flowing upstream** into semiconductor equipment and hardware (e.g., ASML, AMAT), focusing on the "bottlenecks" of AI compute. 4. **SpaceX represents a new theme** in next-generation infrastructure, attracting long-term capital. The article warns against common mistakes when interpreting 13Fs: treating them as real-time trading signals, focusing only on *what* was bought and not *how much*, and ignoring the different investment styles of the reporting funds. Instead, investors should use a disciplined five-step framework: analyze the overall portfolio structure, focus on marginal changes (new adds/sells), identify sector/theme migrations, look for consensus or divergence among multiple funds, and finally, independently verify the current price, valuation, and fundamentals. In essence, 13Fs provide valuable footprints and research clues left by sophisticated investors, but they are not a substitute for one's own analysis and investment thesis.

marsbit8m ago

The Era of Easy Gains in AI Ends: 13F Rebalancing Map Points the Way – The Latest 13F Reveals Where Top Institutions' Money is Flowing

marsbit8m ago

Trading

Spot

Hot Articles

How to Buy ALT

Welcome to HTX.com! We've made purchasing AltLayer (ALT) simple and convenient. Follow our step-by-step guide to embark on your crypto journey.Step 1: Create Your HTX AccountUse your email or phone number to sign up for a free account on HTX. Experience a hassle-free registration journey and unlock all features.Get My AccountStep 2: Go to Buy Crypto and Choose Your Payment MethodCredit/Debit Card: Use your Visa or Mastercard to buy AltLayer (ALT) instantly.Balance: Use funds from your HTX account balance to trade seamlessly.Third Parties: We've added popular payment methods such as Google Pay and Apple Pay to enhance convenience.P2P: Trade directly with other users on HTX.Over-the-Counter (OTC): We offer tailor-made services and competitive exchange rates for traders.Step 3: Store Your AltLayer (ALT)After purchasing your AltLayer (ALT), store it in your HTX account. Alternatively, you can send it elsewhere via blockchain transfer or use it to trade other cryptocurrencies.Step 4: Trade AltLayer (ALT)Easily trade AltLayer (ALT) on HTX's spot market. Simply access your account, select your trading pair, execute your trades, and monitor in real-time. We offer a user-friendly experience for both beginners and seasoned traders.

5.3k Total ViewsPublished 2024.03.29Updated 2026.06.02

How to Buy ALT

Discussions

Welcome to the HTX Community. Here, you can stay informed about the latest platform developments and gain access to professional market insights. Users' opinions on the price of ALT (ALT) are presented below.

活动图片