Vendredi dans le monde crypto : BCH, le dark horse qui grimpe de 7% avec un potentiel de hausse de 65% ? SUI et LTC affichent des tendances divergentes, analyse ici

金色财经Published on 2025-12-19Last updated on 2025-12-19

Abstract

Résumé : Le marché des cryptomonnaies a connu une journée mouvementée ce vendredi, marquée par des performances divergentes. Le Bitcoin Cash (BCH) s'est distingué avec une hausse de plus de 7%, porté par une reprise des achats des baleines et la formation d'un double creux à long terme. Les analystes estiment qu'une rupture au-dessus du niveau de 622,4 dollars pourrait ouvrir la voie à une progression supplémentaire de 65%. Le SUI a rebondi de 4,5% après que Bitwise ait déposé une demande pour un ETF spot, accélérant potentiellement le processus d'approbation réglementaire. À l'inverse, le Litecoin (LTC) a poursuivi sa tendance baissière, chutant sous un support clé à 80 dollars. Bien qu'un rebond technique vers 82-83 dollars soit possible, la faiblesse générale des acheteurs suggère que toute hausse pourrait être éphémère et constituer une opportunité de vente. Les investisseurs sont invités de surveiller les niveaux techniques clés pour BCH (622,4 $ et 541 $) et les décisions d'ETF pour SUI, tout en restant prudents face aux faux rebonds sur LTC.

Enfin un vendredi un peu moins morne dans le monde crypto ! Certains ont connu une hausse fulgurante contre la tendance, d'autres ont rebondi grâce à des bonnes nouvelles, et d'autres encore chutent sans fin en attendant un rebond. Rejoignez le groupe +Q:3260353596

BCH, le dark horse ! Une hausse de 7% et un double creux sur plusieurs années, vraiment 65% de potentiel ?

La star de ce vendredi est sans conteste Bitcoin Cash (BCH), qui a grimpé de plus de 7%, menant la danse parmi les 100 principales cryptomonnaies par market cap ! Cette hausse n'est pas un hasard, la raison étant que les baleines ont recommencé à accumuler, la pression acheteuse reprenant de la vigueur.
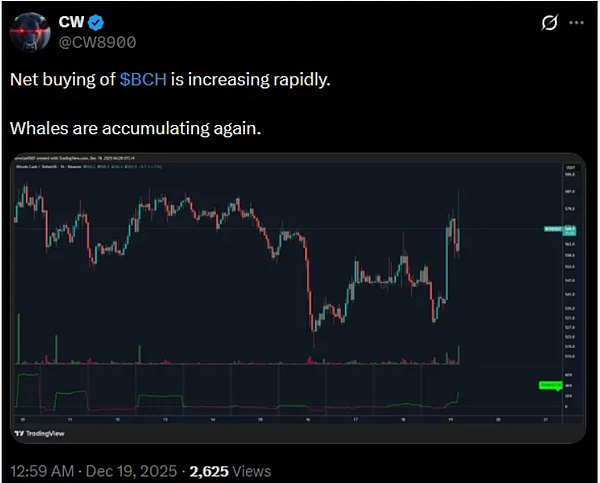
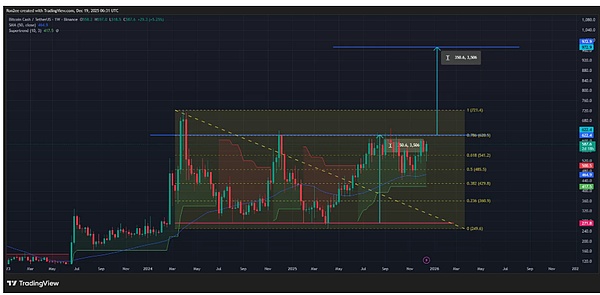
Plus important encore, BCH a formé une figure technique de double creux (double bottom) sur une échelle de plusieurs années – un signal haussier très fort ! Selon les données de crypto.news, BCH a augmenté de 7,1% sur les 24 dernières heures, atteignant un plus haut intraday à 585 dollars, soit une hausse de 28% par rapport au plus bas de novembre et une explosion de 118% depuis le plus bas de l'année.

Les analystes surveillent un niveau clé : la ligne de cou (neckline) à 622,4 dollars. Le prix de BCH n'est plus qu'à 6% de la franchir. Si une cassure confirmant le double bottom a lieu, la prochaine cible pourrait être autour de 972 dollars, représentant une hausse supplémentaire d'environ 65% depuis le prix actuel !
Outre les baleines, les traders de produits dérivés ont aussi contribué. Les données de CoinGlass montrent que l'open interest des futures BCH a augmenté de 20% en 24h, atteignant 766,6 millions de dollars, et le financement pondéré est tombé en territoire négatif. Si la hausse se poursuit, cela pourrait déclencher un short squeeze (compression des vendeurs à découvert), forçant les liquidations et propulsant BCH encore plus haut.
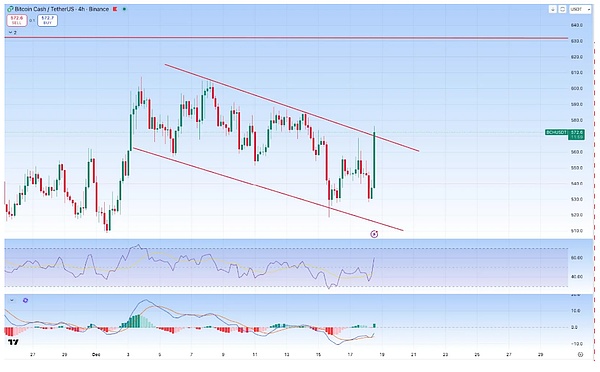
De plus, BCH a franchi un canal de tendance baissière de plusieurs semaines, est remonté au-dessus de sa moyenne mobile 50 jours, et son SuperTrend est repassé au vert, autant de signaux clairs que la pression acheteuse domine. Attention cependant, le support clé à 541 dollars doit être maintenu, sans quoi la tendance pourrait s'inverser à nouveau, ne soyez pas négligents~

SUI rebondit et se refait une santé ! Bitwise dépose une demande d'ETF, le processus d'approbation s'accélère

SUI, qui ne cessait de chuter, a finalement reçu une bonne nouvelle et a rebondi ! La raison : la société de gestion d'actifs cryptos Bitwise a déposé une demande pour lancer un ETF spot sur le jeton SUI, ayant soumis le formulaire S-1 à la SEC jeudi. Rejoignez le groupe +Q:3260353596

C'est la première étape du processus d'approbation d'un ETF. Selon les nouvelles règles, le processus d'examen complet ne devrait prendre que 75 jours, bien plus rapide que l'ancien processus pouvant durer jusqu'à 240 jours. Et maintenant, ce n'est pas seulement Bitwise ; Canary Capital, 21Shares et Grayscale ont également déposé des demandes pour un ETF spot SUI. La décision concernant la demande de 21Shares sera annoncée avant le 21 décembre. Si elle est approuvée, ce serait le premier ETF spot SUI aux États-Unis.

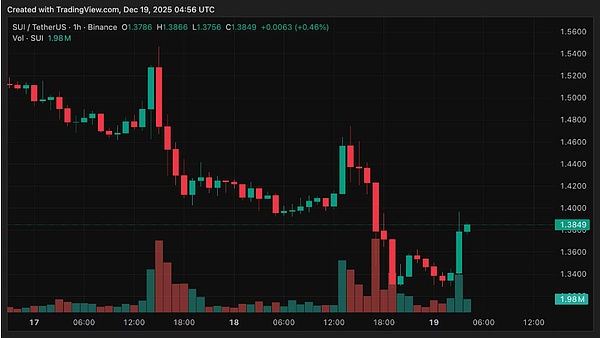
Sous l'effet de cette nouvelle positive, SUI, qui avait chuté pendant deux semaines consécutives, a rebondi depuis son plus bas mensuel à 1,33 dollar, affichant une hausse de 4,5% au moment de la rédaction. De plus, Bitwise a récemment ajouté SUI à son indice ETF de 10 cryptomonnaies. La poursuite de la hausse dépendra désormais de l'avancement des approbations des ETF~
LTC s'effondre ! Perte du support à 80$, un rebond vers 82$ ? Opinion baissière

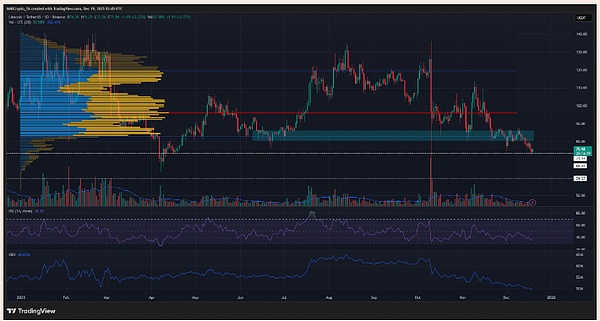
Comparé à BCH et SUI, Litecoin (LTC) est un peu dans une mauvaise passe. Suivant la volatilité du Bitcoin, il a chuté de 7,5% en seulement 5 heures, touchant un nouveau plus bas à 72,64 dollars, et se négocie actuellement autour de 75,89 dollars.

Le point le plus crucial est que le zone de support à long terme de 80-84 dollars, que les acheteurs défendaient depuis deux semaines, a finalement cédé. De plus, la force des acheteurs est particulièrement faible ; même son inclusion dans l'indice ETF de 10 cryptomonnaies de Bitwise n'a guère fait réagir le prix. D'un point de vue technique, la pression vendeuse n'a pas cessé depuis la deuxième semaine d'octobre, et l'indicateur OBV (On-Balance Volume) montre que si acheteurs et vendeurs étaient au coude-à-coude, les vendeurs ont finalement pris le dessus.
Mais une petite opportunité existe : la carte de chaleur des liquidations (Liquidation Heatmap) montre que la liquidité autour de 73 dollars a été épuisée, ce qui pourrait déclencher un rebond temporaire, avec un objectif autour de 82-83 dollars. Mais attention, il s'agira très probablement juste d'un rebond technique, et non d'un renversement de tendance.
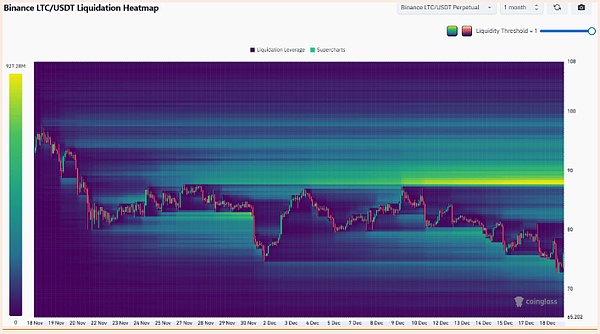
Si un rebond teste ensuite la zone de 80-84 dollars, cette zone deviendra très probablement une forte résistance, difficile à franchir. Il est donc recommandé de maintenir une opinion baissière. Si le rebond atteint ces niveaux, envisagez des positions short (vendeuses), avec un premier objectif à 66 dollars, puis le niveau de support suivant à 59 dollars. Rejoignez le groupe +Q:3260353596

Conclusion : Dans un marché divergent, surveillez ces deux signaux

1. BCH : Surveillez attentivement la ligne de cou à 622,4 dollars. Une cassure ouvre un grand potentiel haussier. Envisagez des positions longues seulement si le support à 541 dollars tient.

2. SUI : Suivez le rythme des approbations d'ETF. La décision concernant la demande de 21Shares avant le 21 décembre est cruciale.

3. LTC : Un rebond est très probablement une opportunité de vendre à découvert. Ne vous laissez pas berner par un rebond technique à court terme. Surveillez attentivement la zone de résistance 80-84 dollars.

Le marché est clairement divergent : certaines opportunités se cachent, d'autres sont des pièges. Il est conseillé de ne pas suivre aveuglément la tendance et d'attendre les niveaux clés avant d'agir.


Trending Cryptos

Related Questions

QQuel a été le principal facteur derrière la hausse de 7% du Bitcoin Cash (BCH) vendredi ?

ALa principale raison de la hausse du Bitcoin Cash (BCH) est la reprise des achats par les baleines, ce qui a augmenté la pression acheteuse.

QQuel est le signal technique majeur qui indique un potentiel haussier pour le BCH selon l'article ?

ALe signal technique majeur est la formation d'un double creux (double bottom) sur plusieurs années, qui est un fort signal haussier. Une rupture au-dessus de la ligne de cou à 622,4 dollars pourrait ouvrir la voie vers une cible de 972 dollars.

QQuelle raison le prix de SUI a-t-il augmenté ?

ALe prix de SUI a augmenté en raison de la nouvelle que l'entreprise de gestion de crypto-actifs Bitwise a déposé une demande auprès de la SEC pour un ETF spot sur le jeton SUI, accélérant le processus d'approbation réglementaire.

QQuel est la perspective pour le Litecoin (LTC) selon l'analyse technique présentée ?

ALa perspective pour le Litecoin (LTC) est baissière. Bien qu'un rebond technique vers 82-83 dollars soit possible après l'épuisement des liquidités autour de 73 dollars, la zone de résistance de 80-84 dollars devrait contenir toute hausse, et il est recommandé de considérer les rebonds comme des opportunités de vente.

QQuel est le niveau de support clé à surveiller pour le BCH afin de maintenir sa tendance haussière ?

ALe niveau de support clé à surveiller pour le BCH est de 541 dollars. Si ce niveau est perdu, la tendance pourrait s'inverser.

Related Reads

Bitcoin’s path to $80K may hinge on THIS hidden trend

Bitcoin's potential path toward $80,000 is influenced by conflicting market signals. Data shows the Coinbase Bitcoin Premium Index has recorded its longest-ever streak of consecutive negative premiums, indicating muted institutional demand or net selling from U.S. institutions. While such a trend often signals short-term weakness, it doesn't necessarily forecast a long-term bear market. Additionally, a bearish crossover occurred in Bitcoin's Net Unrealized Profit/Loss (NUPL), with its short-term average falling below the longer-term average, suggesting declining investor profitability and waning market momentum. Historically, major bear market bottoms saw the 100-day NUPL drop below zero, but this cycle it remains positive, implying either an unprecedented bottom or a further decline is needed. Currently trading around $63,148, Bitcoin has seen weekly gains but remains below its May peak. Technical indicators present a mixed picture: the MACD shows bullish momentum, while the RSI signals bearish pressure. A positive development is the return of inflows to Bitcoin ETFs after eight weeks of outflows. Analysts hold divergent views; some highlight a key liquidity zone between $48,000-$50,000 where a market bottom could form, while others maintain a more optimistic long-term outlook. Ultimately, while some bullish signs exist, a strong push from institutional investors appears crucial for Bitcoin to challenge the $80,000 level.

ambcrypto13m ago

Bitcoin’s path to $80K may hinge on THIS hidden trend

ambcrypto13m ago

Unexpected Weak Non-Farm Payrolls Data Pushes BTC to Rebound 11%, FOMC Minutes to Test the Narrative of This Rally

Bitcoin has rebounded 11% from its 21-month low, but the sustainability of this rally hinges entirely on the Federal Reserve's release of the June FOMC meeting minutes. The bounce was triggered by a weaker-than-expected US jobs report, which showed only 57,000 jobs added in June—about half of economists' forecasts. This data prompted traders to scale back bets on further Fed rate hikes, fueling a rally in Bitcoin alongside gold and stocks. The upcoming minutes are critical. They will reveal whether Fed officials, in their mid-June meeting, were already expressing concerns about a weakening labor market, tight credit conditions, or the risks of overtightening—factors that would support the market's recent dovish shift. Conversely, if the discussion focused on persistent inflation and the conditions for more rate hikes, the rally's foundational narrative would crumble. Market indicators show the rebound's fragility. While US spot Bitcoin ETFs saw a significant single-day inflow, it followed a prolonged period of outflows. On-chain data indicates a substantial increase in Bitcoin being moved to exchanges, creating potential sell pressure. Options market positioning suggests key price levels around $60,000 and $62,000 that could either stabilize or accelerate price movement. In essence, Bitcoin's 11% gain is built on speculation about the Fed's private deliberations three weeks ago. The FOMC minutes will replace that speculation with concrete details, and the discrepancy between market expectations and the actual record will determine whether Bitcoin holds above $64,000 or falls back toward $58,000.

marsbit23m ago

Unexpected Weak Non-Farm Payrolls Data Pushes BTC to Rebound 11%, FOMC Minutes to Test the Narrative of This Rally

marsbit23m ago

Just Now, The World's First Ultra-High-Frame World Model Was Born, Nvidia Content 0, Racing to 50 FPS

Just Now, Global First Ultra-High-Frame World Model Born, 0% NVIDIA, Speeds to 50 FPS A Chinese team has developed MoWorld, the world's first Flash World Model, achieving real-time interactive inference exceeding 50 FPS. Crucially, it is entirely built on domestic NPUs (National Processing Units), bypassing NVIDIA GPUs. Developed by Moxin Technology in collaboration with Zhejiang University's Pan Yunhe academician team, MoWorld represents a complete, closed-loop system from training and distillation to deployment on domestic computing power. The model tackles the critical industry bottleneck of real-time performance, essential for applications like robotics, gaming, and digital worlds. MoWorld achieves this through a full-stack redesign for NPUs, including a proprietary 3D-annotated data pipeline, system-level optimizations for long-sequence training (up to 2000 frames), and inference optimizations like dynamic mixed-precision quantization. On a Huawei Ascend 910C platform, a 14B MoE parameter model achieves over 50 FPS, reducing typical inference costs by 70% compared to equivalent GPU solutions. This breakthrough lowers the deployment barrier, potentially accelerating the industrialization of world models. Key application areas include gaming/entertainment (offering 6-DoF camera control for immersive exploration), embodied AI/autonomous driving (providing a high-fidelity digital training ground), film pre-visualization, and 3D reconstruction/digital twins due to its strong geometric consistency. MoWorld demonstrates that a full-stack domestic compute ecosystem can support cutting-edge, real-time world models, positioning China at a competitive starting line in defining next-generation spatial intelligence standards. The project underscores a shift in competition from model scale to real-world usability and cost-effective deployment.

marsbit1h ago

Just Now, The World's First Ultra-High-Frame World Model Was Born, Nvidia Content 0, Racing to 50 FPS

marsbit1h ago

Pacific 'Fever': How Extreme Weather Becomes Wall Street's Cash Machine?

"Pacific Fever": How Extreme Weather Becomes Wall Street's ATM? The summer of 2026 sees unusually fierce weather across China and globally. The common driver behind this global pattern is a powerful El Niño event, potentially the strongest since 1950, as declared by NOAA. This phenomenon, characterized by warming central/eastern Pacific waters, disrupts global atmospheric circulation, raising risks of floods, droughts, and heatwaves, further intensified by climate change. For financial markets, especially commodities, El Niño is not just weather but a major trading theme. History shows its price impact is profound. In the 1970s, El Niño-driven anchovy collapse in Peru fueled a soybean boom, giving Richard Dennis his first million. Anthony Ward's cocoa empire was built on superior weather intelligence. Most recently in 2024, West African droughts caused cocoa prices to soar over 400%, delivering huge gains for trend-following hedge funds. In 2026, markets are again pricing in future El Niño-induced supply shocks. Despite high current inventories, prices for palm oil, rubber, and sugar have rallied on anticipation of upcoming Southeast Asian droughts and weak Indian monsoons. Analysts identify key indicators to watch: the Niño3.4 index, Indian monsoon rainfall, Malaysian palm oil stocks, and the fundraising scale of specialized weather funds like Moreton Capital. Beyond trading opportunities, a concerning narrative is gaining traction online, linking El Niño with fertilizer shortages and energy supply disruptions to warn of potential global food crises within months. While alarmist, it highlights a deeper truth: the cascading effects of climate-driven weather extremes ultimately translate into higher costs of living for everyone, far beyond the trading floor.

marsbit1h ago

Pacific 'Fever': How Extreme Weather Becomes Wall Street's Cash Machine?

marsbit1h ago

Pacific 'Fever': How Extreme Weather Becomes Wall Street's ATM?

"Pacific 'Fever': How Extreme Weather Becomes Wall Street's Piggy Bank" The article examines how the 2026-2027 El Niño, potentially the strongest since 1950, is not only disrupting global weather but also creating major financial opportunities. It links recent extreme events in China and worldwide to this climate phenomenon, which alters atmospheric patterns, increasing risks of floods, droughts, and heatwaves. The core narrative explores how financial markets capitalize on these disruptions. A hedge fund is raising $500 million specifically to bet on El Niño-affected crops like South African corn and Malaysian palm oil. Historically, such strategies have yielded massive profits. Examples include Richard Dennis ("Turtle Trader") making his first fortune in the 1970s soy boom triggered by El Niño's impact on Peruvian anchovies (a key fishmeal source), and Anthony Ward's cocoa empire built on superior weather intelligence. The 2024 cocoa price surge, driven by West African drought, enriched quantitative trend-following funds. Currently, markets are preemptively bidding up palm oil, rubber, and sugar futures based on anticipated future supply shocks, despite high current inventories. The article details El Niño's asymmetric global impacts: causing drought in Southeast Asia (hurting palm oil/rubber) and India (affecting sugar/cotton), but bringing beneficial rains to South American soy and sugarcane. Key metrics to watch include the Niño3.4 index, Indian monsoon data, and Malaysian palm oil stocks. The true price effects often materialize *after* the El Niño peaks, suggesting 2027 may see the real volatility. The conclusion warns that beyond trading gains, the convergence of El Niño, energy shortages, and fertilizer scarcity poses a systemic risk, potentially raising the cost of living for everyone, turning a climate event into a global economic story.

链捕手1h ago

Pacific 'Fever': How Extreme Weather Becomes Wall Street's ATM?

链捕手1h ago

Trading

Spot

Hot Articles

How to Buy BCH

Welcome to HTX.com! We've made purchasing Bitcoin Cash (BCH) simple and convenient. Follow our step-by-step guide to embark on your crypto journey.Step 1: Create Your HTX AccountUse your email or phone number to sign up for a free account on HTX. Experience a hassle-free registration journey and unlock all features.Get My AccountStep 2: Go to Buy Crypto and Choose Your Payment MethodCredit/Debit Card: Use your Visa or Mastercard to buy Bitcoin Cash (BCH) instantly.Balance: Use funds from your HTX account balance to trade seamlessly.Third Parties: We've added popular payment methods such as Google Pay and Apple Pay to enhance convenience.P2P: Trade directly with other users on HTX.Over-the-Counter (OTC): We offer tailor-made services and competitive exchange rates for traders.Step 3: Store Your Bitcoin Cash (BCH)After purchasing your Bitcoin Cash (BCH), store it in your HTX account. Alternatively, you can send it elsewhere via blockchain transfer or use it to trade other cryptocurrencies.Step 4: Trade Bitcoin Cash (BCH)Easily trade Bitcoin Cash (BCH) on HTX's spot market. Simply access your account, select your trading pair, execute your trades, and monitor in real-time. We offer a user-friendly experience for both beginners and seasoned traders.

6.0k Total ViewsPublished 2024.03.29Updated 2026.06.02

How to Buy BCH

Discussions

Welcome to the HTX Community. Here, you can stay informed about the latest platform developments and gain access to professional market insights. Users' opinions on the price of BCH (BCH) are presented below.

活动图片