HBAR Consolidates Near Lows While Analysts Map Potential Short-Term Bounce Scenarios

bitcoinistPublished on 2025-12-17Last updated on 2025-12-17

Abstract

Hedera's HBAR token is trading near its lowest levels in over a year, reflecting both broader crypto market weakness and project-specific challenges. After a steady decline, HBAR has entered a tight consolidation range, with traders debating whether this pause signals a potential short-term rebound or a continuation of the downtrend. The token recently fell to the $0.11–$0.12 range after failing to hold above the $0.125 support level. Market structure is bearish, with HBAR trading below key moving averages and momentum indicators like RSI and MACD pointing lower. Volume patterns show active trading around key levels, with resistance near $0.119–$0.122 and immediate support at $0.112–$0.113. A break above resistance could signal a move toward $0.13, while a breakdown might lead to a retest of the psychological $0.10 level. Analysts are divided: some see oversold conditions and potential for a bounce to the mid-$0.12 to $0.14 range, while others remain cautious due to slowing ecosystem growth and weak demand for Hedera-linked investment products.

Hedera’s HBAR token is trading near its lowest levels in more than a year, reflecting both broader crypto market weakness and project-specific headwinds.

After a steady decline through November and December, HBAR has slipped into a tight consolidation range, with traders debating whether the current pause marks a base for a short-term rebound or a continuation of the downtrend.

Recent price action indicates growing activity around key technical levels, despite mixed fundamental indicators.
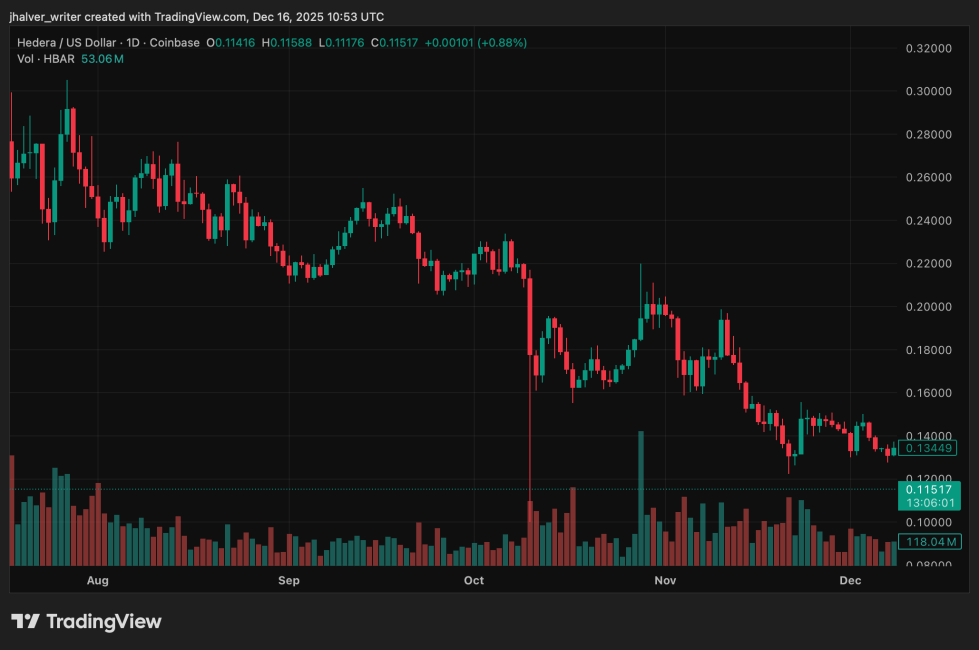
HBAR's price trends to the downside on the daily chart. Source: HBARUSD chart on Tradingview

HBAR Slides to Multi-Month Lows as Selling Pressure Builds

HBAR fell to around $0.11–$0.12 this week after failing to hold above the $0.125 support zone, a level that had acted as a floor several times earlier in the year. The drop coincided with a wider market pullback, as Bitcoin and major altcoins weakened ahead of global macro events, including Senate decisions in the U.S.

Trading data shows that volume surged sharply during attempts to reclaim resistance near $0.119–$0.120, suggesting active distribution rather than sustained accumulation.

Market structure has turned decisively bearish over recent sessions. HBAR is now trading below key moving averages, and momentum indicators such as RSI and MACD continue to point lower.

On-chain and ecosystem data have also weighed on sentiment, with Hedera’s total value locked declining significantly from earlier highs and stablecoin supply on the network shrinking over recent months.

Volume Spikes Show Key Support and Resistance Zones

Despite the broader downtrend, recent volume patterns have drawn attention from short-term traders. During one session, HBAR volume jumped more than 80% above its daily average as the price tested resistance near $0.119.

The rejection triggered another wave of selling, but late-session activity showed renewed buying interest as the price approached the $0.112–$0.113 area. This zone is now viewed as immediate support, with a deeper psychological level around $0.10 acting as the next downside reference if selling resumes.

On the upside, analysts are watching $0.119–$0.122 as a critical resistance band. A clean break above this range would be needed to shift short-term structure and open the door for a move toward prior highs near $0.13.

Analysts Split Between Oversold Bounce and Further Downside Risk

Some technical analysts argue that HBAR is approaching oversold conditions, noting weakening bearish momentum and signs of trendline breaks on lower timeframes. These signals have fueled short-term bounce scenarios targeting the mid-$0.12 to $0.14 range, provided support continues to hold.

Others remain cautious, pointing to stalled demand for recent Hedera-linked investment products and slowing ecosystem growth. From this view, failure to defend current levels could expose HBAR to a retest of $0.10, a level last seen during earlier liquidation events.

Cover image from ChatGPT, HBARUSD chart from Tradingview

Trending Cryptos

Related Reads

Interview with Robinhood Executive: Meme + Tokenized US Stocks as "Barbell" Customer Acquisition Strategy, All Business Lines Achieve Hundreds of Millions in Revenue

Interview with Robinhood executive Johann Kerbrat reveals the company's "barbell" customer acquisition strategy for its new Robinhood Chain, combining meme tokens with tokenized stocks. Three weeks after mainnet launch, the chain has seen over $3B in weekly DEX volume and 105M transactions. Kerbrat explains the logic behind the permissionless chain: meme tokens attract DeFi users, while tokenized real-world assets (RWA), currently over 90 US stocks and ETFs accessible in 120+ countries, serve global users. The goal is to bring Robinhood's 27 million funded accounts on-chain by simplifying DeFi with a user-friendly interface, exemplified by features like Robinhood Earn which offers yield without requiring wallet management. Built on Arbitrum's technology stack for its speed, low cost, and Ethereum's security, the chain focuses on financial products like Earn, spot trading, and perpetuals. Kerbrat downplays direct competition with platforms like Base, emphasizing the goal of expanding the overall market for on-chain assets. He details selective partnerships (e.g., Morpho, Lighter) based on compliance, unique UX, and differentiation. While regulatory clarity is pending for US perpetuals, the expansion continues via Bitstamp in Europe. Finally, Kerbrat positions Robinhood as a "super app" integrating stocks, options, crypto, banking, and AI trading, with all major business lines generating hundreds of millions in revenue. For the chain, current priority is driving adoption over maximizing gas fee revenue.

marsbit1h ago

Interview with Robinhood Executive: Meme + Tokenized US Stocks as "Barbell" Customer Acquisition Strategy, All Business Lines Achieve Hundreds of Millions in Revenue

marsbit1h ago

Fidelity Q3 Report: BTC, ETH, and SOL Continue to Build Bottoms; How Much Further Will This Crypto Bear Market Go?

Fidelity's Q3 Crypto Signal Report analyzes the current bear market, noting Bitcoin (BTC), Ethereum (ETH), and Solana (SOL) are in a prolonged bottoming phase. Key indicators like the weighted Net Unrealized Profit/Loss (NUPL) have turned negative (-0.01), signaling the market is slightly below its aggregate cost basis, with BTC acting as the primary stabilizing asset. BTC's dominance has risen to 68%, indicating a lack of capital rotation to other digital assets. Performance has been weak across the board, with BTC, ETH, and SOL down significantly year-to-date. Market sentiment is depressed, exacerbated by substantial outflows from spot ETPs and a challenging macro environment. The report compares the current ~203-day downtrend to historical ~300-day bottoming cycles, suggesting the process may be two-thirds complete, with late 2026 as a potential timeframe to monitor. For Bitcoin, NUPL at 0.09 indicates cautious sentiment, while momentum signals remain negative. The Yardstick metric points to potential undervaluation relative to network security (hashrate). Ethereum's NUPL is deep in the "capitulation" zone at -0.43, a historically positive signal for future returns, though its momentum and network fee revenue are negative. Solana shows the deepest NUPL at -0.72 but demonstrates relative resilience in on-chain activity and stablecoin transfer volume. The report concludes that while several metrics are near historical capitulation levels, a definitive market bottom has not yet been established. The path forward likely involves continued consolidation, with BTC's relative strength and fundamental on-chain usage for ETH and SOL providing key areas for investor observation.

marsbit1h ago

Fidelity Q3 Report: BTC, ETH, and SOL Continue to Build Bottoms; How Much Further Will This Crypto Bear Market Go?

marsbit1h ago

Trading

Spot

Hot Articles

How to Buy HBAR

Welcome to HTX.com! We've made purchasing Hedera Hashgraph (HBAR) simple and convenient. Follow our step-by-step guide to embark on your crypto journey.Step 1: Create Your HTX AccountUse your email or phone number to sign up for a free account on HTX. Experience a hassle-free registration journey and unlock all features.Get My AccountStep 2: Go to Buy Crypto and Choose Your Payment MethodCredit/Debit Card: Use your Visa or Mastercard to buy Hedera Hashgraph (HBAR) instantly.Balance: Use funds from your HTX account balance to trade seamlessly.Third Parties: We've added popular payment methods such as Google Pay and Apple Pay to enhance convenience.P2P: Trade directly with other users on HTX.Over-the-Counter (OTC): We offer tailor-made services and competitive exchange rates for traders.Step 3: Store Your Hedera Hashgraph (HBAR)After purchasing your Hedera Hashgraph (HBAR), store it in your HTX account. Alternatively, you can send it elsewhere via blockchain transfer or use it to trade other cryptocurrencies.Step 4: Trade Hedera Hashgraph (HBAR)Easily trade Hedera Hashgraph (HBAR) on HTX's spot market. Simply access your account, select your trading pair, execute your trades, and monitor in real-time. We offer a user-friendly experience for both beginners and seasoned traders.

5.2k Total ViewsPublished 2024.03.29Updated 2026.06.02

How to Buy HBAR

Discussions

Welcome to the HTX Community. Here, you can stay informed about the latest platform developments and gain access to professional market insights. Users' opinions on the price of HBAR (HBAR) are presented below.

活动图片













