HBAR于低位附近盘整,分析师预测潜在短期反弹情景

bitcoinistPublished on 2025-12-17Last updated on 2025-12-17

Abstract

Hedera的HBAR代币持续在一年多低点附近震荡,价格跌至0.11-0.12美元区间,反映出加密市场整体疲软及项目自身生态表现不佳。尽管近期交易量在关键阻力位0.119-0.122美元附近出现激增,但未能有效站稳,市场结构仍呈下行趋势。 分析师指出,若价格能突破0.119-0.122美元阻力带,可能打开短期反弹空间,目标看向0.13美元附近;若失守当前0.112-0.113美元支撑区域,则可能进一步下探0.10美元心理关口。技术指标显示HBAR处于超卖状态,部分分析师认为可能出现技术性反弹,但也有观点担忧其链上锁仓价值和稳定币供应量持续下降,或导致价格继续承压。

Hedera的HBAR代币正交易于一年多以来的低位附近,反映出加密市场整体疲软及项目特定逆风因素。

经过11月和12月的持续下跌后,HBAR已进入窄幅盘整区间。交易员们正在争论当前停顿是短期反弹的筑底信号,还是下跌趋势的延续。

尽管基本面指标好坏参半,近期价格走势显示关键技术位附近的交易活动正在增加。

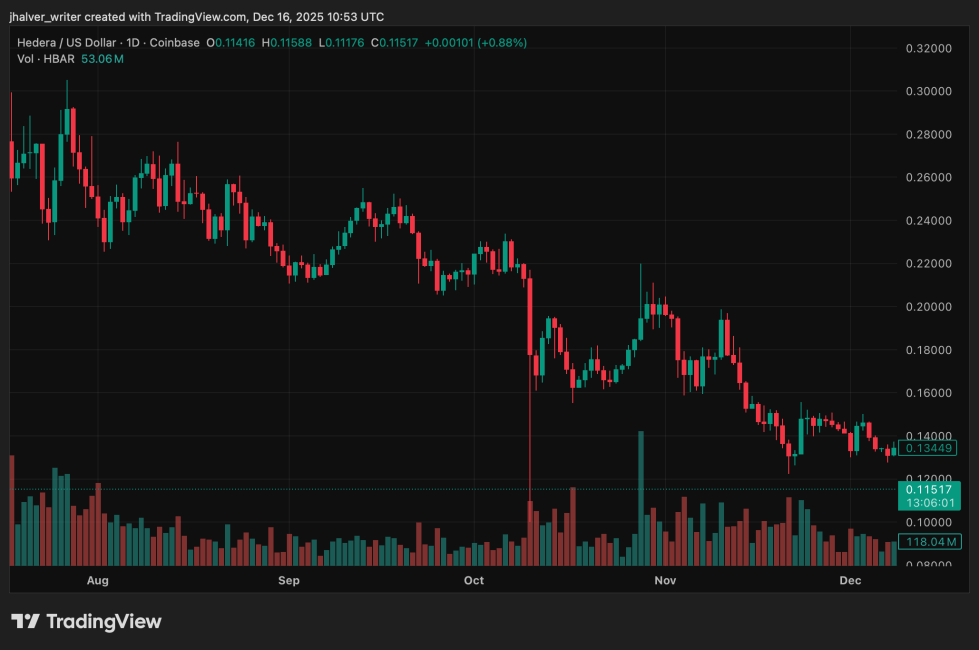
HBAR日线图呈现下行趋势。来源:Tradingview HBARUSD图表

抛压加剧致HBAR跌至数月新低

在未能守住0.125美元支撑位后,HBAR本周跌至0.11-0.12美元区间,该水平曾在今年早些时候多次充当底部支撑。此次下跌恰逢全球宏观事件(包括美国参议院决议)前夕比特币和主要山寨币的整体市场回调。

交易数据显示,在价格试图收复0.119-0.120美元阻力位时成交量急剧放大,表明存在活跃的派发行为而非持续性吸筹。

近期交易时段市场结构已明确转空。HBAR目前交易于关键移动平均线下方,RSI和MACD等动量指标持续走低。

链上及生态数据也加剧了看跌情绪,Hedera的总锁仓价值较早期高点显著下降,网络内稳定币供应量近几个月持续萎缩。

成交量激增揭示关键支撑阻力位

尽管整体呈下跌趋势,近期的成交量模式仍引起了短线交易者的关注。在某交易时段中,当价格测试0.119美元阻力位时,HBAR成交量较日均水平暴增80%。

阻力位的突破失败引发了新一轮抛售,但尾盘活动显示当价格接近0.112-0.113美元区域时出现新的买盘兴趣。该区域现被视为即时支撑,若抛售重启,0.10美元心理关口将成为下一个下行参考位。

上行方面,分析师正密切关注0.119-0.122美元关键阻力带。有效突破该区间将改变短期结构,为价格上探0.13美元附近前高打开空间。

分析师对超跌反弹与下行风险存分歧

部分技术分析师认为HBAR正接近超卖状态,指出较低时间框架上熊市动能减弱及趋势线突破迹象。这些信号助推了短期反弹预期,若支撑位持续稳固,目标看向0.12美元中段至0.14美元区间。

其他分析师仍持谨慎态度,指出Hedera相关投资产品需求停滞及生态系统增长放缓。依此观点,若当前水平失守,HBAR可能重新测试0.10美元关口,该水平曾在此前的清算事件中出现。

封面图片来自ChatGPT,HBARUSD图表来自Tradingview

Trending Cryptos

Related Questions

QHBAR目前的价格水平处于什么时期以来的最低点?

AHBAR目前的价格水平处于一年多以来的最低点。

Q根据文章,HBAR价格下跌的主要原因是什么?

AHBAR价格下跌的主要原因是广泛的加密货币市场疲软以及项目特定的不利因素(如生态系统中锁定的总价值下降和网络稳定币供应减少)。

Q技术分析师指出的关键阻力位和支撑位分别在什么价格区间?

A关键阻力位在$0.119–$0.122区间,而关键支撑位在$0.112–$0.113区间,更深层的心理支撑位在$0.10。

Q分析师对HBAR短期走势的看法存在哪两种主要分歧?

A分析师的分歧主要在于:一部分认为HBAR已接近超卖状态,可能出现短期反弹至$0.12中段至$0.14区间;另一部分则持谨慎态度,认为若当前支撑失守可能重新测试$0.10的低位。

Q文章中提到哪些技术指标显示市场结构转向看跌?

A文章中提到HBAR交易价格低于关键移动平均线,且动量指标如RSI和MACD持续指向下行,表明市场结构已明确转向看跌。

Related Reads

Fidelity Q3 Report: BTC, ETH, and SOL Continue to Build Bottoms; How Much Further Will This Crypto Bear Market Go?

Fidelity's Q3 Crypto Signal Report analyzes the current bear market, noting Bitcoin (BTC), Ethereum (ETH), and Solana (SOL) are in a prolonged bottoming phase. Key indicators like the weighted Net Unrealized Profit/Loss (NUPL) have turned negative (-0.01), signaling the market is slightly below its aggregate cost basis, with BTC acting as the primary stabilizing asset. BTC's dominance has risen to 68%, indicating a lack of capital rotation to other digital assets. Performance has been weak across the board, with BTC, ETH, and SOL down significantly year-to-date. Market sentiment is depressed, exacerbated by substantial outflows from spot ETPs and a challenging macro environment. The report compares the current ~203-day downtrend to historical ~300-day bottoming cycles, suggesting the process may be two-thirds complete, with late 2026 as a potential timeframe to monitor. For Bitcoin, NUPL at 0.09 indicates cautious sentiment, while momentum signals remain negative. The Yardstick metric points to potential undervaluation relative to network security (hashrate). Ethereum's NUPL is deep in the "capitulation" zone at -0.43, a historically positive signal for future returns, though its momentum and network fee revenue are negative. Solana shows the deepest NUPL at -0.72 but demonstrates relative resilience in on-chain activity and stablecoin transfer volume. The report concludes that while several metrics are near historical capitulation levels, a definitive market bottom has not yet been established. The path forward likely involves continued consolidation, with BTC's relative strength and fundamental on-chain usage for ETH and SOL providing key areas for investor observation.

marsbit12m ago

Fidelity Q3 Report: BTC, ETH, and SOL Continue to Build Bottoms; How Much Further Will This Crypto Bear Market Go?

marsbit12m ago

Trading

Spot

Hot Articles

How to Buy HBAR

Welcome to HTX.com! We've made purchasing Hedera Hashgraph (HBAR) simple and convenient. Follow our step-by-step guide to embark on your crypto journey.Step 1: Create Your HTX AccountUse your email or phone number to sign up for a free account on HTX. Experience a hassle-free registration journey and unlock all features.Get My AccountStep 2: Go to Buy Crypto and Choose Your Payment MethodCredit/Debit Card: Use your Visa or Mastercard to buy Hedera Hashgraph (HBAR) instantly.Balance: Use funds from your HTX account balance to trade seamlessly.Third Parties: We've added popular payment methods such as Google Pay and Apple Pay to enhance convenience.P2P: Trade directly with other users on HTX.Over-the-Counter (OTC): We offer tailor-made services and competitive exchange rates for traders.Step 3: Store Your Hedera Hashgraph (HBAR)After purchasing your Hedera Hashgraph (HBAR), store it in your HTX account. Alternatively, you can send it elsewhere via blockchain transfer or use it to trade other cryptocurrencies.Step 4: Trade Hedera Hashgraph (HBAR)Easily trade Hedera Hashgraph (HBAR) on HTX's spot market. Simply access your account, select your trading pair, execute your trades, and monitor in real-time. We offer a user-friendly experience for both beginners and seasoned traders.

5.2k Total ViewsPublished 2024.03.29Updated 2026.06.02

How to Buy HBAR

Discussions

Welcome to the HTX Community. Here, you can stay informed about the latest platform developments and gain access to professional market insights. Users' opinions on the price of HBAR (HBAR) are presented below.

活动图片