10 décembre : Analyse du marché du BTC, ETH, SOL, MERL, ZEC

金色财经Published on 2025-12-10Last updated on 2025-12-10

Abstract

Le Bitcoin (BTC) a connu une hausse soudaine hier, atteignant 94 640 USD avant de retomber vers 92 000 USD. Les institutions continuent d'acheter activement, mais la confiance des petits investisseurs reste faible tant que le BTC ne dépasse pas 100 000 USD. L'analyse technique montre une rupture haussière avec des objectifs vers 98 000 USD. Les supports clés sont à 92 000 USD et 90 540 USD. L'Ethereum (ETH) affiche une performance plus forte avec quatre séances consécutives de hausse, dépassé 3 260 USD. Des résistances se situent à 3 380 USD et 3 480 USD, tandis que les supports sont à 3 230 USD et 3 150 USD. Le Solana (SOL) pourrait bientôt franchir 147,5 USD. Si cela se produit, une progression vers 154-158 USD est envisageable. Cependant, des retracements restent possibles. Pour le MERL, la tendance reste baissière avec une attention particulière sur le niveau de 0,20 USD, considéré comme un point clé pour les acheteurs. En dessous, une forte vente panique pourrait survenir. Enfin, le ZEC présente des signes de correction technique après une hausse significative. Il est recommandé de sécuriser les bénéfices sur les positions longues. En résumé, le marché affiche un mix d'optimisme institutionnel et de prudence retail, avec des opportunités à court terme mais nécessitant une gestion attentive des risques.

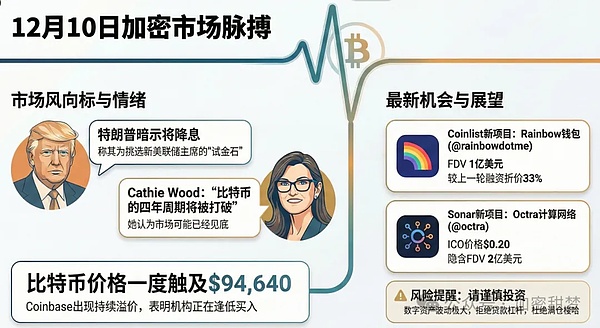
Le Bitcoin a soudainement grimpé hier soir à l'heure des marchés américains, atteignant un sommet de 94 640 dollars, avant de retomber aux alentours de 92 000 dollars. La prime persistante sur Coinbase (CB) réapparaît, indiquant que les institutions achètent frénétiquement à bas prix.

Récemment, des personnalités comme Cathie Wood (Ark Invest) et Changpeng Zhao (CZ) ont déclaré que le cycle de quatre ans était terminé. Actuellement, la confiance des grandes institutions est au plus haut, mais celle des petits investisseurs reste faible. Pour restaurer la confiance des petits investisseurs, la seule solution est une hausse des cours, ramenant le Bitcoin au-dessus de 100 000 dollars. À ce moment-là, les petits investisseurs redeviendront fous.
BTC

Sur le graphique journalier, le BTC a franchi en hausse la ligne de tendance avec volume, sortant de la configuration baissière. Un repli pourrait offrir une nouvelle opportunité d'achat. La configuration du MACD, sur le point de franchir la ligne zéro, suggère une poursuite possible de la hausse. La hausse volumeux indique un renforcement des forces haussières ; il faut être un peu plus prudent avec les positions short. La résistance se situe vers 98 000 dollars.

La cassure sur le graphique 4 heures est terminée. Après la cassure, deux niveaux importants pour un repli : la médiane du canal haussier et le niveau de support issu de l'ancienne résistance (les deux niveaux sont indiqués sur le graphique).

Deux niveaux clés : 92 000 et 90 540 dollars. En cas de rupture du niveau clé de 90 540, évitez les positions longues à court terme. Ces deux niveaux permettent d'ouvrir des positions longues légères, avec un stop-loss en cas de rupture.

ETH

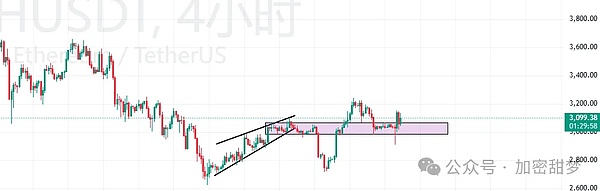
Le graphique journalier de l'Ethereum est plus fort, affichant 4 bougies vertes consécutives et franchissant directement les 3 260 dollars. Le prix actuel est autour de 3 320 dollars, oscillant près de la bande supérieure de Bollinger. Sur le graphique 4 heures, après une forte hausse, un repli est attendu.

La stratégie intraday reste principalement de vendre à la hausse (short). Avoir manqué les positions longues ne justifie pas d'acheter au plus haut. Les résistances supérieures se situent vers 3 380 et 3 480 dollars. Privilégiez les positions short autour de ces niveaux en cas de repli.

Les supports inférieurs se situent vers 3 230, 3 150 et 3 060 dollars. Une rupture sous les 3 000 dollars serait nécessaire pour viser ensuite 2 900, 2 820, 2 730 et enfin 2 620 dollars.
SOL

SOL a été faible pendant un certain temps, sans réussir à franchir les 147 dollars. Auparavant, SOL changeait de tendance avant le BTC, mais cette fois, c'est l'ETH qui a franchi le premier une résistance clé. Il est donc probable que SOL suive le mouvement et franchisse ce niveau ce soir. S'il dépasse 147,5 dollars et maintient un repli au-dessus de 141,85-138,85 dollars (c'est-à-dire se stabilise au-dessus de 138), alors dans les prochains jours, il pourrait tenter de atteindre 154-158 dollars.

Le rebond sur le graphique 3 jours de SOL ne s'est pas encore matérialisé. Une petite poussée ce soir devrait suffire à l'activer. Mais après avoir atteint le point de résistance, un repli est attendu. Les positions longues à bas prix peuvent être rentables, tout comme les positions short à la hausse, mais il faut savoir à quel niveau prendre ses bénéfices sur le repli avant de rouvrir des positions longues.

$MERL

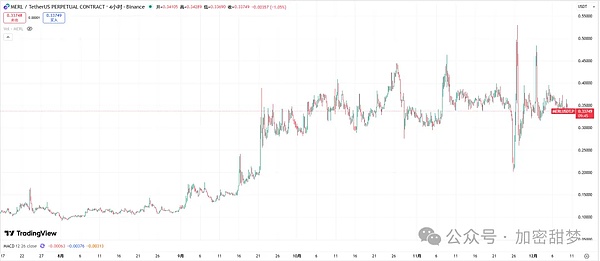
MERL a testé les alentours de 0,50 dollar trois fois ce mois-ci, et à chaque fois il a été rejeté violemment. Les volumes de hausse semblent importants mais sont en réalité du vent, l'achat ne suit pas vraiment. Les sommets sont de plus en plus bas, les rebonds de plus en plus courts, la structure baissière est évidente.

Je surveille de près le niveau de 0,20 dollar, principalement pour trois raisons :

1. Le coût pour l'équipe du projet se situe essentiellement dans la fourchette 0,18-0,22 dollar ; en tombant ici, ils réagissent généralement d'une manière ou d'une autre.

2. C'est aussi la ligne de défense psychologique des petits investisseurs ; s'il tient, on peut reprendre son souffle, s'il casse, ce sera la panique et la chute libre.

3. Point clé de la tendance : s'il se stabilise, cela indique un essoufflement des vendeurs ; s'il casse, c'est la porte ouverte à une chute plus importante.

Alors ne vous précipitez pas pour acheter au plus bas maintenant, et n'attendez pas un rallye isolé. La tendance baissière de MERL est intacte, ne passez pas acheteur avant les 0,20 dollar. Attendez près de 0,20 dollar pour voir s'il continue de chuter ou montre des signes de rebond, le graphique donnera la réponse. Gardez du cash, suivez la tendance, n'allez pas à contre-courant.
ZEC

Prenez vos bénéfices sur toutes vos positions longues. Sur le graphique 1h, la configuration est un coin ascendant (wedge) avec un possible double sommet (M Top). Un correctif à court terme est probable, et il y a une divergence baissière (divergence de hauteur). Compte tenu de l'érosion des gains, il est conseillé de clôturer toutes les positions longues. Les gains sont déjà importants (entrée à 359$, prix actuel 440$), ne soyez pas avide du dernier dollar.

Si vous trouvez notre contenu intéressant, partagez notre compte public avec vos amis ! Bienvenue à ceux qui nous rejoignent et nous suivent pour rester informés des dernières actualités crypto ! Chaque effondrement brutal est suivi d'un océan d'opportunités. Ceux qui sont perdus pour la suite des opérations peuvent suivre Tianmeng, contact WeChat : RFGH8689


Trending Cryptos

Related Questions

QSelon l'analyse, pourquoi les institutions financières achètent-elles activement du Bitcoin ?

ALes institutions financières achètent activement du Bitcoin en raison de la prime persistante sur Coinbase, indiquant une forte demande institutionnelle lors des baisses de prix.

QQuels sont les deux niveaux de support clés pour BTC identifiés dans l'analyse technique ?

ALes deux niveaux de support clés pour BTC sont 92 000 USD et 90 540 USD. Une rupture en dessous de 90 540 USD suggère d'éviter les positions longues à court terme.

QQuelle est la stratégie recommandée pour Ethereum (ETH) selon l'article ?

ALa stratégie recommandée pour Ethereum est de privilégier les positions courtes (vendre à la baisse) autour des niveaux de résistance à 3 380 USD et 3 480 USD, en évitant d'acheter à des prix élevés.

QÀ quel niveau le jeton MERL montre-t-il des signes critiques pour les tendances haussières ou baissières ?

ALe niveau critique pour MERL est 0,20 USD. En dessous de ce niveau, la tendance baissière pourrait s'accélérer, tandis qu'un maintien au-dessus pourrait indiquer un épuisement des vendeurs.

QPourquoi l'article recommande-t-il de clôturer les positions longues sur ZEC ?

AIl est recommandé de clôturer les positions longues sur ZEC en raison d'une configuration technique en wedge haussier, d'un double sommet potentiel et d'une divergence baissière sur l'indicateur, suggérant une correction imminente.

Related Reads

Playing the "Decoupling" Card Again? Domestic Optical Modules Face a Stress Test

The U.S. Federal Communications Commission (FCC) is reportedly drafting a ban on importing new models of Chinese-made optical transceiver modules, with a potential implementation target of 2026. This "decoupling" move comes as Chinese firms, led by industry leaders like Zhongji Innolight and Eoptolink, dominate the global optical module market with over 60% share, and hold an even larger position in the high-speed 800G and 1.6T segments critical for AI data centers. Market reactions were mixed: U.S. optical module stocks initially rose, while Chinese A-shares opened lower but largely recovered by the close. Analysis suggests a complete U.S. decoupling from Chinese modules faces significant hurdles. North American cloud giants (Meta, Google, Microsoft, Amazon) and NVIDIA have massive demand for high-speed modules, estimated at around 40 million units in 2026. U.S. manufacturers' combined monthly production capacity for these modules is less than one-fifth that of a single major Chinese player like Zhongji Innolight, which reported production of 23.76 million units in 2025. Chinese companies are heavily reliant on the U.S. market, with over 90% of revenue for top firms coming from overseas, primarily the U.S. However, they have begun mitigating risks by establishing assembly plants in Southeast Asia and Mexico. Industry observers note the final impact depends on whether any potential U.S. restrictions target specific companies or products based on origin. Past U.S. sanctions on Chinese tech firms have often spurred increased domestic R&D and market diversification. Despite initial stock volatility, shares of major Chinese optical module companies pared losses, indicating market belief in the sector's resilience and the practical difficulties of abruptly replacing Chinese supply.

marsbit10m ago

Playing the "Decoupling" Card Again? Domestic Optical Modules Face a Stress Test

marsbit10m ago

When the Competition in Chip Manufacturing Equipment Stops Being Just About Who Is More Advanced

The competition in chip manufacturing equipment is no longer solely about who has the most advanced technology. While performance, yield, and cost remain key, U.S. export controls are adding a critical new dimension: long-term supply chain reliability. Major chipmakers like Samsung and SK Hynix, despite having mature supply chains with leading American and European vendors, are reportedly evaluating etching equipment from China's AMEC for their Chinese factories. This move is not primarily about immediate replacement or AMEC's current capabilities. Instead, it's a risk mitigation strategy. Companies are concerned that future U.S. policies could disrupt their access to spare parts, software updates, and maintenance for existing equipment over its decade-long lifespan. For chipmakers investing billions in fabs with long planning cycles, this policy-induced uncertainty is a significant new risk. The U.S., through its controls, is inadvertently eroding the very reliability and certainty that were foundational strengths of its equipment suppliers. This creates a pivotal shift for Chinese semiconductor equipment. Previously seen largely as a "domestic replacement" option when foreign gear was unavailable, they are now being assessed as potential "contingency suppliers" by global players—even before a supply disruption occurs. This provides a crucial entry point for validation in real production lines, which is essential for iterative improvement. Chinese equipment, particularly in areas like etching, has progressed from prototypes to participating in mass production within China, gaining valuable experience. However, this does not signify full global competitiveness. Gaps remain in advanced lithography, metrology, and other key tools. The current evaluations are largely confined to foreign firms' China-based fabs, not their global procurement networks. The core change is in the decision-making framework. Efficiency-driven globalization favored single, optimal suppliers. An era of heightened geopolitical risk is forcing companies to value "replaceability." While technical prowess remains paramount, supply chain certainty is now being factored into a device's competitive equation. Ultimately, U.S. policies have not made Chinese equipment more advanced, but they have given global customers a compelling reason to start testing it. The competition has expanded: it's no longer just about who is more advanced, but also about who can be relied upon to stay.

marsbit11m ago

When the Competition in Chip Manufacturing Equipment Stops Being Just About Who Is More Advanced

marsbit11m ago

Trading Volume Increased by 2.5x, Why Did Circle's Revenue Only Grow by 7%?

Circle's Q2 performance presents a seemingly contradictory picture: the transaction volume of its stablecoin USDC surged 151% year-over-year to $14.8 trillion, while its "Total Revenue & Reserve Revenue" grew by only 7% to $701 million. This discrepancy highlights the core of Circle's business model. Revenue is primarily driven not by transaction volume, but by the average amount of USDC in circulation and the yield generated from its reserves. Key points: 1. **Revenue Drivers:** Over 90% of revenue comes from "reserve income," which is a function of average USDC circulation (up 25% YoY) and the reserve yield (which fell by 66 basis points). The net effect was a mere ~5% increase in reserve income. 2. **Transaction vs. Revenue:** High transaction volume indicates robust usage of USDC for payments and settlements, but does not translate directly to revenue. It must first convert into a sustained, average circulating balance. 3. **Cost Structure:** After accounting for distribution and other costs, the metric "Revenue Less Direct Costs" (RLDC) grew faster than total revenue, with its margin improving. However, rising operating expenses (up 23% YoY) meant that Adjusted EBITDA growth was limited to 8%. 4. **New Initiatives:** Circle reported progress on new networks like the Circle Payments Network and upcoming products (Arc, Agent Stack), but these are currently measured by adoption metrics (e.g., transaction run-rate, number of services) rather than material revenue contribution this quarter. In summary, the financial results are determined by the interplay of USDC circulation, reserve yields, and cost structures, while high transaction volume signals underlying network strength that has not yet fully flowed through to the income statement.

marsbit28m ago

Trading Volume Increased by 2.5x, Why Did Circle's Revenue Only Grow by 7%?

marsbit28m ago

Samsung China, Another Step Back

Samsung China Takes Another Step Back Samsung Electronics is further retreating from the Chinese consumer market. Following the exit of its home appliance business in May, its mobile phone division is now reportedly scaling down. Stores with monthly sales below 300,000 RMB are being closed in several cities. Data shows Samsung's smartphone market share in China has plummeted to 0.1% in Q2 2026, a stark contrast to its 22% global leadership. The decline is attributed to intense competition from domestic brands offering better value, higher specs (like faster charging), and superior localization in software and services. Samsung's premium pricing and less adapted One UI system have struggled against rivals like Huawei, Xiaomi, and Honor. This consumer electronics retreat coincides with Samsung's record-breaking semiconductor profits, driven by the AI boom. In Q2 2026, the chip division contributed nearly all operating profit, while the mobile and home appliance unit posted its first-ever operating loss. Internal dynamics, like the chip division charging market prices to the mobile unit, have increased cost pressures. Samsung's strategy now appears to be a focused retreat towards the ultra-premium segment in China, similar to its global push in high-end foldables like the Galaxy Z Fold8. The company is likely to retain only key stores in major cities to serve a niche, high-end clientele. While its deep semiconductor reserves offer a cushion, this shift away from mass-market consumer electronics reduces business diversification. The move is pragmatic but signifies a fundamental transformation; Samsung is ceding mass-market influence and betting heavily on its semiconductor strength and a narrowed premium product focus.

marsbit32m ago

Samsung China, Another Step Back

marsbit32m ago

Trading

Spot

Hot Articles

What is $BITCOIN

DIGITAL GOLD ($BITCOIN): A Comprehensive Analysis Introduction to DIGITAL GOLD ($BITCOIN) DIGITAL GOLD ($BITCOIN) is a blockchain-based project operating on the Solana network, which aims to combine the characteristics of traditional precious metals with the innovation of decentralized technologies. While it shares a name with Bitcoin, often referred to as “digital gold” due to its perception as a store of value, DIGITAL GOLD is a separate token designed to create a unique ecosystem within the Web3 landscape. Its goal is to position itself as a viable alternative digital asset, although specifics regarding its applications and functionalities are still developing. What is DIGITAL GOLD ($BITCOIN)? DIGITAL GOLD ($BITCOIN) is a cryptocurrency token explicitly designed for use on the Solana blockchain. In contrast to Bitcoin, which provides a widely recognized value storage role, this token appears to focus on broader applications and characteristics. Notable aspects include: Blockchain Infrastructure: The token is built on the Solana blockchain, known for its capacity to handle high-speed and low-cost transactions. Supply Dynamics: DIGITAL GOLD has a maximum supply capped at 100 quadrillion tokens (100P $BITCOIN), although details regarding its circulating supply are currently undisclosed. Utility: While precise functionalities are not explicitly outlined, there are indications that the token could be utilized for various applications, potentially involving decentralized applications (dApps) or asset tokenization strategies. Who is the Creator of DIGITAL GOLD ($BITCOIN)? At present, the identity of the creators and development team behind DIGITAL GOLD ($BITCOIN) remains unknown. This situation is typical among many innovative projects within the blockchain space, particularly those aligning with decentralized finance and meme coin phenomena. While such anonymity may foster a community-driven culture, it intensifies concerns about governance and accountability. Who are the Investors of DIGITAL GOLD ($BITCOIN)? The available information indicates that DIGITAL GOLD ($BITCOIN) does not have any known institutional backers or prominent venture capital investments. The project seems to operate on a peer-to-peer model focused on community support and adoption rather than traditional funding routes. Its activity and liquidity are primarily situated on decentralized exchanges (DEXs), such as PumpSwap, rather than established centralized trading platforms, further highlighting its grassroots approach. How DIGITAL GOLD ($BITCOIN) Works The operational mechanics of DIGITAL GOLD ($BITCOIN) can be elaborated on based on its blockchain design and network attributes: Consensus Mechanism: By leveraging Solana’s unique proof-of-history (PoH) combined with a proof-of-stake (PoS) model, the project ensures efficient transaction validation contributing to the network's high performance. Tokenomics: While specific deflationary mechanisms have not been extensively detailed, the vast maximum token supply implies that it may cater to microtransactions or niche use cases that are still to be defined. Interoperability: There exists the potential for integration with Solana’s broader ecosystem, including various decentralized finance (DeFi) platforms. However, the details regarding specific integrations remain unspecified. Timeline of Key Events Here is a timeline that highlights significant milestones concerning DIGITAL GOLD ($BITCOIN): 2023: The initial deployment of the token occurs on the Solana blockchain, marked by its contract address. 2024: DIGITAL GOLD gains visibility as it becomes available for trading on decentralized exchanges like PumpSwap, allowing users to trade it against SOL. 2025: The project witnesses sporadic trading activity and potential interest in community-led engagements, although no noteworthy partnerships or technical advancements have been documented as of yet. Critical Analysis Strengths Scalability: The underlying Solana infrastructure supports high transaction volumes, which could enhance the utility of $BITCOIN in various transaction scenarios. Accessibility: The potential low trading price per token could attract retail investors, facilitating wider participation due to fractional ownership opportunities. Risks Lack of Transparency: The absence of publicly known backers, developers, or an audit process may yield skepticism regarding the project's sustainability and trustworthiness. Market Volatility: The trading activity is heavily reliant on speculative behavior, which can result in significant price volatility and uncertainty for investors. Conclusion DIGITAL GOLD ($BITCOIN) emerges as an intriguing yet ambiguous project within the rapidly evolving Solana ecosystem. While it attempts to leverage the “digital gold” narrative, its departure from Bitcoin's established role as a store of value underscores the need for a clearer differentiation of its intended utility and governance structure. Future acceptance and adoption will likely depend on addressing the current opacity and defining its operational and economic strategies more explicitly. Note: This report encompasses synthesised information available as of October 2023, and developments may have transpired beyond the research period.

1.5k Total ViewsPublished 2025.05.13Updated 2025.05.13

What is $BITCOIN

Discussions

Welcome to the HTX Community. Here, you can stay informed about the latest platform developments and gain access to professional market insights. Users' opinions on the price of BTC (BTC) are presented below.

活动图片