Bitcoin Coin Days Destroyed Drops By 50% Amid Waning Price Action – What This Means

bitcoinistPublished on 2025-09-29Last updated on 2025-09-29

Abstract

As the new week begins, Bitcoin, the largest cryptocurrency asset, experienced a slight upward move after reclaiming the $111,000 price...

Trusted Editorial content, reviewed by leading industry experts and seasoned editors. Ad Disclosure

As the new week begins, Bitcoin, the largest cryptocurrency asset, experienced a slight upward move after reclaiming the $111,000 price mark once again. Within the ongoing volatility that has hindered BTC’s uptrend, several key on-chain metrics are starting to exhibit bullish developments, suggesting a potential resurgence in the market.

HODL Wave Intensifies As Bitcoin CDD Falls

Bitcoin’s price continues to struggle with volatility, but on-chain metrics are flashing signs of renewed resilience. The newfound resilience is indicated by the BTC Coin Days Destroyed (CDD) metric, a key indicator of long-term holder activity, which has declined strongly in recent market trends.

Darkfost, a market expert and author, reported the decline in Coin Days Destroyed in a recent post on the social media platform X. This sharp drop implies that more experienced investors are retaining more coins rather than spending them, as evidenced by the fact that they are moving fewer coins.

Specifically, CDD is a highly pertinent metric to gauge the “firepower” of LTHs, as the metric takes into consideration the holding days of recently transferred BTC. According to Darkfost, CDD signals this at the exact moment of movement, providing an opportunity to predict selling pressure. It’s a powerful early indicator because when long-term holders move their coins, they frequently do so with the intention of selling.

Bitcoin
Source: Chart from Darkfost on X

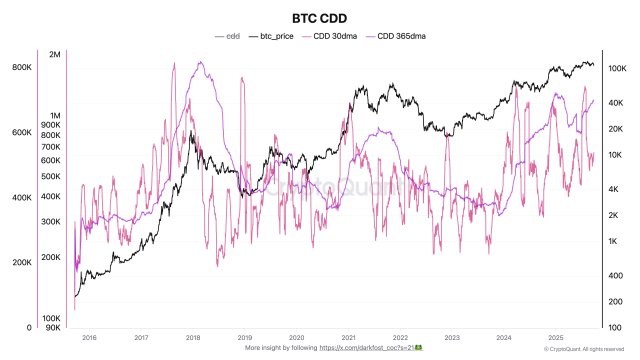
Looking at what’s going on with CDD, Darkfost highlighted that the activity on the LTH side finally appears to have slowed down. Historically, such developments have been linked to consolidation periods preceding new uptrends. Therefore, this change may be an indication of increased market confidence in Bitcoin’s long-term direction.

After reaching a monthly average record of almost 1.3 million BTC, the key CDD metric has now been cut in half to around 650,000 BTC. With the 50% decline, the metric is now back below the yearly average, which remains elevated.

BTC Long-Term Holders SOPR Exhibiting Weakness

In addition to the report, Darkfost has revealed a worrying trend in the Bitcoin Long-Term Holders Spent Output Profit Ratio (SOPR). Presently, long-term BTC holders seem to be showing subtle signs of fatigue, as their SOPR has weakened.

This indicator, which monitors whether coins moved on-chain are being sold for a profit or a loss, frequently captures more profound changes in the opinion of experienced investors. According to the expert, the major metric is now located at 1.26, marking its lowest level since February 2024.

On a monthly average basis, it has also experienced a significant decline, currently standing at 1.70, indicating a 70% average profit, following a peak of 3. Darkfost noted that the drop indicates that there is less selling pressure on LTH. Although the industry has changed, the analyst notes that the activity of long-term holders remains important to monitor due to their influence on the market.

Bitcoin
BTC trading at $111,822 on the 1D chart | Source: BTCUSDT on Tradingview.com
Featured image from Pixabay, chart from Tradingview.com
Editorial Process for bitcoinist is centered on delivering thoroughly researched, accurate, and unbiased content. We uphold strict sourcing standards, and each page undergoes diligent review by our team of top technology experts and seasoned editors. This process ensures the integrity, relevance, and value of our content for our readers.

Godspower Owie is my name, and I work for the news platforms NewsBTC and Bitcoinist. I sometimes like to think of myself as an explorer since I enjoy exploring new places, learning new things, especially valuable ones, and meeting new people who have an impact on my life, no matter how small. I value my family, friends, career, and time. Really, those are most likely the most significant aspects of every person's existence. Not illusions, but dreams are what I pursue.

Trending Cryptos

Related Reads

After Missing the 20x, I've Found a 'Dumb' Method for AI Investing

**Missing the 20x Opportunity: A Simple 'Dumb' Approach to AI Investing** The AI boom, driving NVIDIA's revenue from $60B to $216B in two years, creates immense investment pressure. However, like the internet bubble of 2000, the largest AI opportunities likely lie ahead, perhaps after a correction. Instead of rushing in now or waiting paralyzed for a crash, the author proposes a third way: building a "knowledge warehouse" by systematically mapping the AI industry to be ready when opportunities arise. The core of the strategy is understanding AI's four-layer value chain: 1. **Compute Infrastructure (The "Engine"):** This foundational layer, where all money eventually flows, includes: a) **Chip Design:** NVIDIA's dominance via its CUDA ecosystem, b) **Chip Manufacturing/Packaging/Memory:** TSMC's near-monopoly in advanced manufacturing and SK Hynix's lead in High Bandwidth Memory (HBM), c) **Optical Interconnects:** Essential for large-scale AI clusters (e.g., Lumentum, Coherent), d) **Cooling & Power:** Critical for high-density AI data centers (e.g., Vertiv), e) **Servers/Data Centers & Cloud Platforms:** The physical and virtual wholesale providers. 2. **Models & Tools (The "OS"):** The competitive layer of foundation models (OpenAI, Anthropic, Google, Meta, xAI), now generating real revenue. A key shift is the center of gravity moving from **Training** models to **Inference** (running models), which demands different chip characteristics and could challenge NVIDIA's monopoly. 3. **Middleware & Platform ("The Glue"):** Connects models and applications (e.g., Scale AI, Hugging Face). This layer could explode if applications take off. 4. **Vertical Applications ("The Cash Register"):** Where AI meets end-users (e.g., enterprise AI, coding tools, medical AI, robotics). A critical cross-cutting constraint is **Energy**, as AI's massive power consumption drives investment in nuclear and other energy infrastructure. The author identifies four key questions for further research: 1) How will the shift from Training to Inference reshape the competitive landscape? 2) With tech giants spending over $600B on capex, where is the ROI from AI applications? 3) What are the under-the-radar opportunities in the "second" and "third" circles of the value chain (e.g., cooling, specialty foundries)? 4) How will geopolitics (e.g., U.S.-China chip restrictions) bifurcate the supply chain? The conclusion is that missed opportunities stem from insufficient research, not slow timing. By methodically studying each layer—its business models, competition, and valuations—investors can build the "killer intuition" needed to act decisively when the market presents its chance.

marsbit2m ago

After Missing the 20x, I've Found a 'Dumb' Method for AI Investing

marsbit2m ago

Rented Faith: How Much of the Bitcoin ETF Inflows Is Real Money?

"Rented Conviction: How Much of Bitcoin ETF Flows Is Real Money" The weekly inflows into Bitcoin ETFs are often interpreted as a gauge of institutional belief. However, a significant portion of this activity is driven by a hidden arbitrage trade, not directional conviction. The core mechanism is a cash-and-carry arbitrage: traders buy spot Bitcoin (often via ETFs) while simultaneously shorting CME futures to lock in the price difference, or "basis." This delta-neutral trade is essentially an interest rate play. In weekly data, about half the fluctuation in ETF flows can be explained by new short positions added by leveraged funds (hedge funds), with a correlation of 0.70. Bitcoin's price movement in a given week shows no statistical power in predicting these flows. While this arbitrage trade drives weekly *volatility*, it is not the main component of the cumulative *stock*. Of the total ~$55 billion in net ETF inflows, the current net arbitrage position is only about $1 billion. The remainder is steady, directional buying averaging ~$400 million per week, which constitutes the vast majority of the accumulated "mountain" over two years. Thus, ETF flow data overstates the *volatility* of conviction, not its *level*. This arbitrage trade has been unwinding for nearly two years. Leveraged fund short positions peaked at ~$14 billion in late 2024 and have since declined to ~$4.5 billion. When the basis compresses to unprofitable levels, ETF inflows and short positions retreat together. Recent outflows should not be mistaken for a loss of faith but rather the routine unwinding of this rate trade. For Ethereum ETFs, the pattern is weaker. Accounting for staking yield makes the basis often negative, so neither strong conviction buying nor robust arbitrage supports its flows. To interpret ETF flows correctly, monitor the CME basis versus T-bill rates and leveraged fund net shorts. They reveal how much of the next "demand" headline is real. The real, patient buy-and-hold demand is what constitutes the enduring bulk of ETF assets.

marsbit50m ago

Rented Faith: How Much of the Bitcoin ETF Inflows Is Real Money?

marsbit50m ago

Soaring Over Tenfold Within the Year: The Frenzy Over SK Hynix Leveraged Products

South China Morning Post The leveraged ETF tracking SK Hynix has surged over tenfold year-to-date, fueled by intense market speculation on the memory chip sector. By June 22, the value of the 'South Korea 2x Long SK Hynix ETF' listed in Hong Kong had skyrocketed by more than 1,061% since the start of the year, while its asset size exploded over twenty times from the end of last year. The rally is driven by AI-driven demand for high-bandwidth memory (HBM), with SK Hynix recently sampling its next-generation HBM4E product. However, industry professionals warn of significant risks. Leveraged ETFs magnify both gains and losses. During a recent market correction, while the underlying SK Hynix stock fell 19.1%, its double-leveraged ETF dropped nearly 38%. Korean regulators noted that such products could theoretically lose 60% in a single day. Additionally, these ETFs face risks like time decay in volatile markets, liquidity spirals during mass redemptions, and extreme price dislocations from market-making failures, as seen in early June when an ETF moved opposite to its underlying stock. The trading is predominantly driven by retail investors, with institutional capital largely absent due to the products' high volatility. Analysts caution that with the semiconductor sector at elevated valuations and facing geopolitical and supply chain uncertainties, leveraged ETFs pose a substantial threat of amplified losses for uninformed investors.

marsbit1h ago

Soaring Over Tenfold Within the Year: The Frenzy Over SK Hynix Leveraged Products

marsbit1h ago

Trading

Spot
Futures

Hot Articles

What is $BITCOIN

DIGITAL GOLD ($BITCOIN): A Comprehensive Analysis Introduction to DIGITAL GOLD ($BITCOIN) DIGITAL GOLD ($BITCOIN) is a blockchain-based project operating on the Solana network, which aims to combine the characteristics of traditional precious metals with the innovation of decentralized technologies. While it shares a name with Bitcoin, often referred to as “digital gold” due to its perception as a store of value, DIGITAL GOLD is a separate token designed to create a unique ecosystem within the Web3 landscape. Its goal is to position itself as a viable alternative digital asset, although specifics regarding its applications and functionalities are still developing. What is DIGITAL GOLD ($BITCOIN)? DIGITAL GOLD ($BITCOIN) is a cryptocurrency token explicitly designed for use on the Solana blockchain. In contrast to Bitcoin, which provides a widely recognized value storage role, this token appears to focus on broader applications and characteristics. Notable aspects include: Blockchain Infrastructure: The token is built on the Solana blockchain, known for its capacity to handle high-speed and low-cost transactions. Supply Dynamics: DIGITAL GOLD has a maximum supply capped at 100 quadrillion tokens (100P $BITCOIN), although details regarding its circulating supply are currently undisclosed. Utility: While precise functionalities are not explicitly outlined, there are indications that the token could be utilized for various applications, potentially involving decentralized applications (dApps) or asset tokenization strategies. Who is the Creator of DIGITAL GOLD ($BITCOIN)? At present, the identity of the creators and development team behind DIGITAL GOLD ($BITCOIN) remains unknown. This situation is typical among many innovative projects within the blockchain space, particularly those aligning with decentralized finance and meme coin phenomena. While such anonymity may foster a community-driven culture, it intensifies concerns about governance and accountability. Who are the Investors of DIGITAL GOLD ($BITCOIN)? The available information indicates that DIGITAL GOLD ($BITCOIN) does not have any known institutional backers or prominent venture capital investments. The project seems to operate on a peer-to-peer model focused on community support and adoption rather than traditional funding routes. Its activity and liquidity are primarily situated on decentralized exchanges (DEXs), such as PumpSwap, rather than established centralized trading platforms, further highlighting its grassroots approach. How DIGITAL GOLD ($BITCOIN) Works The operational mechanics of DIGITAL GOLD ($BITCOIN) can be elaborated on based on its blockchain design and network attributes: Consensus Mechanism: By leveraging Solana’s unique proof-of-history (PoH) combined with a proof-of-stake (PoS) model, the project ensures efficient transaction validation contributing to the network's high performance. Tokenomics: While specific deflationary mechanisms have not been extensively detailed, the vast maximum token supply implies that it may cater to microtransactions or niche use cases that are still to be defined. Interoperability: There exists the potential for integration with Solana’s broader ecosystem, including various decentralized finance (DeFi) platforms. However, the details regarding specific integrations remain unspecified. Timeline of Key Events Here is a timeline that highlights significant milestones concerning DIGITAL GOLD ($BITCOIN): 2023: The initial deployment of the token occurs on the Solana blockchain, marked by its contract address. 2024: DIGITAL GOLD gains visibility as it becomes available for trading on decentralized exchanges like PumpSwap, allowing users to trade it against SOL. 2025: The project witnesses sporadic trading activity and potential interest in community-led engagements, although no noteworthy partnerships or technical advancements have been documented as of yet. Critical Analysis Strengths Scalability: The underlying Solana infrastructure supports high transaction volumes, which could enhance the utility of $BITCOIN in various transaction scenarios. Accessibility: The potential low trading price per token could attract retail investors, facilitating wider participation due to fractional ownership opportunities. Risks Lack of Transparency: The absence of publicly known backers, developers, or an audit process may yield skepticism regarding the project's sustainability and trustworthiness. Market Volatility: The trading activity is heavily reliant on speculative behavior, which can result in significant price volatility and uncertainty for investors. Conclusion DIGITAL GOLD ($BITCOIN) emerges as an intriguing yet ambiguous project within the rapidly evolving Solana ecosystem. While it attempts to leverage the “digital gold” narrative, its departure from Bitcoin's established role as a store of value underscores the need for a clearer differentiation of its intended utility and governance structure. Future acceptance and adoption will likely depend on addressing the current opacity and defining its operational and economic strategies more explicitly. Note: This report encompasses synthesised information available as of October 2023, and developments may have transpired beyond the research period.

431 Total ViewsPublished 2025.05.13Updated 2025.05.13

What is $BITCOIN

Discussions

Welcome to the HTX Community. Here, you can stay informed about the latest platform developments and gain access to professional market insights. Users' opinions on the price of BTC (BTC) are presented below.

活动图片