Прогноз цены Chainlink (LINK) на 19 августа

cryptonews.ruPublished on 2025-03-17Last updated on 2025-08-18

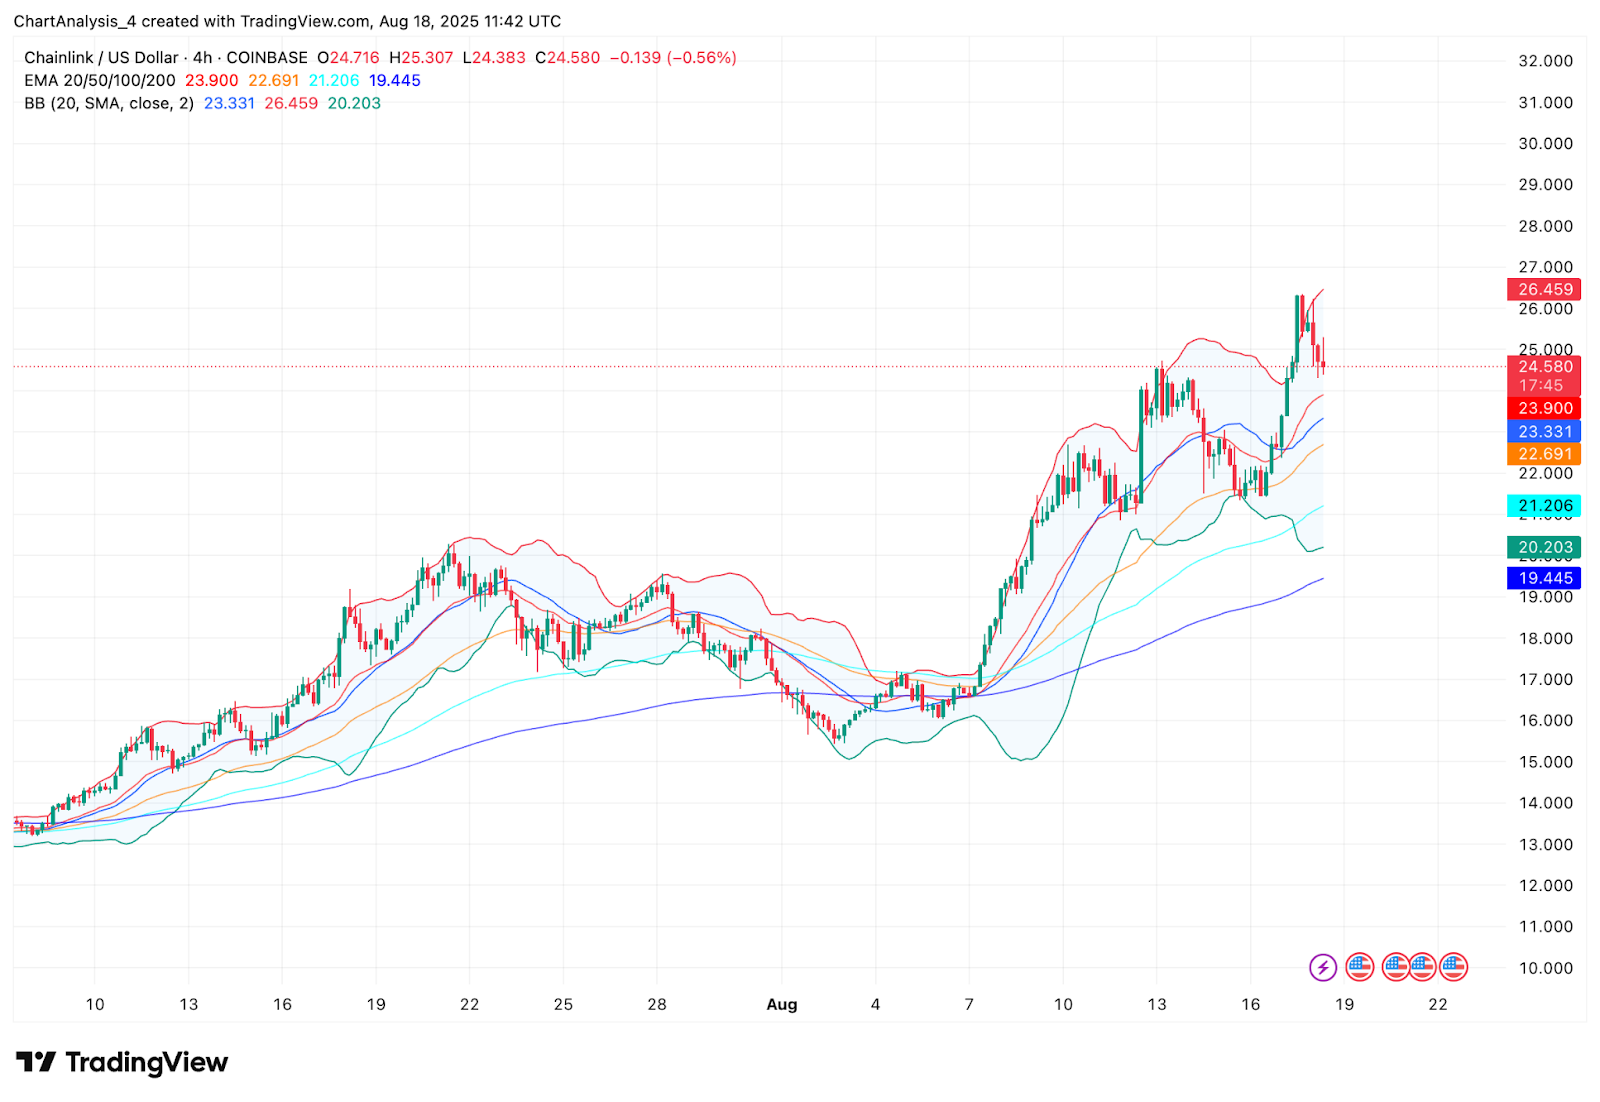
Цена Chainlink сегодня консолидируется около $24,5, снизившись на 4,2% по сравнению с недавним максимумом в $26,2. Отскок от зоны сопротивления $26–$27 спровоцировал краткосрочное давление на продажу, хотя LINK продолжает торговаться выше ключевых динамических уровней поддержки. Поскольку индикаторы импульса и сигналы ликвидности демонстрируют неоднозначную динамику, трейдеры теперь наблюдают, сможет ли LINK защитить свой недавний рост или же скатиться в более глубокую коррекцию.

Таблица прогноза цен Chainlink: 19 августа 2025 г.

Индикатор/Зона Уровень/Сигнал
Цена на цепную связь сегодня $24.5
Сопротивление 1 $25.1
Сопротивление 2 $26.5–$28.0
Поддержка 1 23,9 долл. США (EMA20)
Поддержка 2 22,9 долл. США (коэффициент Фибоначчи 0,618)
Поддержка 3 21,5 долл. США (база ликвидности)
RSI (1H) 46,8 (нейтральный)
VWAP (Сессия) $25.1 (Верхнее сопротивление)
Полосы Боллинджера (4H) Средняя линия — 23,3 доллара, верхняя — 26,4 доллара
ДМИ (14) ADX 30.2, охлаждение тренда
Супертренд (4H) Бычий тренд выше $23,0
Spot Netflow (18 августа) -8,9 млн долларов (давление в распределении)
Уровни Фибоначчи (еженедельные) 0,618 = 22,9 долл. США / 0,786 = 26,4 долл. США

Что происходит с ценой Chainlink?

Динамика цен LINK (Источник: TradingView)

На 4-часовом графике LINK остаётся выше EMA20 на уровне $23,9 и EMA50 на уровне $22,7, что свидетельствует о том, что покупатели по-прежнему сохраняют структурный контроль, несмотря на коррекцию. Цена также колеблется между средней и верхней линиями полос Боллинджера, указывая на фазу охлаждения после сильного роста в начале этой недели.
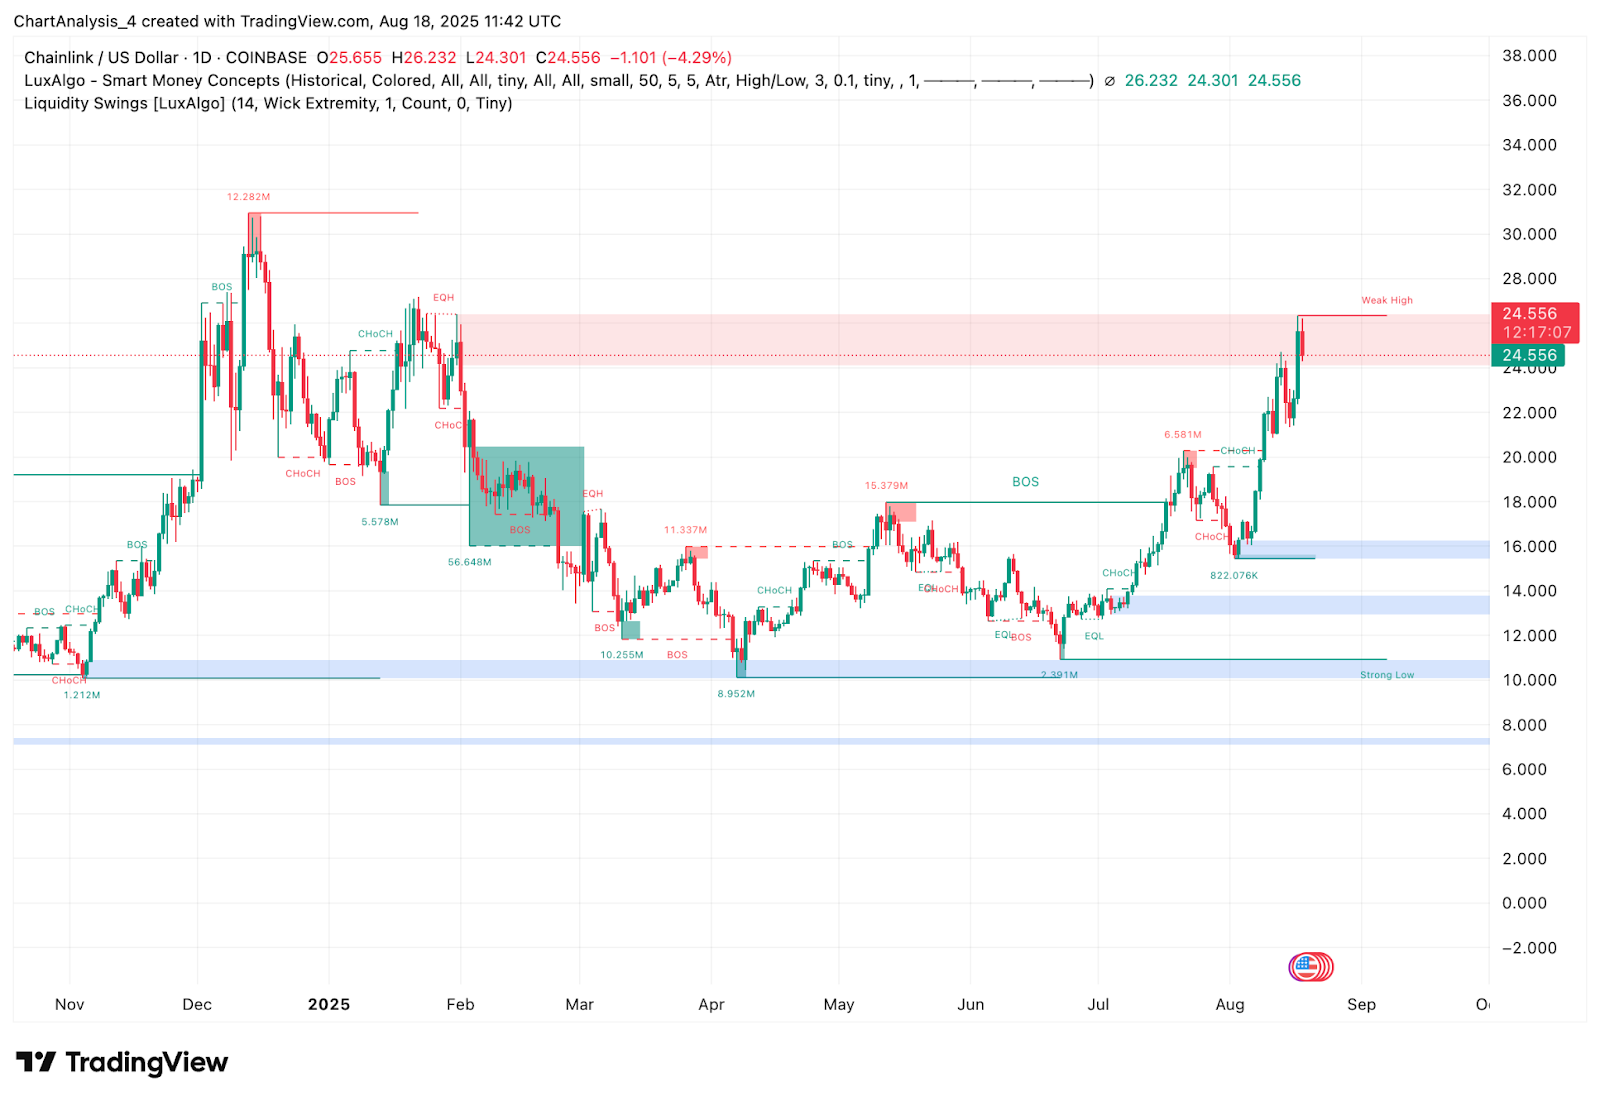
Динамика цен LINK (Источник: TradingView)

Дневной график Smart Money Concepts показывает, что LINK достиг «слабого максимума» ликвидности в районе $26,5, прежде чем откатиться. Это совпадает с исторической зоной предложения с марта, что объясняет резкий откат. Ниже основной кластер ликвидности находится в районе $21–$22, что может послужить сильной защитной базой в случае продолжения продаж.

Почему цена на Chainlink сегодня падает?
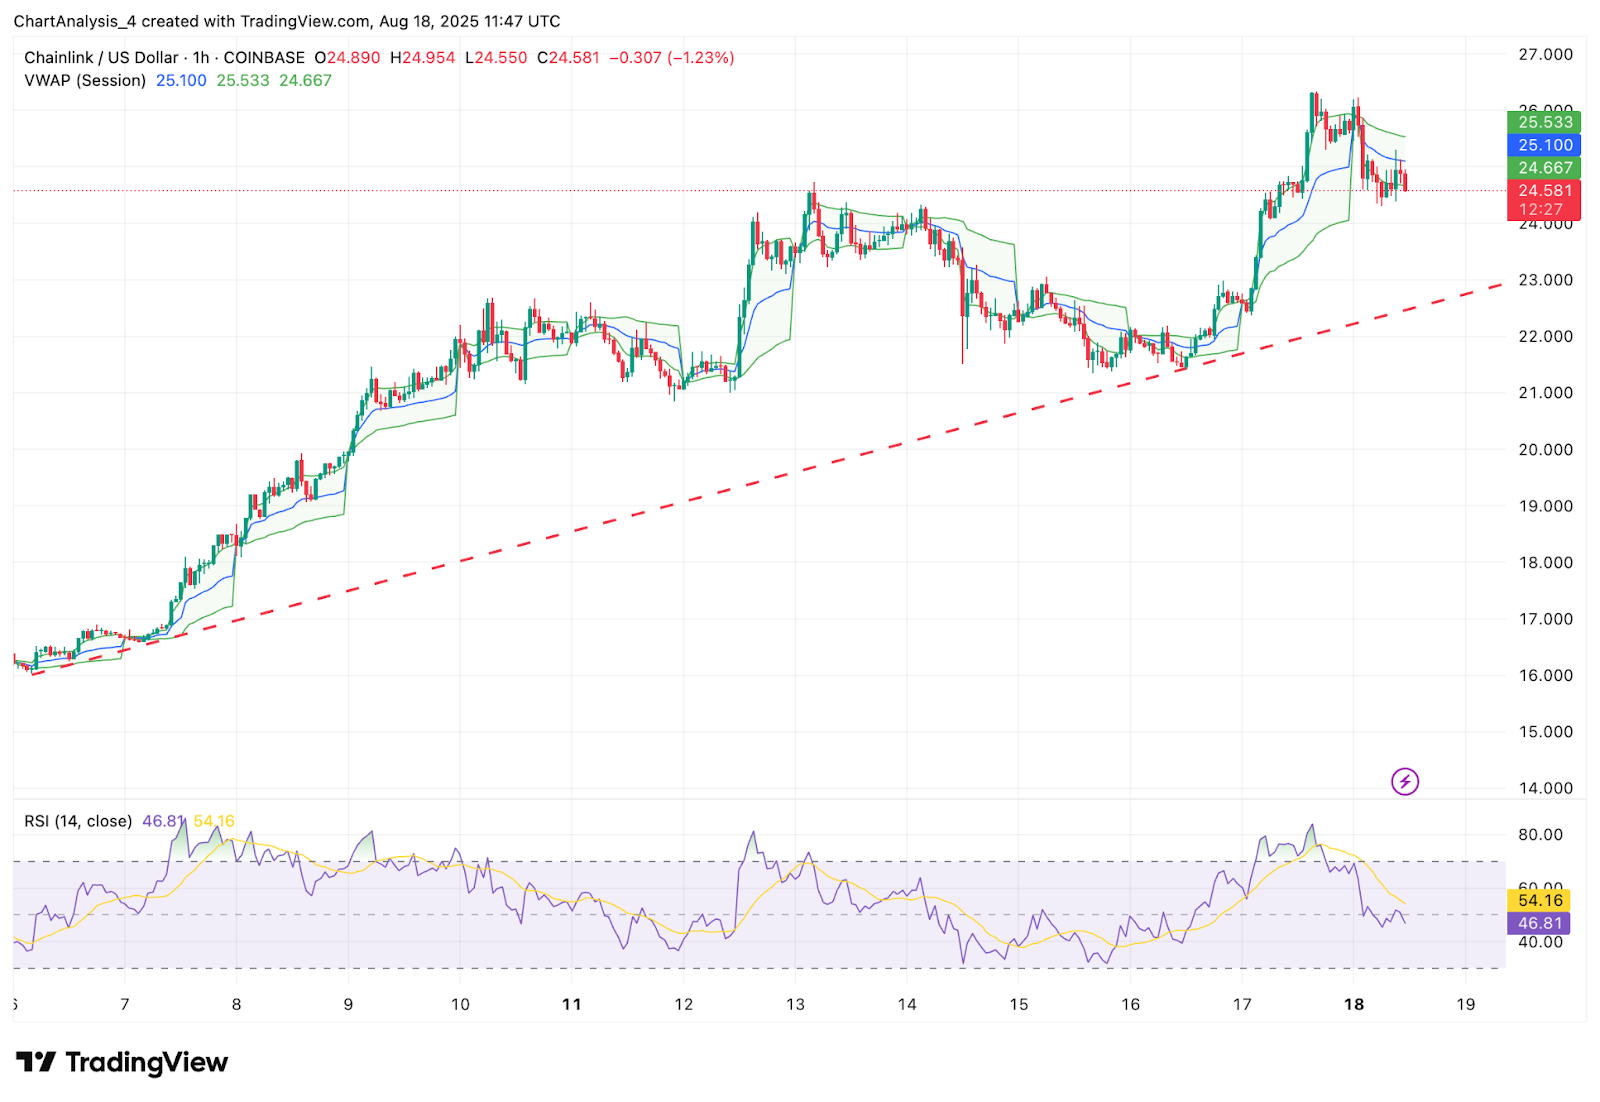
Динамика цен LINK (Источник: TradingView)

Причина снижения цены Chainlink сегодня связана как с техническим истощением, так и с рыночными потоками. На часовом графике RSI опустился до 46 после перекупленности в начале недели, отражая ослабление бычьего импульса. Данные VWAP также показывают консолидацию LINK ниже $25,1, что указывает на снижение внутридневного давления покупателей.
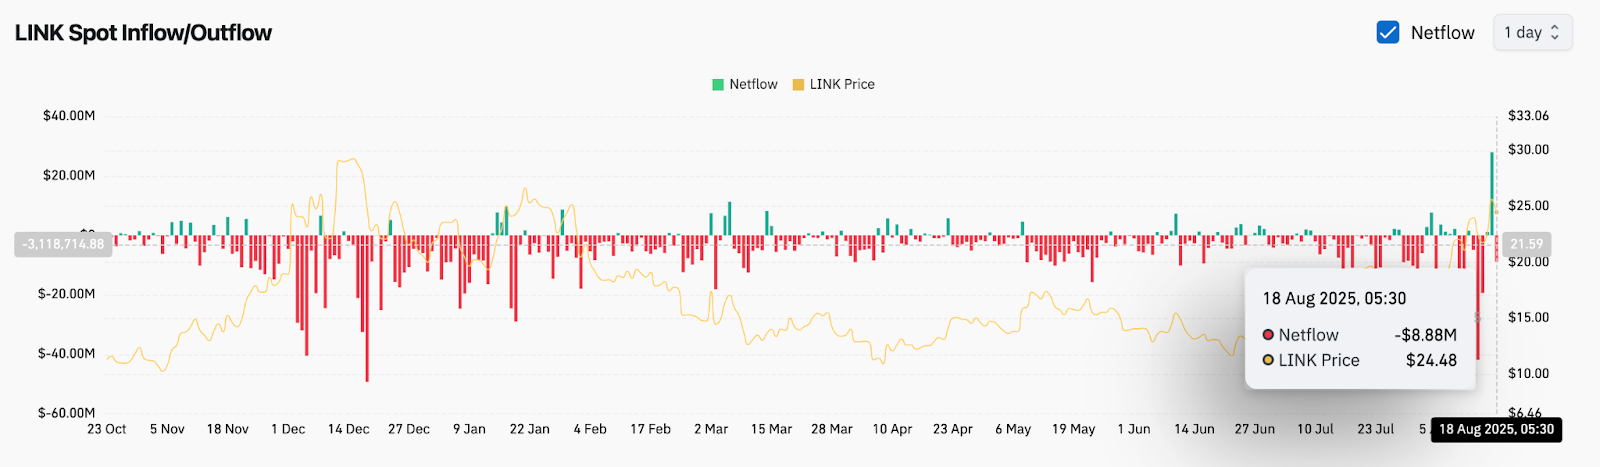
Активность LINK в цепочке (Источник: Coinglass)

18 августа в сети LINK наблюдался отрицательный чистый спотовый поток около -$8,9 млн, что подтверждает умеренное распределение средств инвесторами на более высоких уровнях. Этот отток совпадает с откатом от $26, показывая, что фиксация прибыли в настоящее время перевешивает новое накопление.

Ключевые индикаторы сигнализируют о смешанной динамике
Динамика цен LINK (Источник: TradingView)

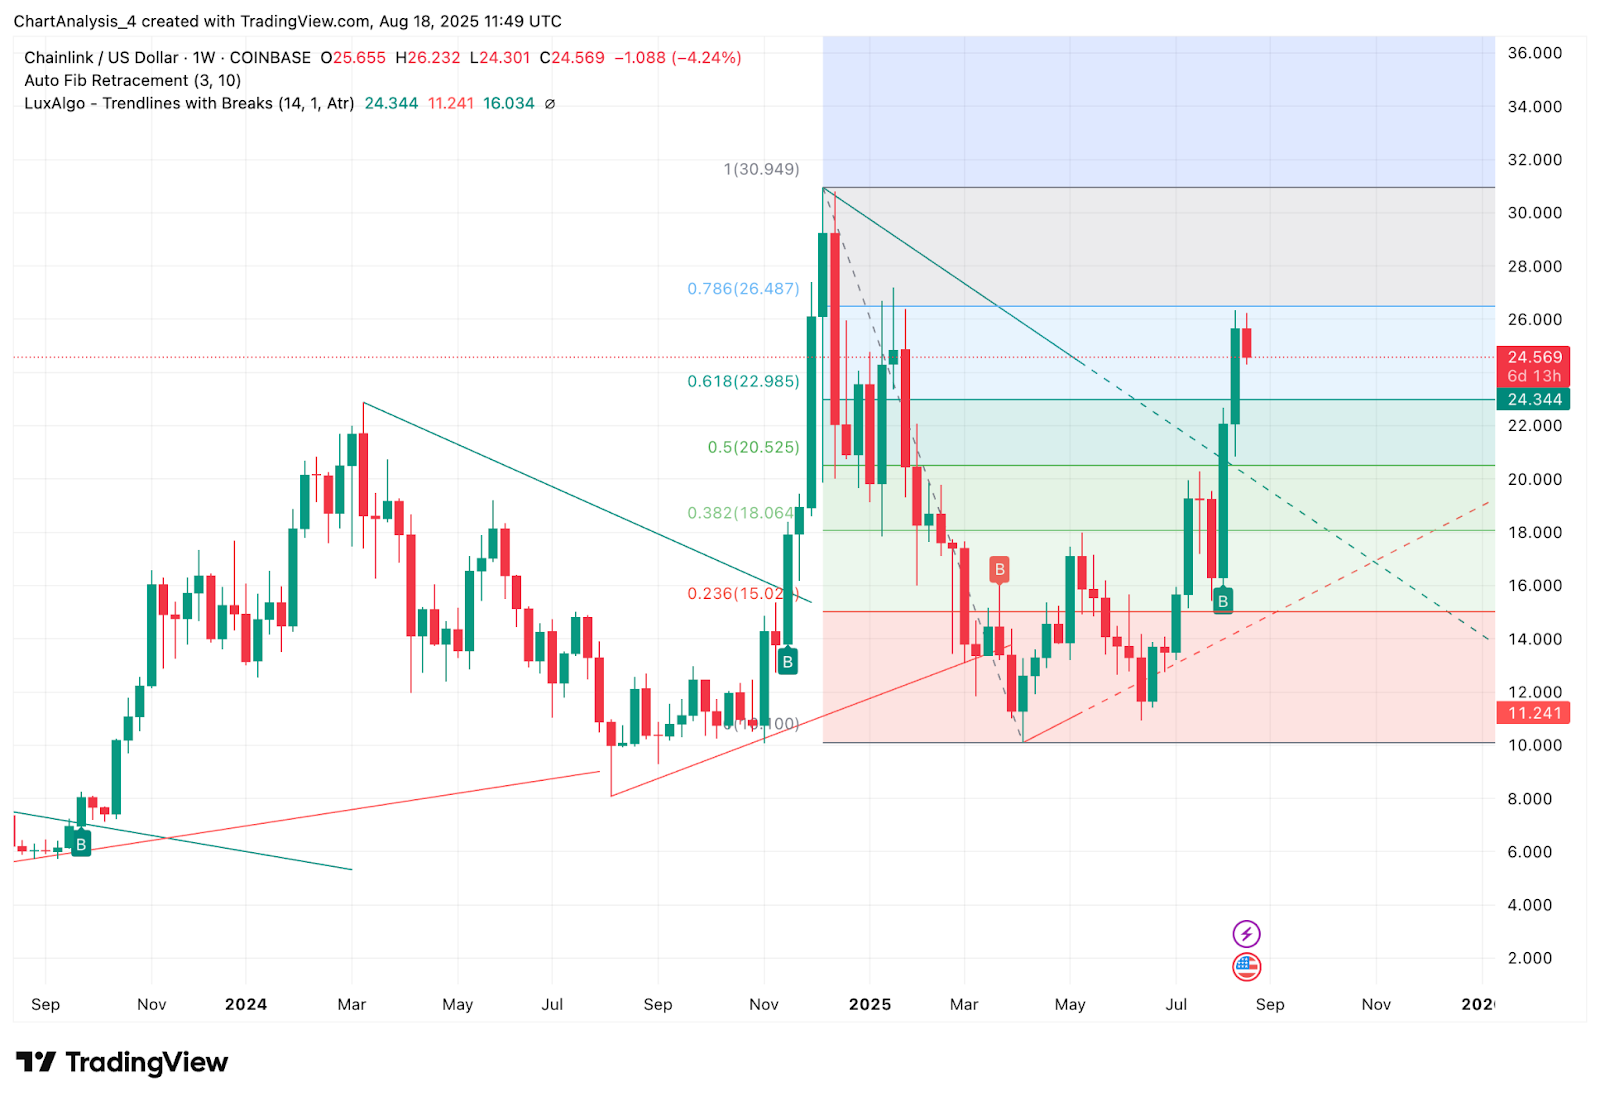
На недельном графике анализ коррекции Фибоначчи показывает, что LINK откатывается от уровня коррекции 0,786 на отметке $26,4, но при этом уверенно держится выше зоны 0,618 на отметке $22,9. Это говорит о том, что общая структура остаётся бычьей, пока цена удерживается выше $23.
Динамика цен LINK (Источник: TradingView)

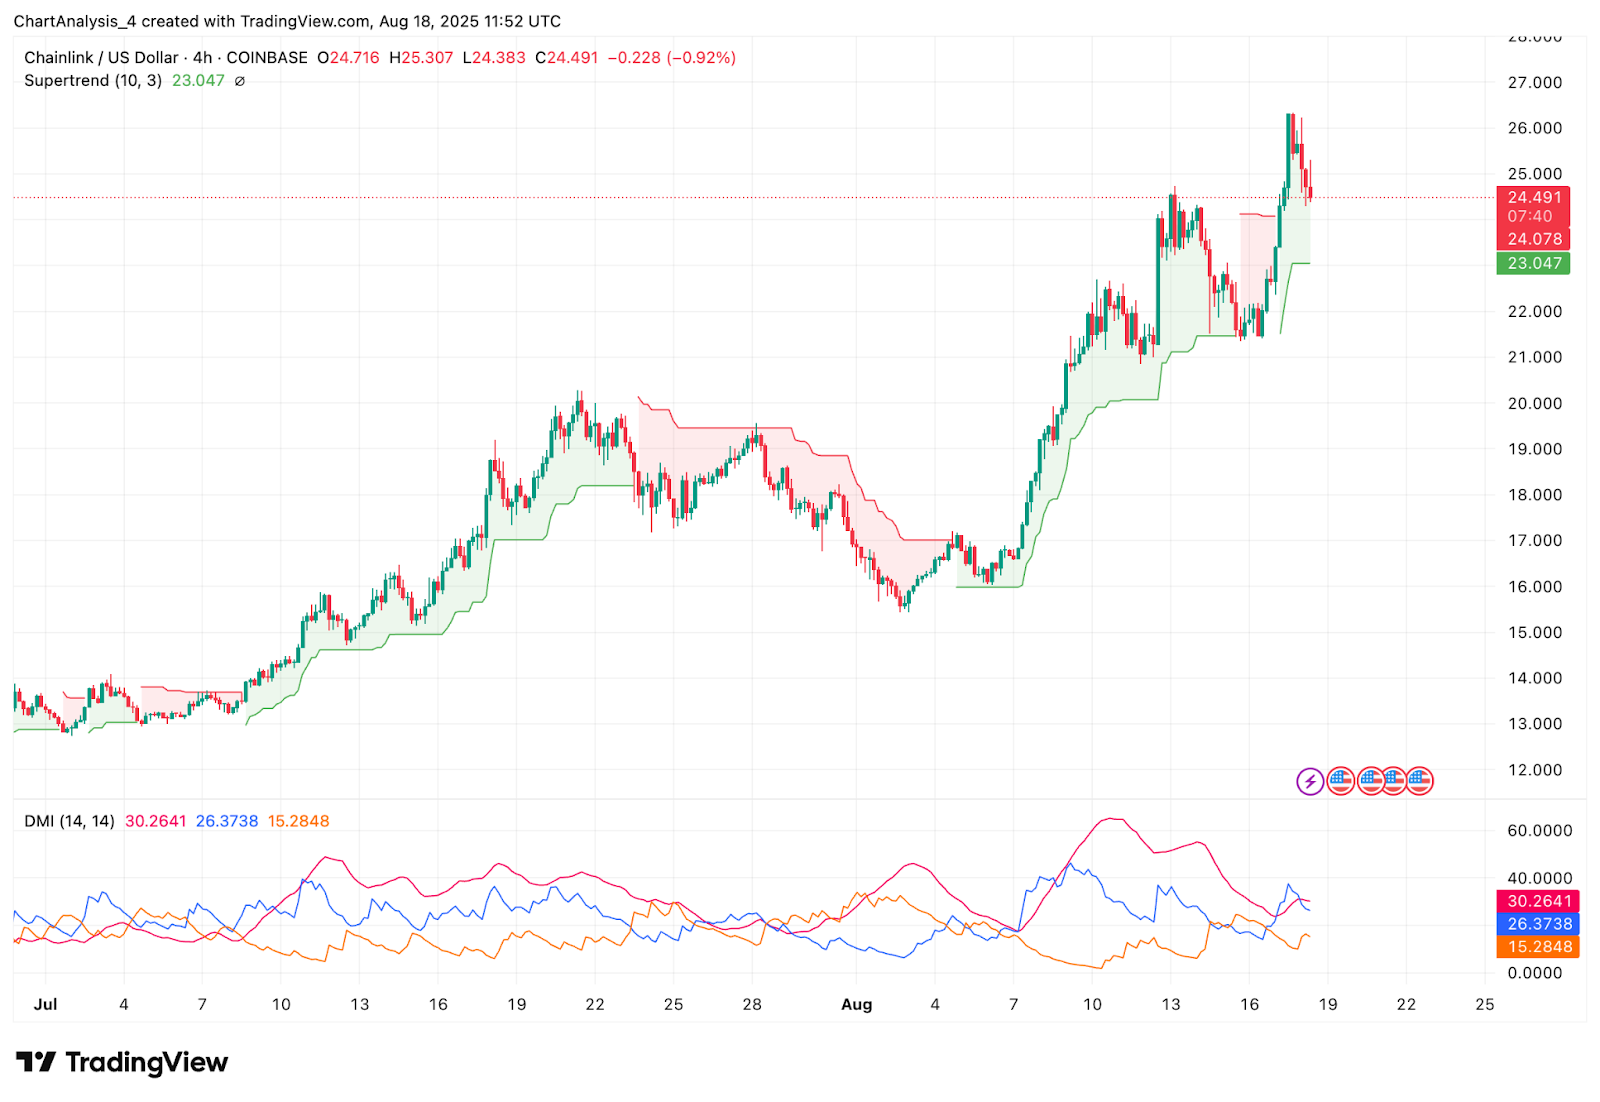
Индикатор Supertrend на 4-часовом графике сохраняет бычий тренд выше $23,0, предлагая краткосрочную поддержку. Между тем, сигналы DMI демонстрируют небольшую потерю направленности: +DI падает против -DI, хотя ADX остаётся высоким около 30, что свидетельствует о том, что LINK всё ещё находится в тренде.

Прогноз цен LINK: краткосрочный прогноз (24 часа)

Если быкам удастся отыграть $25,1 благодаря подтверждению объёма, LINK может повторно протестировать зону сопротивления $26–$26,5. Прорыв этой полосы откроет следующую цель роста в районе $28. Однако, если пара не удержится выше $23,9 (EMA20), существует риск снижения к зоне ликвидности $22,5–$21,5, где, вероятно, появятся новые заявки на покупку.

Учитывая сочетание поддерживающих EMA, затухающего RSI и недавних отрицательных потоков, в ближайшие 24 часа, скорее всего, наступит фаза консолидации с возможными скачками волатильности в диапазоне от 23,5 до 25,5 долларов США.


Trending Cryptos

Related Reads

Arthur Hayes Ten Thousand Words Interview: ETH to $30,000; FLOP Will Surpass ETH

Arthur Hayes Interview Summary: In a wide-ranging interview, Arthur Hayes discusses macroeconomic drivers for crypto, bullish predictions for ETH and BTC, and details his new project, Flop Network. On Macroeconomics & Market Outlook: Hayes argues that unsustainable US debt and potential Yield Curve Control (YCC) will drive massive liquidity into hard assets like Bitcoin. He views recent Treasury bond回购 operations as a key signal, comparing the current environment to the 2008 financial crisis that birthed Bitcoin. He predicts Bitcoin will break its all-time high, reaching around $126,000 by year-end, and could soar to $500,000 if the Fed removes limits on its FEMA repo facility. On Ethereum & Altcoins: Hayes is particularly bullish on ETH, calling it his top large-cap altcoin pick. He believes it will significantly outperform in this cycle, potentially reaching $20,000-$30,000, as it hasn't yet broken its 2021 high unlike other major assets. He values ETH for its established developer community and Lindy effect. On Regulation: He dismisses the US Clarity Act as irrelevant for crypto's core value proposition, stating that macroeconomic liquidity, not regulation, is the primary driver. On Flop Network: Hayes unveils his new project, Flop Network, designed to be a native currency for the AI Agent economy. The core thesis is that AI Agents need a货币 that can be directly converted into compute power (measured in FLOPs - Floating Point Operations). The network will use a "Proof of Useful Inference" consensus where miners earn FLOP tokens for processing AI推理 tasks. It will also provide decentralized storage for AI memory/context. The token will be distributed via a massive airdrop (targeting 20% of the 10-year supply) to early testnet participants and users, with no VC预售 or public sale. Mainnet is slated for Q1 2025. Hayes believes FLOP has a "binary" outcome: it could become the base money for the AI economy and rival Bitcoin, or it could fail.

Odaily星球日报20m ago

Arthur Hayes Ten Thousand Words Interview: ETH to $30,000; FLOP Will Surpass ETH

Odaily星球日报20m ago

Goldman Sachs Research Report Analysis: Samsung Electronics' Shareholder Returns Fall Short of Expectations, FCF Expansion Supports Valuation Recovery

Gold Sachs research report analysis indicates Samsung Electronics' announced shareholder return pool for 2026 (projected 90-110 trillion KRW) fell short of market expectations for a larger one-time payout. However, Goldman emphasizes that sustained Free Cash Flow (FCF) expansion and a stable, phased return mechanism are the true drivers for valuation repair, not a single event. The report maintains a Buy rating on Samsung ordinary shares with a 740,000 KRW target price, implying 74% upside. Samsung plans a ~30 trillion KRW dividend in Q3 2024, with the remaining returns from the 2026 pool executed post-January 2027 earnings via dividends and share buybacks/cancellations. Goldman estimates 2024-2026 cumulative FCF at ~270 trillion KRW. Assuming a 50% return ratio, total shareholder returns would be ~135 trillion KRW. After accounting for 2024-2025 payouts, the 2026 return is estimated near 106 trillion KRW, at the high end of guidance. While Samsung's short-term return scale lags peers like SK Hynix, its future return capacity is underpinned by robust FCF growth from memory and HBM businesses. Goldman forecasts FCF will significantly rise in 2027-2028, potentially boosting annual return pools to 179 trillion and 232 trillion KRW respectively under the existing policy, potentially matching or exceeding peers. Samsung's current valuation (1.7x P/B for 2027) is seen as attractive given high ROE projections (40%-50%). The core thesis is that Samsung's shareholder return story represents a structural improvement based on durable cash flow generation, not a one-time event.

marsbit27m ago

Goldman Sachs Research Report Analysis: Samsung Electronics' Shareholder Returns Fall Short of Expectations, FCF Expansion Supports Valuation Recovery

marsbit27m ago

Trading

Spot

Hot Articles

How to Buy LINK

Welcome to HTX.com! We've made purchasing ChainLink (LINK) simple and convenient. Follow our step-by-step guide to embark on your crypto journey.Step 1: Create Your HTX AccountUse your email or phone number to sign up for a free account on HTX. Experience a hassle-free registration journey and unlock all features.Get My AccountStep 2: Go to Buy Crypto and Choose Your Payment MethodCredit/Debit Card: Use your Visa or Mastercard to buy ChainLink (LINK) instantly.Balance: Use funds from your HTX account balance to trade seamlessly.Third Parties: We've added popular payment methods such as Google Pay and Apple Pay to enhance convenience.P2P: Trade directly with other users on HTX.Over-the-Counter (OTC): We offer tailor-made services and competitive exchange rates for traders.Step 3: Store Your ChainLink (LINK)After purchasing your ChainLink (LINK), store it in your HTX account. Alternatively, you can send it elsewhere via blockchain transfer or use it to trade other cryptocurrencies.Step 4: Trade ChainLink (LINK)Easily trade ChainLink (LINK) on HTX's spot market. Simply access your account, select your trading pair, execute your trades, and monitor in real-time. We offer a user-friendly experience for both beginners and seasoned traders.

10.4k Total ViewsPublished 2024.03.29Updated 2026.06.02

How to Buy LINK

Discussions

Welcome to the HTX Community. Here, you can stay informed about the latest platform developments and gain access to professional market insights. Users' opinions on the price of LINK (LINK) are presented below.

活动图片