Cardano (ADA) Price Prediction 2025, 2026-2030

TheNewsCryptoPublished on 2025-05-24Last updated on 2025-05-26

Abstract

If the market momentum and investors’ sentiment positively elevate, then Cardano (ADA) might hit $5. Furthermore, with future upgrades and advancements in the Cardano ecosystem, ADA might surpass its current all-time high (ATH) of $3.10 and mark its new ATH. 

  • Bullish ADA price prediction for 2025 is $1.3564 to $3.0711.
  • Cardano (ADA) price might reach $5 soon.
  • Bearish ADA price prediction for 2025 is $0.2410.

In this Cardano (ADA) price prediction 2025, 2026-2030,  we will analyze the price patterns of ADA by using accurate trader-friendly technical analysis indicators and predict the future movement of the cryptocurrency.


TABLE OF CONTENTSINTRODUCTION

  • Cardano (ADA) Current Market Status
  • What is Cardano (ADA)?
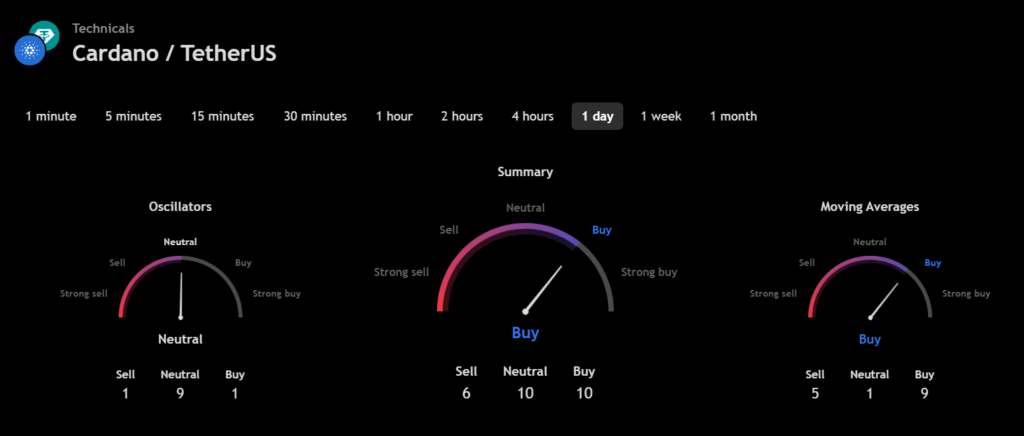
  • Cardano (ADA) 24H Technicals

CARDANO (ADA) PRICE PREDICTION 2025

  • Cardano (ADA) Support and Resistance Levels
  • Cardano (ADA) Price Prediction 2025 — RVOL, MA, and RSI
  • Cardano (ADA) Price Prediction 2025 — ADX, RVI
  • Comparison of ADA with BTC, ETH

CARDANO (ADA) PRICE PREDICTION 2025, 2026-2030CONCLUSIONFAQ Cardano (ADA) Current Market Status


Current Price $0.7624 24 – Hour Price Change 3.73% Down 24 – Hour Trading Volume $1.11B Market Cap $26.93B Circulating Supply 35.31B ADA All – Time High $3.10 (On Sep 02, 2021)   All – Time Low $0.01735 (On Oct 02, 2017)   ADA Current Market Status (Source: CoinMarketCap) What is Cardano (ADA)


TICKERADABLOCKCHAINCardano blockchainCATEGORYPublic blockchain platformLAUNCHED ONSeptember 2017UTILITIESGovernance, Fast Transactions, gas fees & rewards Cardano (ADA) is the native token of the Cardano blockchain. This sustainable blockchain uses the Proof-of-Stake (PoS) consensus mechanism, Ouroborus. This “third-generation blockchain” initially existed as a layer-1 solution. Eventually, the layer-2 update, Hydra, was integrated into the existing network in late 2021.


Cardano has been built as an upgraded version of Ethereum’s smart contract network. Moreover, it aims to scale the permissionless nature of the DeFi space and aid the mission of banking the unbanked.
Cardano 24H Technicals
(Source: TradingView)


Cardano (ADA) Price Prediction 2025


Cardano (ADA) ranks 9th on CoinMarketCap in terms of its market capitalization. The overview of the Cardano price prediction for 2025 is explained below with a daily time frame.

ADA/USDT Horizontal Channel Pattern (Source: TradingView)


In the above chart, Cardano (ADA) laid out a Horizontal Channel pattern. A horizontal channel or sideways trend has the appearance of a rectangle pattern. It consists of at least four contract points. This is because it needs at least two lows to connect, as well as two highs. Horizontal channels provide a clear and systematic way to trade by providing buy and sell points. 


The longer the horizontal channel, the stronger the exit movement will be. There is frequently a price on the channel after exit. The exit often occurs at the fourth contact point on one of the horizontal channel’s lines.


At the time of analysis, the price of Cardano (ADA) was recorded at $0.763. If the pattern trend continues, then the price of ADA might reach the resistance levels of $1.2663 and $6.3188. If the trend reverses, then the price of ADA may fall to the support levels of $0.5435 and $0.2389.


Cardano (ADA) Resistance and Support Levels


The chart given below elucidates the possible resistance and support levels of Cardano (ADA) in 2025.

ADA/USDT Resistance and Support Levels (Source: TradingView)


From the above chart, we can analyze and identify the following as resistance and support levels of Cardano (ADA) for 2025.


Resistance Level 1$1.3564Resistance Level 2$3.0711Support Level 1$0.5144Support Level 2$0.2410ADA Resistance & Support Levels Cardano (ADA) Price Prediction 2025 — RVOL, MA, and RSI


The technical analysis indicators such as Relative Volume (RVOL), Moving Average (MA), and Relative Strength Index (RSI) of Bitcoin (ADA) are shown in the chart below.

ADA/USDT RVOL, MA, RSI (Source: TradingView)


From the readings on the chart above, we can make the following inferences regarding the current Cardano (ADA) market in 2025.


INDICATORPURPOSEREADINGINFERENCE50-Day Moving Average (50MA)Nature of the current trend by comparing the average price over 50 days50 MA = $0.6984


Price = $0.7588
(50MA < Price)Bullish/UptrendRelative Strength Index (RSI)Magnitude of price change;Analyzing oversold & overbought conditions51.3368
<30 = Oversold
50-70 = Neutral
>70 = OverboughtNeutralRelative Volume (RVOL)Asset’s trading volume in relation to its recent average volumesBelow cutoff lineWeak volume Cardano (ADA) Price Prediction 2025 — ADX, RVI


In the below chart, we analyze the strength and volatility of Cardano (ADA) using the following technical analysis indicators — Average Directional Index (ADX) and Relative Volatility Index (RVI).

ADA/USDT ADX, RVI (Source: TradingView)


From the readings on the chart above, we can make the following inferences regarding the price momentum of Cardano (ADA).


INDICATORPURPOSEREADINGINFERENCEAverage Directional Index (ADX)Strength of the trend momentum25.5001Strong TrendRelative Volatility Index (RVI)Volatility over a specific period55.76
<50 = Low
>50 = HighHigh volatility Comparison of ADA with BTC, ETH


Let us now compare the price movements of Cardano (ADA) with those of Bitcoin (BTC) and Ethereum (ETH).

BTC Vs ETH Vs ADA Price Comparison (Source: TradingView)


From the above chart, we can interpret that the price action of ADA is similar to that of BTC and ETH. That is, when the price of BTC and ETH increases or decreases, the price of ADA also increases or decreases, respectively.


Cardano (ADA) Price Prediction 2026, 2027 – 2030


With the help of the aforementioned technical analysis indicators and trend patterns, let us predict the price of Cardano (ADA) between 2026, 2027, 2028, 2029, and 2030.
Year Bullish Price Bearish PriceCardano (ADA) Price Prediction 2026$5.5$0.2Cardano (ADA) Price Prediction 2027$6$0.1Cardano (ADA) Price Prediction 2028$6.5$0.09Cardano (ADA) Price Prediction 2029$7$0.08Cardano (ADA) Price Prediction 2030$7.5$0.07 Conclusion


If Cardano (ADA) establishes itself as a good investment in 2025, this year would be favorable to the cryptocurrency. In conclusion, the bullish Cardano (ADA) price prediction for 2025 is $3.0711. Comparatively, if unfavorable sentiment is triggered, the bearish Cardano (ADA) price prediction for 2025 is $0.2410. 


If the market momentum and investors’ sentiment positively elevate, then Cardano (ADA) might hit $5. Furthermore, with future upgrades and advancements in the Cardano ecosystem, ADA might surpass its current all-time high (ATH) of $3.10 and mark its new ATH. 

Trending Cryptos

Related Reads

Crypto 美股观察:CRCL、HOOD、COIN 与 MSTR,最近在交易什么?

Recent weeks have seen significant developments for four key US-listed crypto-related stocks—Circle (CRCL), Robinhood (HOOD), Coinbase (COIN), and MicroStrategy (MSTR)—with their core investment theses diverging. For **Circle (CRCL)**, its stock price is increasingly realigning with the fundamental driver of **USDC circulation**. After IPO exuberance faded, CRCL's performance now correlates closely with changes in USDC supply, which is heavily influenced by DeFi activity and risk appetite. The recent contraction in USDC, linked to events like the KelpDAO incident, has pressured the stock. A sustainable recovery signal for CRCL would require a confluence of recovering DeFi TVL, stablecoin demand, and consecutive weeks of USDC net issuance. **Robinhood (HOOD)** gained market attention with the launch of its **Robinhood Chain**, an Ethereum L2. While not an immediate threat to Coinbase's dominant Base network in terms of scale or developer ecosystem, it represents a strategic encroachment. Robinhood's path—leveraging its traditional retail brokerage user base and assets to build a chain-based financial system—challenges Coinbase's narrative as the sole listed company integrating crypto-native infrastructure with traditional finance. This could dilute COIN's long-term scarcity premium. **MicroStrategy (MSTR)** made a notable shift by **selling Bitcoin** for the first time in a meaningful way (3,588 BTC), breaking its long-standing "buy-only" posture. The sales, used to fund dividends and replenish USD reserves, signal a move towards active capital management. While not indicative of a bearish turn on Bitcoin, it introduces new complexity for MSTR investors. The stock must now be evaluated not just as a leveraged Bitcoin proxy, but also considering fixed cash obligations from preferred dividends and debt, alongside its capital allocation strategy between holding BTC and maintaining liquidity. In summary, the investment narratives for these stocks are evolving beyond simple crypto market beta. Key variables now include stablecoin fundamentals, competition in chain-based financial ecosystems, and the balance between asset accumulation and corporate capital structure management.

marsbit2m ago

Crypto 美股观察:CRCL、HOOD、COIN 与 MSTR,最近在交易什么?

marsbit2m ago

Behind Robinhood's Launch of Its Own Chain, the Beautifully Packaged "Tokenized Stocks" Still Have No Equity Rights

Robinhood has launched "Robinhood Chain," an Ethereum-based Layer 2 built with Arbitrum technology, and introduced "Stock Tokens." This article clarifies that these tokens are not actual on-chain equity. They are tokenized debt securities issued by Robinhood Assets Jersey Limited, offering economic exposure to reference stocks or ETFs but lacking direct ownership, voting rights, or other shareholder privileges. The legal structure is conservative, relying on traditional financial intermediaries, custody, KYC/AML controls, and specific jurisdiction rules, even though the tokens are transferable on-chain. The move is part of Robinhood's broader strategy to evolve from a retail brokerage into a global financial ecosystem, integrating services like banking, retirement, crypto, and DeFi. Robinhood Chain aims to provide a programmable settlement layer, making financial products more portable and accessible while masking underlying complexity. However, the "brokerage chain paradox" lies in balancing a simple user interface with the intricate, regulated reality of the wrapped assets. The success of this model depends on users and regulators accepting this structured approach without misunderstanding the tokens as direct stock ownership. Key components supporting this strategy include the Bitstamp acquisition (expanding institutional crypto capabilities), the Robinhood Wallet (bridging brokerage and self-custody), the Robinhood Earn program (integrating DeFi lending), and the Lighter perpetual contracts platform. While ambitious, the initiative is still early, facing challenges in achieving liquidity, developer adoption, and regulatory clarity across jurisdictions.

marsbit1h ago

Behind Robinhood's Launch of Its Own Chain, the Beautifully Packaged "Tokenized Stocks" Still Have No Equity Rights

marsbit1h ago

Strategy's Accounting Gimmick: The Cap on BTC Sales Far Exceeds $1.25 Billion

The article, originally from Bankless, discusses how MicroStrategy's (MSTR) recent Bitcoin (BTC) sales reveal a much larger potential selling capacity than the widely reported $1.25 billion "reserve-building" cap. On July 7, MicroStrategy disclosed a sale of 3,588 BTC (~$216M) to pay dividends for its STRAT (STRC) preferred shares and replenish its USD Reserve. Crucially, the company stated this sale did not count against its stated $1.25 billion "reserve-building capacity." The analysis explains that MicroStrategy's "BTC Monetization Plan," part of its broader "Digital Credit Capital Framework," actually outlines three main purposes for selling BTC, only one of which has the $1.25B cap: 1. **Building the USD Reserve** (capped at $1.25B). 2. **Covering preferred share/ debt costs** (replenishing the reserve after payments). 3. **Funding buybacks** (up to $10B for preferred shares and $10B for MSTR common stock). The key nuance is the accounting distinction between "building" the reserve (selling BTC before making payments) and "replenishing" it (selling BTC after using reserve funds for payments). While functionally the same—converting BTC to cash for obligations—only "building" counts against the publicized $1.25B limit. This means sales for "replenishing" and the $20B+ buyback pool allow for total potential sales exceeding $30B. The article frames this as part of MicroStrategy's shift from a simple "buy and hold" Bitcoin narrative to an "active capital management" model, where BTC becomes a balance-sheet tool to manage pressures between its common stock, preferred shares, dollar reserve, and Bitcoin holdings. This creates complex trade-offs and potential conflicts of interest. The conclusion warns investors that the $1.25B figure is not a total sales ceiling. Understanding terms like "build," "replenish," and "repurchase" in MicroStrategy's disclosures is now critical, as the company navigates a new, more complex role as an actively managed entity rather than a passive Bitcoin accumulator.

Odaily星球日报1h ago

Strategy's Accounting Gimmick: The Cap on BTC Sales Far Exceeds $1.25 Billion

Odaily星球日报1h ago

Trading

Spot

Hot Articles

Discussions

Welcome to the HTX Community. Here, you can stay informed about the latest platform developments and gain access to professional market insights. Users' opinions on the price of ADA (ADA) are presented below.

活动图片