Solana [SOL] is no stranger to volatility, and paying attention to Open Interest can provide a roadmap for navigating those wild price swings.
A recent 3-day OI heatmap has uncovered two key levels in the sand: $190 and $199. These levels are shaping up to be pivotal, with $190 acting as strong support and $199 evolving into a potential pivot zone.
A closer look at how these zones could influence SOL’s price action in the near term can help traders spot the next big move.
Solana: Key levels revealed
Solana’s Open Interest heatmap for the past three days highlighted two critical levels that traders should monitor closely. The $190 level has emerged as a strong support zone, marked by a high concentration of OI activity.
This level has consistently attracted buyers, preventing further price declines.
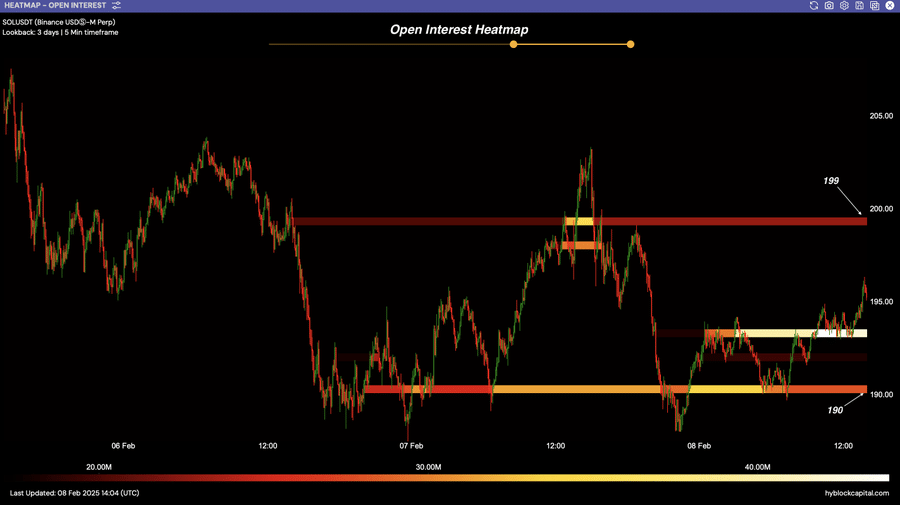
On the upside, $199 initially served as formidable resistance, with OI clusters indicating a buildup of sell orders. The data showed repeated rejections around this level, suggesting a battle between bulls and bears.
However, with SOL recently breaking above $199, this level may now flip into a support zone, depending on the strength of the breakout and subsequent trading volume.
The intensity of OI between $190 and $199 suggests that any breakout could lead to a significant price movement.
With OI volumes peaking near $40 million during the test of $199, market watchers should look for potential liquidity shifts that could signal Solana’s next directional move.
Potential market reactions
The $190 level is emerging as a strong support zone, backed by significant OI accumulation. This clustering of OI suggests increased buying activity, with traders eyeing it as a key entry point.
Historically, Solana has shown solid rebounds from similar levels, hinting at the potential for a bounce if buyer momentum holds steady.
However, if this support fails to hold, it could trigger a retest of lower levels, potentially sparking sell-offs from leveraged positions.
On the flip side, the $199 level, now evolving into a pivot zone, marks a critical point for traders. Initially acting as resistance, its breach suggests bullish momentum may be taking hold.
If $199 sustains as support, it could act as a launchpad for a move toward $205 or beyond.
Conversely, a failure to maintain this level could signal a fakeout, increasing the likelihood of consolidation or a pullback toward the $190 support level.
Leveraging OI and price data for better trades
With the price at $201 at press time, Solana has breached the earlier identified resistance at $199. This breakout suggests potential bullish momentum, but traders should tread carefully.
The $199 level, previously a resistance zone, could now flip into support if the breakout sustains.
Leveraging OI data, traders can monitor for spikes in OI at higher levels, such as $205, to anticipate further resistance or profit-taking zones.
Conversely, if SOL slips below $199, it could signal a fakeout, increasing the likelihood of revisiting the $190 support level.
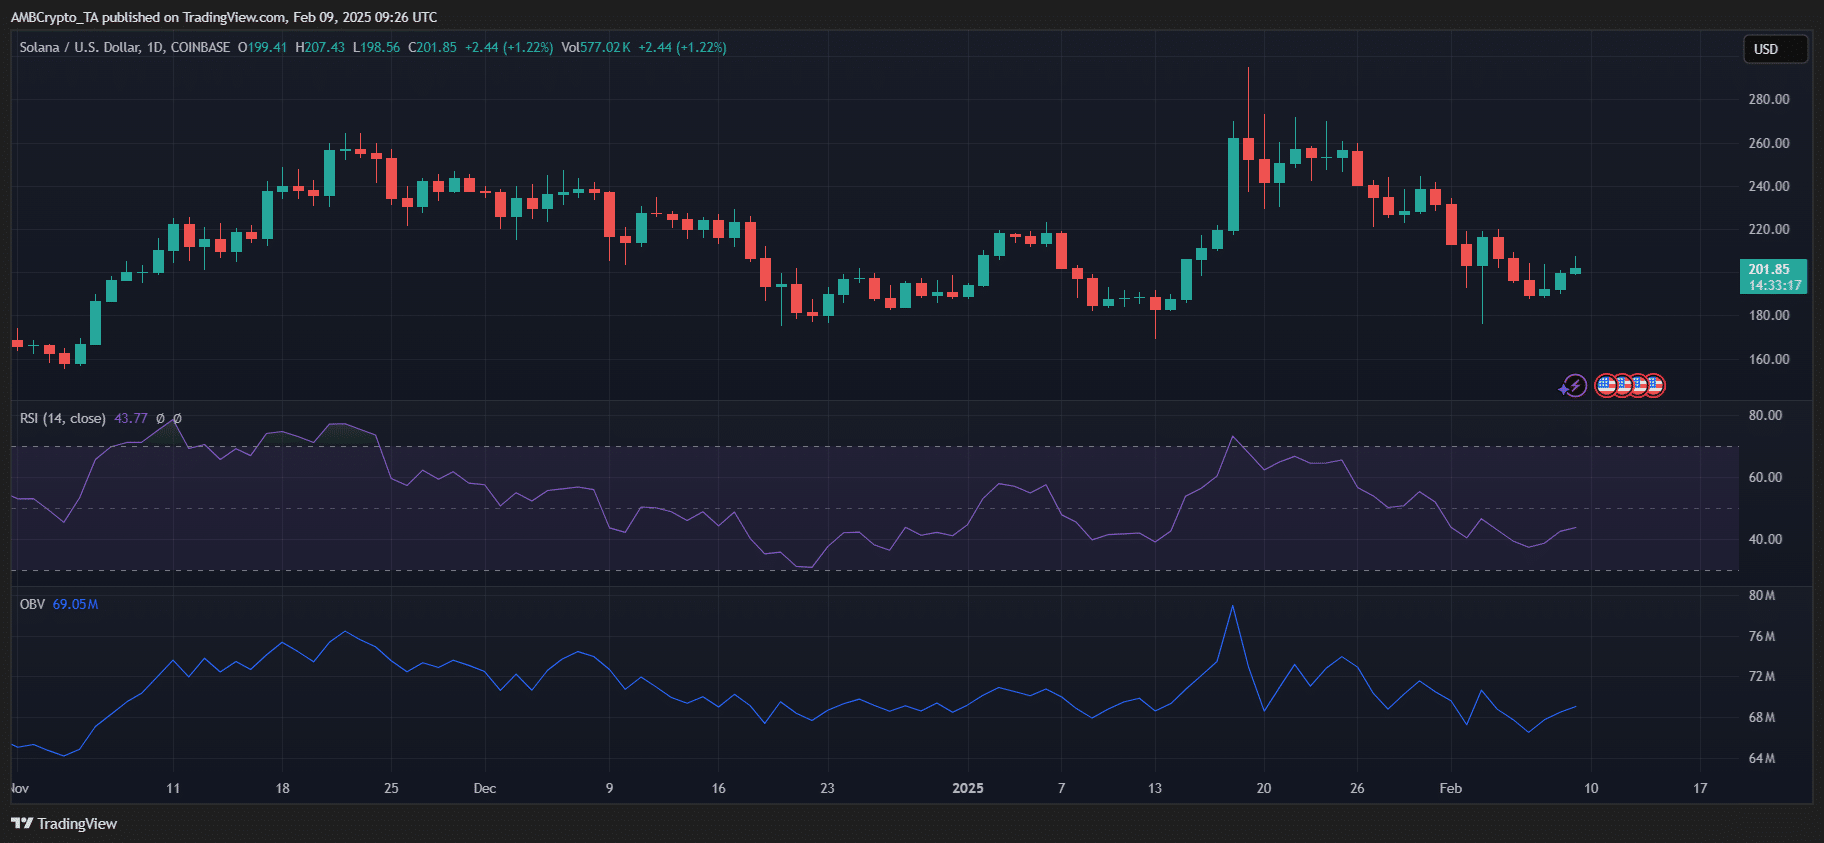
The RSI was 43.77 at press time, reflecting mildly bearish momentum. However, the OBV at 69.05M suggested steady interest.
The price action indicate a potential rally continuation if trading volumes increase above $201. Traders should watch for consolidation above $199 to validate bullish strength and prepare for further price movements.