Glassnode Expands ERC-20 Token Support: Pioneering On-Chain Analysis for the Ethereum Ecosystem

insights.glassnodePublished on 2024-09-16Last updated on 2024-09-17

We are excited to announce that our analytics platform now supports more than 500 new ERC-20 tokens. This major expansion reinforces Glassnode's commitment to providing the highest quality data and most innovative analysis tools for both Bitcoin and Ethereum markets.

You can access the full list of supported tokens here.

Solidifying Our Leadership in On-Chain Analytics

For years, Glassnode has been the leader in on-chain analytics for Bitcoin, offering fresh insights into the market dynamics that drive the world's first and largest cryptocurrency. Now, we are extending that leadership to the Ethereum ecosystem. With the addition of 500+ ERC-20 tokens, our users can now apply the same depth of analysis to Ethereum-based assets as they do to Bitcoin.

This release includes a wide range of popular and emerging tokens, spanning various sectors. Whether you're interested in well-established DeFi projects, innovative AI-driven tokens, or the latest trends in staking, Glassnode now provides the tools to analyze these assets with the same rigor you expect for Bitcoin.

Enabling In-Depth Analysis with Enhanced Metric Coverage

With the expansion of our ERC-20 token support, we are enabling some of our most popular metrics across these new assets, categorized into key areas for comprehensive market analysis:

  • Asset Fundamentals: Track the health and underlying value of assets with metrics such as Active Addresses, New Addresses, Market Cap, Price, Circulating Supply, Supply in Smart Contracts, and Supply of Top 1% Addresses.
  • Capital Flows: Gain insights into the movement of assets across the network and exchanges with Transfer Volume (Total, Median, Mean), Transfer Count, Exchange Balances, Netflows, and more.
  • Profit and Loss Data: Analyze sentiment, financial outcomes and investor performance using SOPR (Spent Output Profit Ratio), MVRV (Market Value to Realized Value), Realized Profit and Loss, and their detailed breakdowns by wallet size, age, and holding period.

This comprehensive metric coverage allows users to analyze a significant portion of the Ethereum ecosystem with unprecedented depth and detail. Whether you're comparing sectors, identifying market cycles, or predicting shifts in momentum, Glassnode's expanded toolkit offers the depth and precision needed for sophisticated analysis.

30 Days of Free Access to ERC-20 Metrics

To celebrate this major expansion, we are excited to announce that all ERC-20-based token metrics will be available for free for the first 30 days. Starting today, this limited-time offer provides our users with a unique opportunity to explore the full potential of our new metrics, test out different strategies, and see firsthand how Glassnode's tools can enhance their market analysis. We encourage everyone to take advantage of this offer to experience the unparalleled depth and quality of our analytics.

Comprehensive Market Analysis, All in One Place

As we continue to evolve and expand our platform, we are making it easier for users to conduct comprehensive market analysis without needing to rely on multiple data providers. Our recent infrastructure upgrade allows us to scale horizontally, quickly integrating more assets and metrics into our platform. This means that investors can now perform detailed analysis of both Bitcoin and Ethereum landscapes from a single, unified platform.

Application Case Study: Applying the Weekly-Monthly Seller Exhaustion Model to ERC-20 Ecosystem

In Q2 of 2024, we incorporated a detailed breakdown of our most popular metrics, focusing on the age of holdings and wallet size distributions, to enhance our understanding of critical market dynamics. This enables our users to make more informed decisions through granular cohort analysis, answering complex questions such as:

  • How do short-term investor actions influence asset valuations, particularly when analyzed over holding periods that range from days to months?
  • Does the concentration of network wealth in larger wallets suggest a market driven by a few influential investors?
  • Are new investors realizing more losses than seasoned holders, indicating potential short-term volatility but also an underlying market strength?

For more information on the Breakdown Metrics, see our product announcement here.

By combining our expanded ERC-20 coverage with the depth provided by the Breakdown Metrics, we can now significantly enhance our clients’ insights into capital flows, asset fundamentals, and market sentiment within the ERC-20 ecosystem.

In this case study, we applied the Weekly-Monthly Seller Exhaustion model to the MATIC token. Seller Exhaustion represents a critical point where most market sellers have exited, allowing us to identify potential local bottoms. This model, previously validated within the Bitcoin market, has now been extended to the ERC-20 universe.

For this analysis, we focused on three key metrics:

  • MVRV Ratio: Measures the unrealized profit or loss held by investors within a specific cohort, helping to assess overall market sentiment.
  • SOPR (Spent Output Profit Ratio): Evaluates the average profit or loss realized by the cohort, providing insight into investor behavior.
  • Realized Loss: Isolates the magnitude of losses realized in USD terms by the cohort, indicating periods of heightened sell-side pressure.

These metrics were selected because they offer complementary insights into market sentiment - MVRV reveals unrealized potential, SOPR uncovers realized actions, and Realized Loss highlights critical sell pressure points.

Click to view in Glassnode Studio

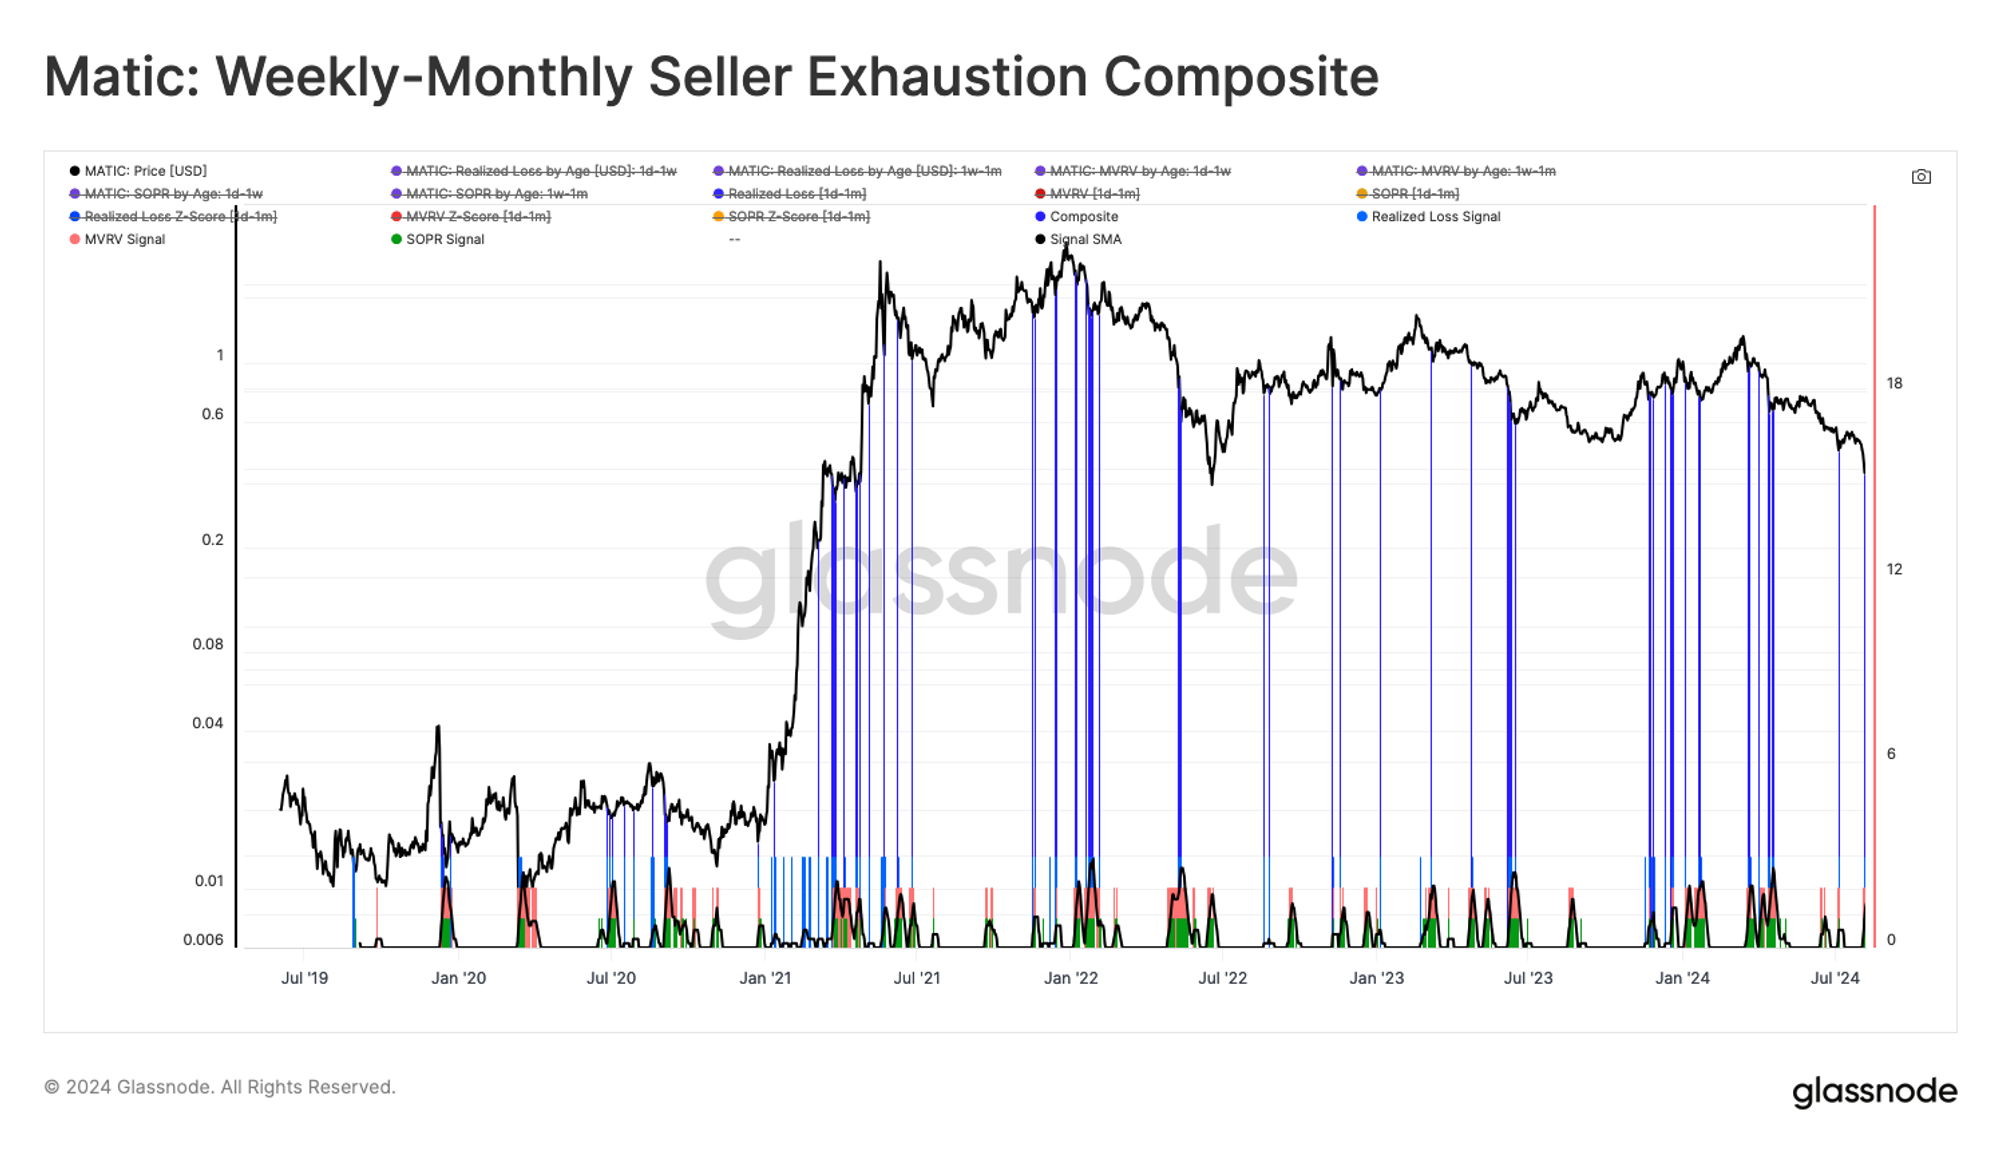
When combined, these metrics allow us to simulate scenarios where significant realized and unrealized losses suggest potential seller exhaustion. This approach helps us gauge when sell-side pressure might be absorbed by new buy-side demand, marking local bottoms in the market. The chart above highlights these periods in blue, showing points where significant loss metrics converge to signal potential bottoms.

Extending the Seller Exhaustion model across ERC-20 tokens offers users a tool that deepens their understanding of market sentiment and provides a data-driven method for identifying local bottoms, thus enhancing trading strategies. With the ability to apply this methodology to all supported ERC-20 tokens across various time frames, we are excited to offer unparalleled depth in on-chain analysis, empowering research teams and traders to navigate the Ethereum ecosystem with greater confidence.

What’s Next: Upcoming Insights and Tools

This is just the first step in our most recent efforts to broaden our coverage and enhance the analytical depth of our platform. Stay tuned for more updates as we continue to innovate and provide our users with the best possible tools for on-chain analysis.

Trending Cryptos

Related Reads

Deforming the Transformer, LLMs Become Smarter

A new research paper proposes "Tapered Language Models (TLMs)," a method that improves large language model performance without adding any parameters. It challenges the standard Transformer design where each layer has the same number of parameters ("feed-forward network" width). Building on evidence that layers are not equally important—earlier layers handle foundational information like grammar, while later layers often reinforce existing judgments—the researchers suggest reallocating model capacity from later to earlier layers. The core idea is to make the layer width taper off monotonically from start to end, keeping total parameters and compute constant. Experiments compared linear, cosine, and sigmoid tapering curves on a 440M parameter model. The cosine curve (e.g., starting width 1.5x baseline, ending 0.5x) achieved the best result, reducing perplexity by 1.84 points compared to the uniform baseline—a significant gain at zero cost. This finding proved robust across four different model architectures (including gated attention and memory-augmented models) and at larger scales (760M and 1.3B parameters), consistently improving performance on commonsense reasoning and language modeling tasks without harming long-context retrieval ability. The work highlights a long-overlooked design dimension: optimal parameter allocation across depth. It offers a "free lever" for efficiency, potentially applicable beyond language models to vision Transformers and diffusion models. The study was conducted by researchers from Mila, Cornell University, and the University of Montreal.

marsbit3m ago

Deforming the Transformer, LLMs Become Smarter

marsbit3m ago

From SpaceX to Galaxy Digital: A Detailed Look at 37 New AI Companies and 7 Crypto Dark Horses Added to the Russell Indexes

On June 26th, following its annual reconstitution, the Russell US Indexes finalized their new components, with changes taking effect for market trading on June 29th. The Russell 3000 Index, representing approximately 98% of the investable US equity market, saw significant turnover. A record $334 billion was traded during Nasdaq's closing cross on reconstitution day, highlighting the massive passive fund flows tied to these benchmarks. Companies newly added to the index are set to benefit from mandatory buying by these funds. The reconstitution raised the market cap threshold between the large-cap Russell 1000 and small-cap Russell 2000 by 24% to $5.7 billion. Overall, 224 new companies entered the Russell 3000. Of these, 19 joined the Russell 1000, and 205 joined the Russell 2000, while 118 firms were removed. Notably, among the newcomers, approximately 37 are companies operating in the AI and semiconductor ecosystem, accounting for roughly 17% of new additions. The most prominent is SpaceX, which, following its recent IPO and soaring valuation, was fast-tracked directly into the Russell 1000 and Top 200 indexes. Additionally, about 7 cryptocurrency-related companies were newly included, representing about 3% of new entrants. These include Galaxy Digital, Bitmine, and Tron, among others. The inclusion of several Decentralized Autonomous Trust (DAT) entities signals the model's sustained market presence. For these smaller AI and crypto firms, index inclusion boosts visibility, potentially attracting further institutional investment and supporting their stock performance.

Odaily星球日报7m ago

From SpaceX to Galaxy Digital: A Detailed Look at 37 New AI Companies and 7 Crypto Dark Horses Added to the Russell Indexes

Odaily星球日报7m ago

Token Uneconomical

"Token Inefficiency" explores the rising economic burden of AI model token usage in enterprises, where escalating costs often fail to match tangible productivity gains. Major companies like Microsoft, Uber, and Meta are facing "token inefficiency"—characterized by budget overruns for tools like Claude Code with unclear returns. This inefficiency stems from supply-side factors like strategic model price hikes by leaders (e.g., Anthropic) and price increases in budget-friendly models, alongside technical waste in Agent systems through context traps, tokenizer inflation, redundant skill calls, and multi-Agent coordination overhead. A deeper demand-side challenge limits token value: their primary utility remains confined to highly digitalized domains like programming, which benefits from automatic, low-cost feedback loops. Extending tokens to physical world tasks or less digitalized industries faces the "Sim-to-Real Gap," where real-world validation is costly and slow, unlike in code compilation. The article warns that this inefficiency concentrates financial risk in mid-tier model developers, potentially fueling circular financing schemes and shadow credit bubbles. It also highlights societal externalities, as data center expansion strains local power grids and inflates utility costs for residents. To achieve a positive net token economy, the path forward requires dual efforts: technical optimizations (context compression, skill reduction, model routing, budget constraints) and business-side discipline (governance, cost attribution, ROI focus). The ultimate goal is shifting from showcasing AI capabilities to maximizing value per token, finding scalable commercial applications that justify the investment and bridge the digital-physical divide.

marsbit25m ago

Token Uneconomical

marsbit25m ago

Stock Price Halved in 45 Days, Is Circle Actually the "DeFi Barometer"?

Over a 45-day period, Circle's stock price plummeted by approximately 50% to around $63, coinciding with a significant $70 billion decline in the circulation of its USDC stablecoin from its peak. In contrast, Tether's USDT saw a much smaller reduction. Analyst Ed Engel posits that Circle acts as a barometer for DeFi activity, as a high correlation exists between USDC supply and ETH price movements. The vast majority of USDC is concentrated within crypto exchanges and DeFi protocols for yield generation, rather than for widespread daily use in payments or commerce, unlike USDT which has stronger real-world adoption in various regions. The recent contraction in DeFi Total Value Locked (TVL), following security incidents like the Kelp DAO attack, appears to mirror Circle's declining stock performance. While Circle is actively promoting USDC's use as a settlement asset on platforms like Hyperliquid and in institutional payment corridors—where its organic transfer volume surpasses USDT's—these efforts have not sufficiently driven growth in USDC's overall supply. The company's revenue remains heavily tied to DeFi's expansion. For Circle's investment narrative to change, it must either significantly reduce its reliance on the volatile DeFi sector or demonstrably prove that real-world adoption can substantially and sustainably increase USDC circulation. In the near term, market confidence hinges on DeFi addressing its inherent risk-reward imbalances.

marsbit58m ago

Stock Price Halved in 45 Days, Is Circle Actually the "DeFi Barometer"?

marsbit58m ago

Trading

Spot

Hot Articles

Discussions

Welcome to the HTX Community. Here, you can stay informed about the latest platform developments and gain access to professional market insights. Users' opinions on the price of ETH (ETH) are presented below.

活动图片