1. BTC pullback prompt adjustment signal
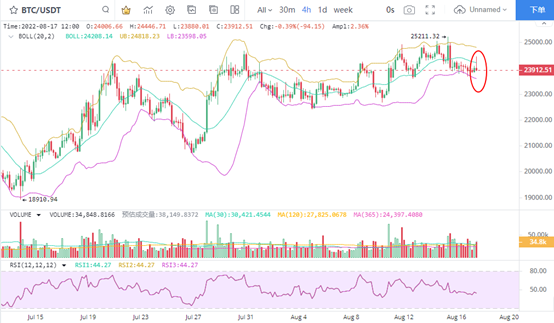
The price fluctuation of BTC in the 4-hour chart did not end. On the contrary, after the Bulls lured the bulls to pull up, the performance of BTC's rush to high and fall deserves attention. At present, compared with the position of the middle rail of the brin line, the BTC is not only lower than the middle rail of the brin line, but also has a false breakthrough signal with an amplitude of 2.48%. With the completion of the false breakout trend, the BTC price is expected to further callback.
The shock ratio RSI maintained below the 50 line in the same period, indicating that although the K-shape of BTC decline is increasing, it will not prompt oversold or deviation in the short term. Therefore, the BTC price retreat will be an important direction.
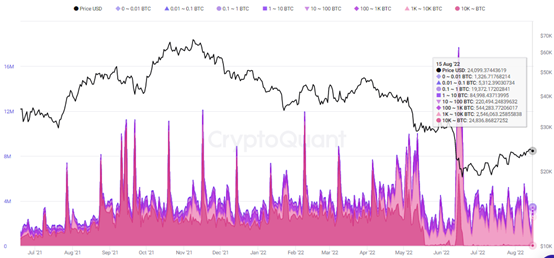
2. The proportion of main trading output decreased
Since the end of May, the proportion of BTC's main trading output has significantly decreased. Especially after the number of trading output with more than 10000 BTCs retreated, there was only a short-term rebound on June 15. The proportion of the following trading days was very low, and the main trading output with the number of 1000 to 10000 BTCs accounted for a large proportion. According to this judgment, the activity of giant whales is low at present. The main trading heat of 1000 to 10000 BTCs is high, which keeps the transfer and turnover of BTCs at a relatively high level.
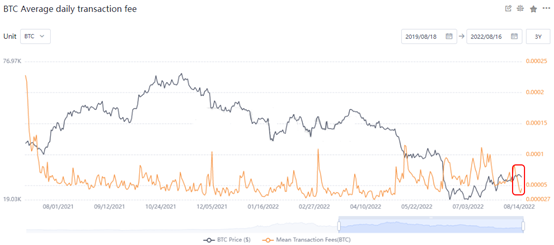
3. BTC average transaction cost (low operation)
The average transaction fee of BTC is not only at a low level, but also a significant drop in the short-term transaction fee. On August 16, the daily average handling fee of BTC dropped to 0.000045 BTCs, which was significantly lower than the recent peak of 0.00011 BTCs. The lower transaction handling fee means that BTC's trading enthusiasm is not high, and small and medium investors account for a large proportion. Therefore, in judging the market trend, the possibility of callback is increased.
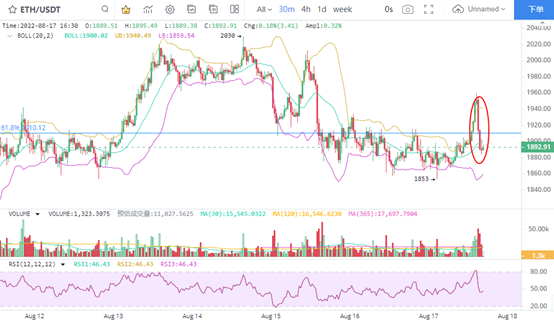
4. Eth linked BTC price pullback
Eth's short-term 30 minute K-line chart shows that the short-term volume of the price retreats below the 1910 USD corresponding to 61.8% of Fibonacci, which means that the number of adjustments continues to increase. From August 14, ETH prices continued to show a downward trend. From the range of short-term pullback to three consecutive price pullbacks, the pressure level of US $2040 has been verified to be effective. Next, USD 1910 becomes an important position to confirm the selling pressure. After the rebound below this point is invalid, the position reduction signal will be prompted.
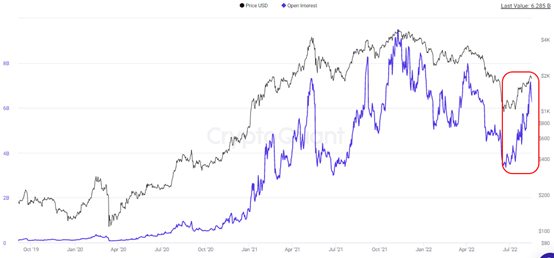
5. Contract position rebounded significantly
From the performance of eth contract positions, the recent contract positions have continued to rise, and the value has reached the high of US $7.16 billion. In fact, the growth of eth's contract positions has significantly exceeded the market performance of prices. From this perspective, ETH investors are increasing their bets. The potential volatility of eth can only be expected to be greater. On August 16, the price fluctuation intensity of eth was only 3.26%. Therefore, the ETH price has not really changed, but it is brewing a price decline during the pullback period.