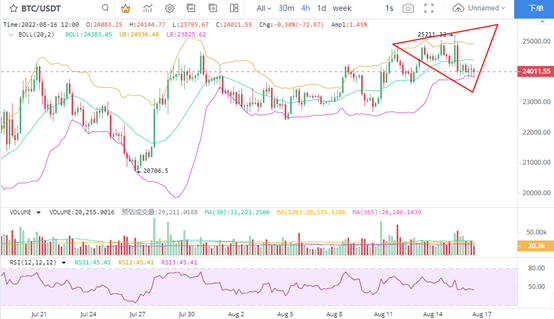
1. BTC pullback prompt adjustment signal
BTC frequently oscillates in the 4-hour chart, and it is difficult for the price to break around us $25000. The bell mouth expansion trend has been constantly verified. The figure shows that BTC is not only at the lower limit of the bell mouth configuration, but also below the middle rail of the brin line. The typical bearish configuration is being confirmed. In terms of trading volume, the BTC trading volume showed signs of contraction, and the shock ratio RSI was as low as 45, which verified the short-term adjustment signal.
Generally speaking, short-term trading can wait for BTC to fall below the brin line. After further verifying the bell mouth expansion pattern, the downward trend can be confirmed.
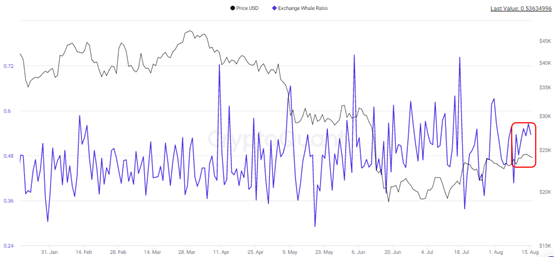
2. The proportion of main selling pressure remained high
The main selling pressure of BTC maintained a high level, and the proportion of giant whale trading in the exchange has rebounded to around 0.54. In addition, the proportion of main trading has been kept at a high level in the past week, which means that after the increasing selling pressure, the stagnant performance of BTC price has been reflected.
At present, the selling growth of BTC is relatively slow, but the accumulation process is relatively clear. Next, BTC is likely to continue to withdraw from US $25000. Once it withdraws, it can focus on the support effect of US $22500 and US $21000.
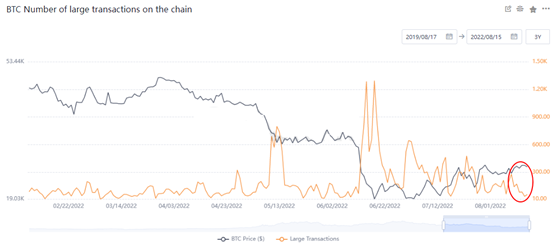
3. BTC giant whale trading volume continued to callback
With the continuous pullback of the trading volume of giant whales on the chain, the index value has reached the lowest level in 6 months, which means that the main activity has obviously dropped. In the absence of large capital participation, the rise of BTC was weak, which fully adjusted expectations. Numerically, on August 15, the number of large value transactions on the chain dropped to 59, and the number of transactions exceeded 29500 BTCs. Compared with the average level of 140 transactions in the past three months, the current transaction volume has indeed continued to fall significantly. The drop in the trading volume of the giant whale on the chain and the sluggish rise in BTC prices continued simultaneously, indicating that the pace of adjustment was accelerated.
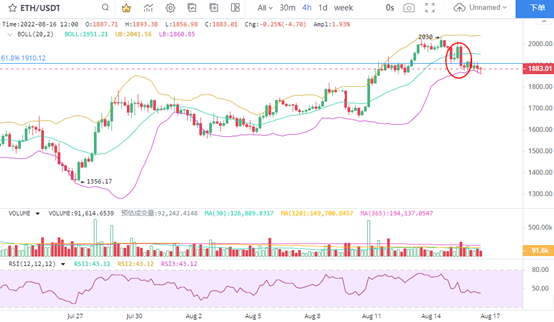
4. Eth confirms the callback signal twice
Eth's price pullback rhythm is fast. The 4-hour K-line chart shows that the price has fallen below the middle rail of the brin line for two consecutive times, which means that the effect of this decline confirmation is good. Next, the price of eth is not only lower than the middle rail of brin line, but also below the pressure level of USD 1910 corresponding to 61.8% of Fibonacci, and the expectation of further decline is high. In the 4-hour K-line chart, the short-term fluctuation intensity of eth is small, and the price may fall down during the contraction period.
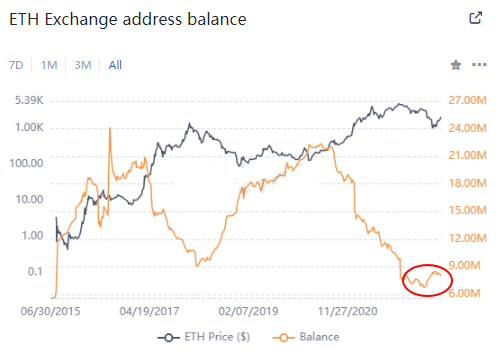
5. Eth of the exchange shows signs of growth
From the perspective of the number of eth on the exchange, the number of eth on the exchange remains at a low level, and the recent value remains around 8.028 million. It is lower than the historical low of 8.985 million in March 2018. This shows that the number of eth on the exchange is still small, but it has continued to pick up recently, with the number of band growth reaching 1.13 million eth. It can be seen that the possibility of eth continuing to flow into the exchange has increased. The increase of eth flowing into the exchange usually increases the selling pressure.