This is the third article in our series exploring Glassnode’s Cost Basis Distribution (CBD) metric and its practical applications. Previously, we demonstrated how to apply CBD insights across assets and how to identify capitulation events on a CBD heatmap.
For a deeper dive into the methodology and calculations behind this metric, refer to our detailed research piece here.
This week, we introduce another use-case-specific exploration of CBD - analyzing Metaverse tokens. Despite declining prices and fading hype, on-chain data suggests that major investors remain active, steadily accumulating and lowering their cost basis.
Does this signal a long-term bet on a Metaverse resurgence? Let’s first recap how to analyze and interpret CBD data and then apply that knowledge to the latest trends in Metaverse.
Understanding Cost Basis Distribution
Cost Basis Distribution (CBD) tracks where token supply is concentrated based on the average cost basis of holders. By analyzing shifts in supply distribution, we can identify investor behavior - whether they are accumulating, capitulating, or redistributing their holdings.
How to Read CBD Heatmaps:
- Color Intensity (Supply Distribution)
A warmer color (red/yellow) indicates a high concentration of supply at a given price range, while cooler colors (blue/green) signal lower supply. - Vertical Axis (Cost Basis)
Each horizontal slice represents a price range where a portion of supply last moved, showing how holders adjust their cost basis over time.
Tracking these changes helps us pinpoint potential market turning points, where accumulation or distribution trends may signal future price movements.
Metaverse Tokens: What Cost Basis Distribution Data Reveals
In this analysis, we focus on Metaverse tokens - The Sandbox (SAND), Decentraland (MANA), and Axie Infinity (AXS) - which were among the most prominent assets during the Metaverse boom of 2021. While the hype surrounding virtual worlds has faded, we shift our focus away from user activity and instead examine investor behavior using Cost Basis Distribution (CBD) data.
Rather than evaluating adoption metrics or in-game activity, we analyze how token holders have adjusted their positions over time. Are they capitulating, holding steady, or accumulating at lower prices? By tracking supply shifts at different price levels, we gain insights into how investor conviction has evolved in this post-hype phase and whether accumulation trends hint at long-term confidence in these projects.
The Sandbox (SAND): Steady Accumulation in a Bear Market
Despite price volatility, on-chain data shows continued accumulation. Holders with strong conviction are steadily increasing their positions, reinforcing their belief in the project's long-term potential.
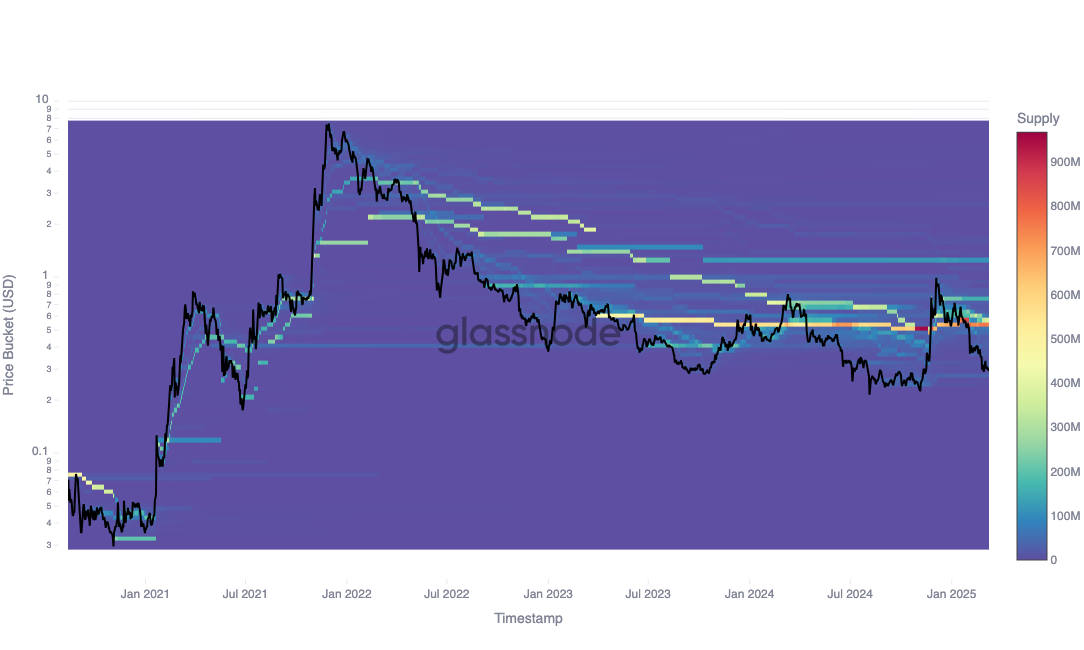
Decentraland (MANA): Buying the Dip
A significant supply concentration has formed around $0.60, reflecting increased buying activity following a price drop. This suggests that investors are viewing lower prices as buying opportunities, rather than signs of further decline.
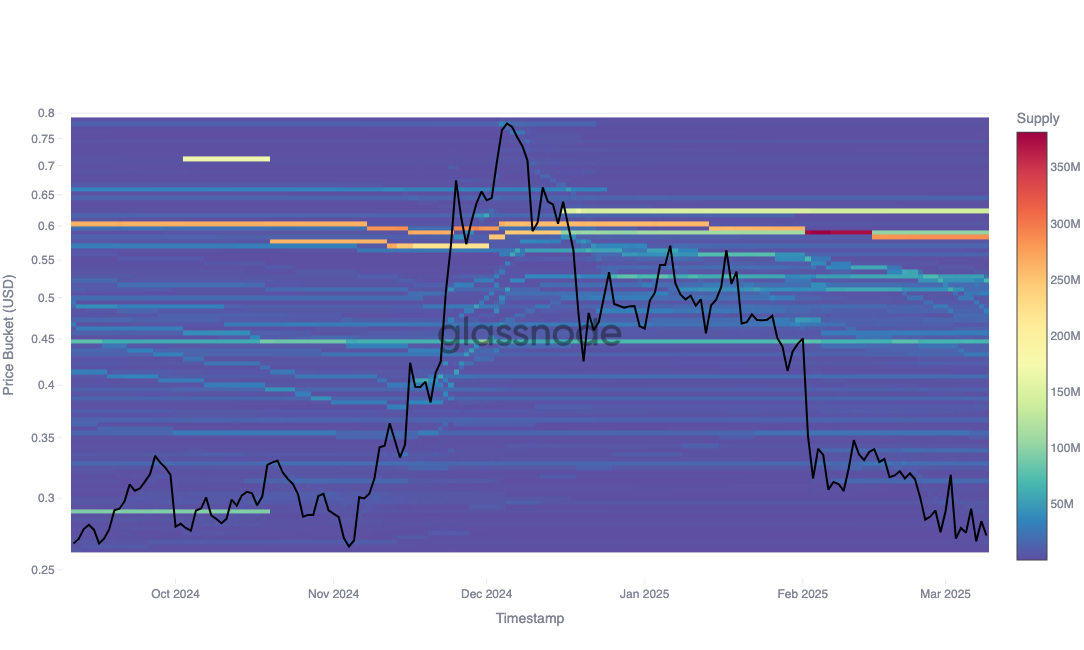
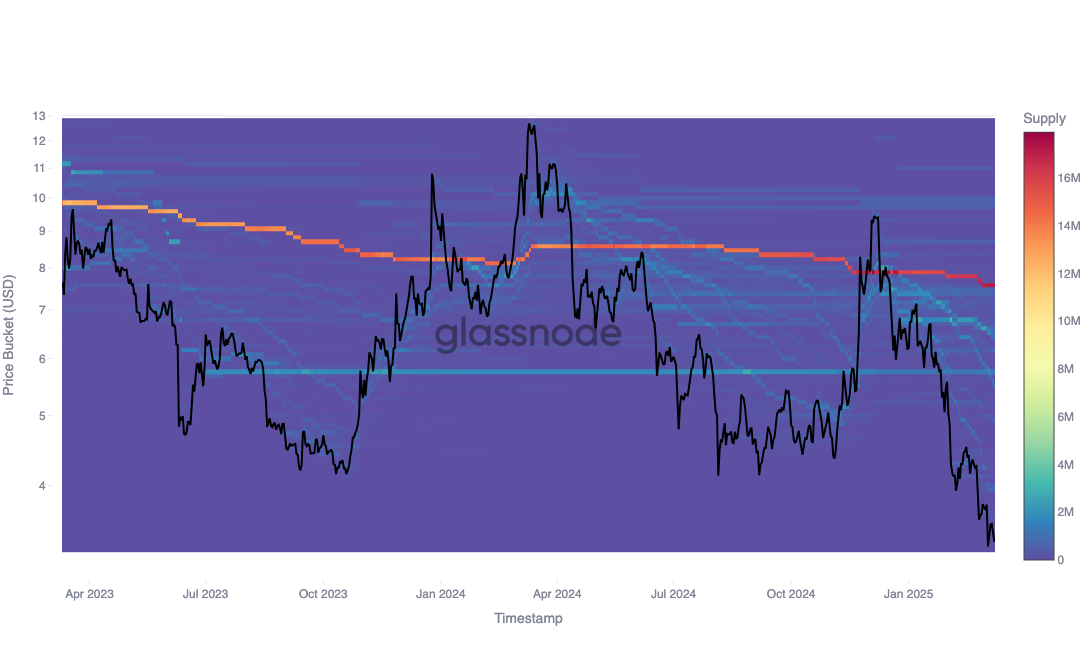
Axie Infinity (AXS): Long-Term Conviction Remains
Despite a sustained downtrend, on-chain data shows a progressive build-up of large positions. This pattern suggests that certain investors remain highly confident in the future of Axie Infinity.
Is Metaverse Resurgence Ahead?
The speculative hype around the Metaverse may have faded, but on-chain activity suggests otherwise. The continued accumulation across major Metaverse tokens indicates that many investors see these projects as undervalued opportunities rather than failures.
Is this setting the stage for a future recovery? While price action remains uncertain, the data suggests that conviction remains strong among key market participants - and they are positioning accordingly.