Like most coins, Polkadot [DOT] has been on a persistent decline over the last few months. During this phase, the two-month trendline resistance (yellow, dashed) has kept a check on the recent bullish revival attempts.
The current price setup took an interesting stance. A rebound from its long-term support can position the alt for near-term revival.
While the broader market structure plays out in favor of the sellers, losing the $7-mark support can expose DOT to a further downside in the coming sessions.
At press time, DOT traded at $7.25, up by 8.59% in the last 24 hours.
DOT Daily Chart
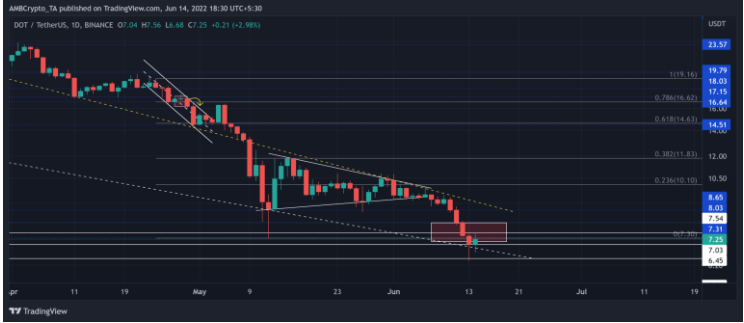
Source: TradingView, DOT/USDT
The recent drawdowns pulled DOT toward its 17-month low on 13 June after an over 32% three-day decline (10-13 June). Post this, the buying pressure seemingly saw a spike. Thus, the alt marked a bullish hammer on the daily timeframe after a streak of red candles.
The alt’s symmetrical triangle breakdown carved a path to test the eight-month trendline support (white, dashed). Should the current candlestick close above the hammer, it would confirm the short-term buying pressure.
Traders/investors should watch for the close beyond the $7.5-level to assess the effectiveness of the buying strength. With a confluence of the $7.03-support, trendline support, and the bullish hammer resistance (white, dashed), the alt could see short-term recovery toward the $8.6-zone.
An inability to close beyond the $7.3-level could intensify the sluggish behavior in the coming sessions. A broader market collapse below the $7-level would expose DOT to a further 8-10% downside.
Rationale
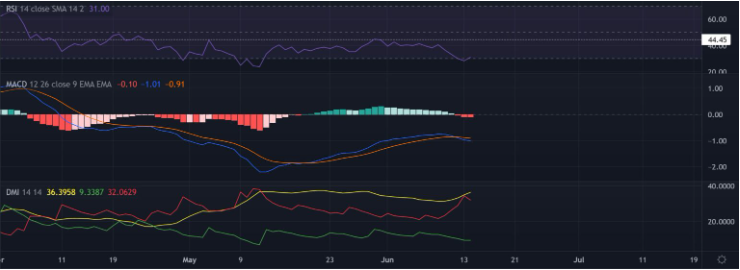
Source: TradingView, DOT/USDT
After consistently trying to break the bonds of the 44-mark, the RSI fell back into the oversold region. Potential growth from here could aid DOT’s short-term recovery prospects.
However, the MACD lines continued to depict a strong bearish edge in the current market dynamics. Further, with the -DI line finally looking south, DOT could register near-term ease in selling pressure.
Conclusion
Given the multiple support confluences at the $7-region alongside the bullish hammer, a potential near-term recovery could see a reversal from the $8.6-region. In this case, buyers must wait for a close above the $7.3-mark.
However, an overall market sentiment analysis becomes vital to complement the technical factors to make a profitable move. A close below the $7-support can spiral into undesired losses.