Bitcoin closed the week in the red, as the leading asset continued to retest the $30,000 region.
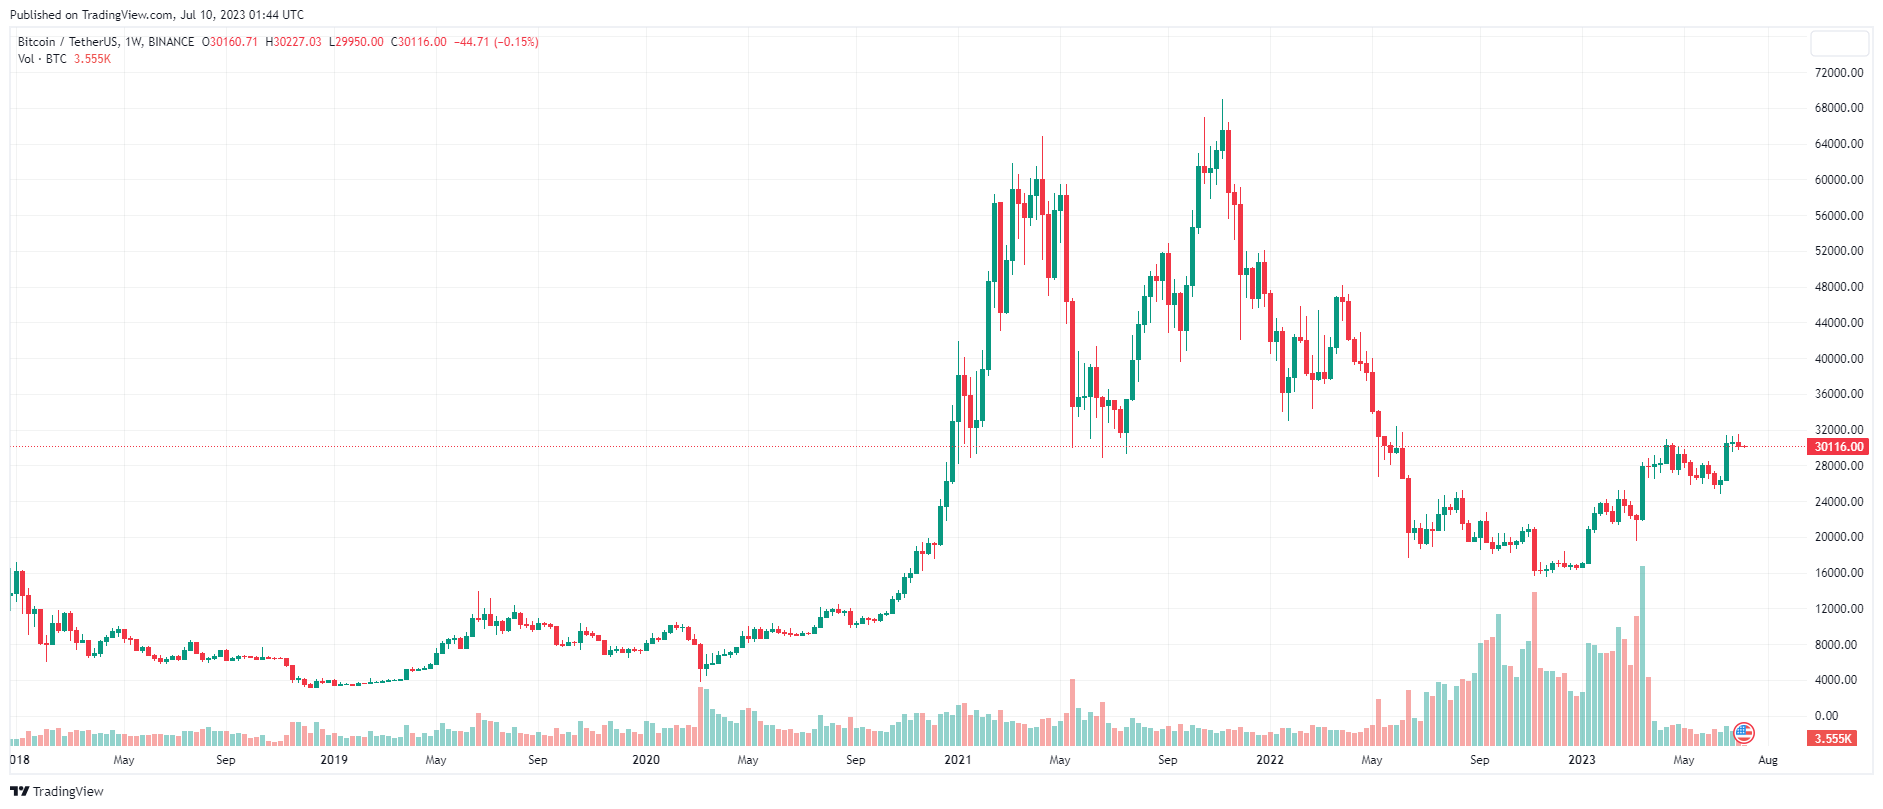
BTC Price Chart – 1 week | Source: TradingView
Stock market futures rallied on Sunday night as investors braced for a flurry of inflation data on Wednesday and Thursday and the start of second-quarter earnings season.
Futures contracts tied to the Dow Jones Index rose 38 points, or 0.1%; Nasdaq 100 futures are up 0.01% while S&P 500 futures are up about 0.1%.
Stocks are entering a new week after closing lower on jobs data from ADP and the Labor Department last week. Although nonfarm payrolls growth has cooled somewhat, investors are signaling that the economy is still wobbling enough for the Federal Reserve to continue raising interest rates.
As a result, all three major indexes posted losses last week. The S&P 500 fell 1.16%, while the Nasdaq Composite and Dow Jones Industrial Average lost 0.92% and 1.96%, respectively.
Investors will also be keeping an eye on the quarterly earnings report this week. Financial giants BlackRock, JPMorgan Chase, Wells Fargo and Citi will all report and kick off second-quarter earnings season.
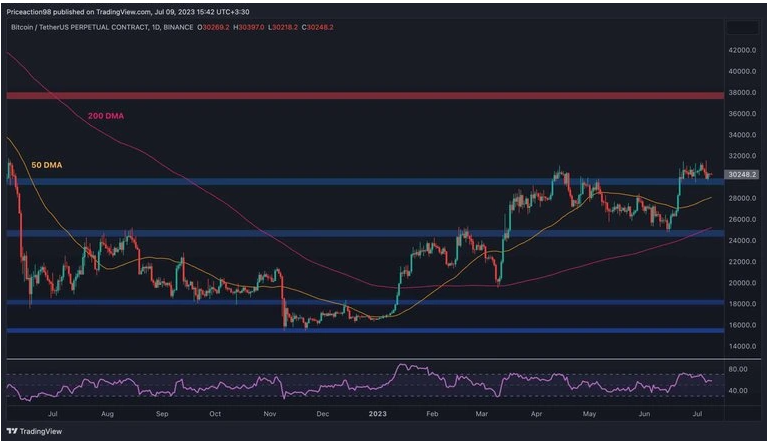
After the recent Bitcoin rally and successful breakout above the $30,000 resistance, the market is currently going through an accumulation phase. However, notable signals are emerging during this period.
On the daily chart, the price has repeatedly tested the $30,000 level since breaking through it. While this level has provided support so far, there are worrying signs in the form of a bearish divergence on the RSI.
This shows the possibility of correction or reversal in the near term. If a pullback occurs, the 50-day and 200-day moving Medium near $28,000 and $26,000, respectively, could act as key support levels.
Conversely, if the upside momentum continues, a move towards the $38,000 resistance area becomes the logical scenario.
Source: TradingView
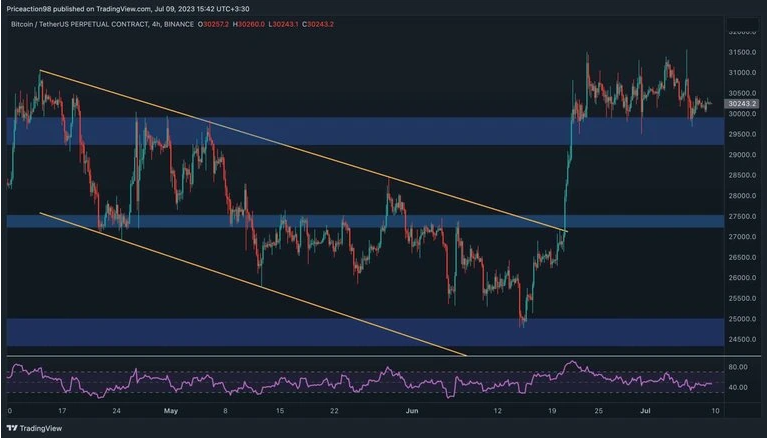
On the 4-hour chart, the price has shown erratic and unpredictable movements in recent weeks, making it difficult to determine its future direction. The market is retesting $30,000 once again and the possibility of a breakdown could lead to a drop to $27,500.
The RSI is relatively flat, hovering around the 50 mark, indicating a clear lack of dominance from buyers or sellers. The ongoing battle near the key $30,000 area further reinforces the near-term uncertainty in the market.
Source: TradingView
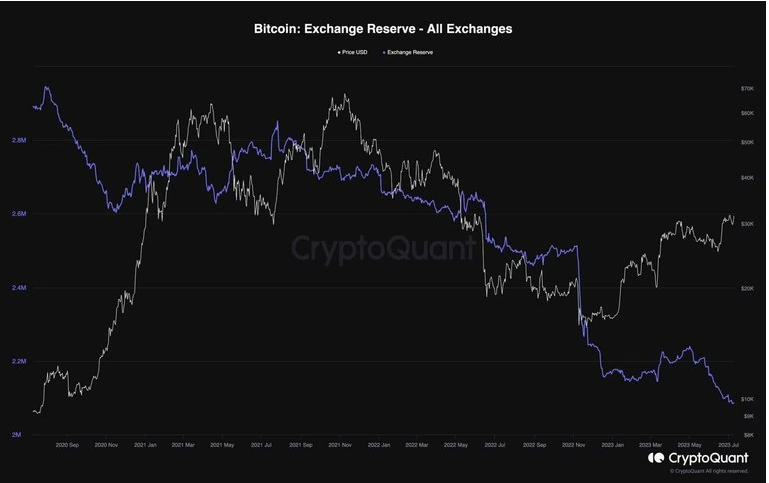
Bitcoin's recent bullish movement has sparked discussions about whether market participants are selling their BTC for a profit or choosing to hold them longer.
By analyzing the Bitcoin reserve index on exchanges, we can better understand investor behavior. The increase in this metric shows that investors are depositing their funds in exchanges, with the possibility of selling them. Conversely, the drop shows that investors are withdrawing their BTC from exchanges, indicating that they want to hold the money for a long time.
Recent data shows that Bitcoin reserve figures on exchanges have plummeted in the past month. This decline shows the optimistic sentiment of the market participants, as they anticipate the price to rise further and tend to keep their money.
Source: CryptoQuant
On the altcoin side, the market fell slightly as Bitcoin closed the week in the red and once again retested the $30,000 region.
In the past week, most altcoins are recording in the red, erasing almost all of the gains of the previous week.
In short, projects like Conflux (CFX), Fantom (FTM), NEAR Protocol (NEAR), Bitcoin SV (BSV), Pepe (PEPE), Solana (SOL), WOO Network (WOO), Litecoin (LTC) , eCash (XEC), The Graph (GRT), EOS (EOS), … all dropped from 3-6% all at once.
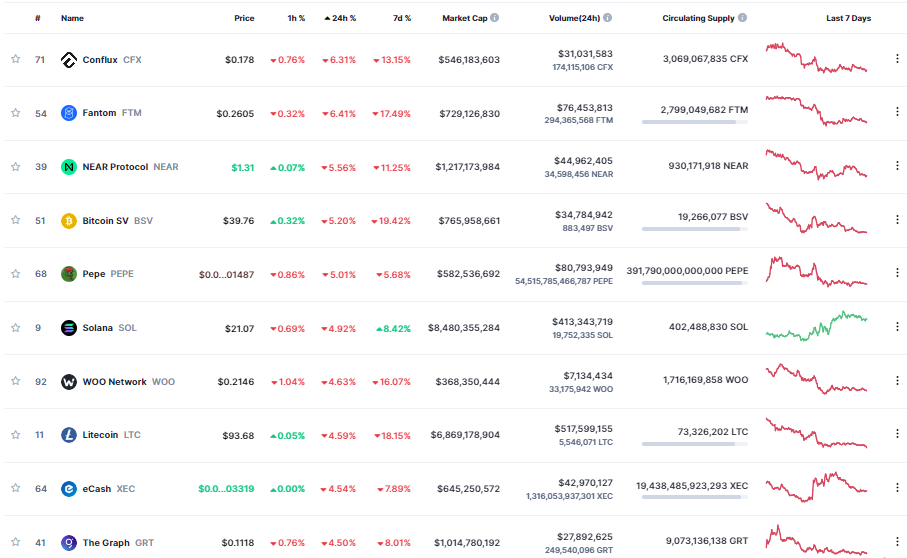
Source: Coinmarketcap
After being rejected above the $1,900 area, Ethereum (ETH) is still trying to defend the $1,850 area as price action seems to have been flat around it for the past three days. The 2nd largest Cryptoasset by market Capital is currently trading around $1,856, down slightly by 0.6% in 24 hours.
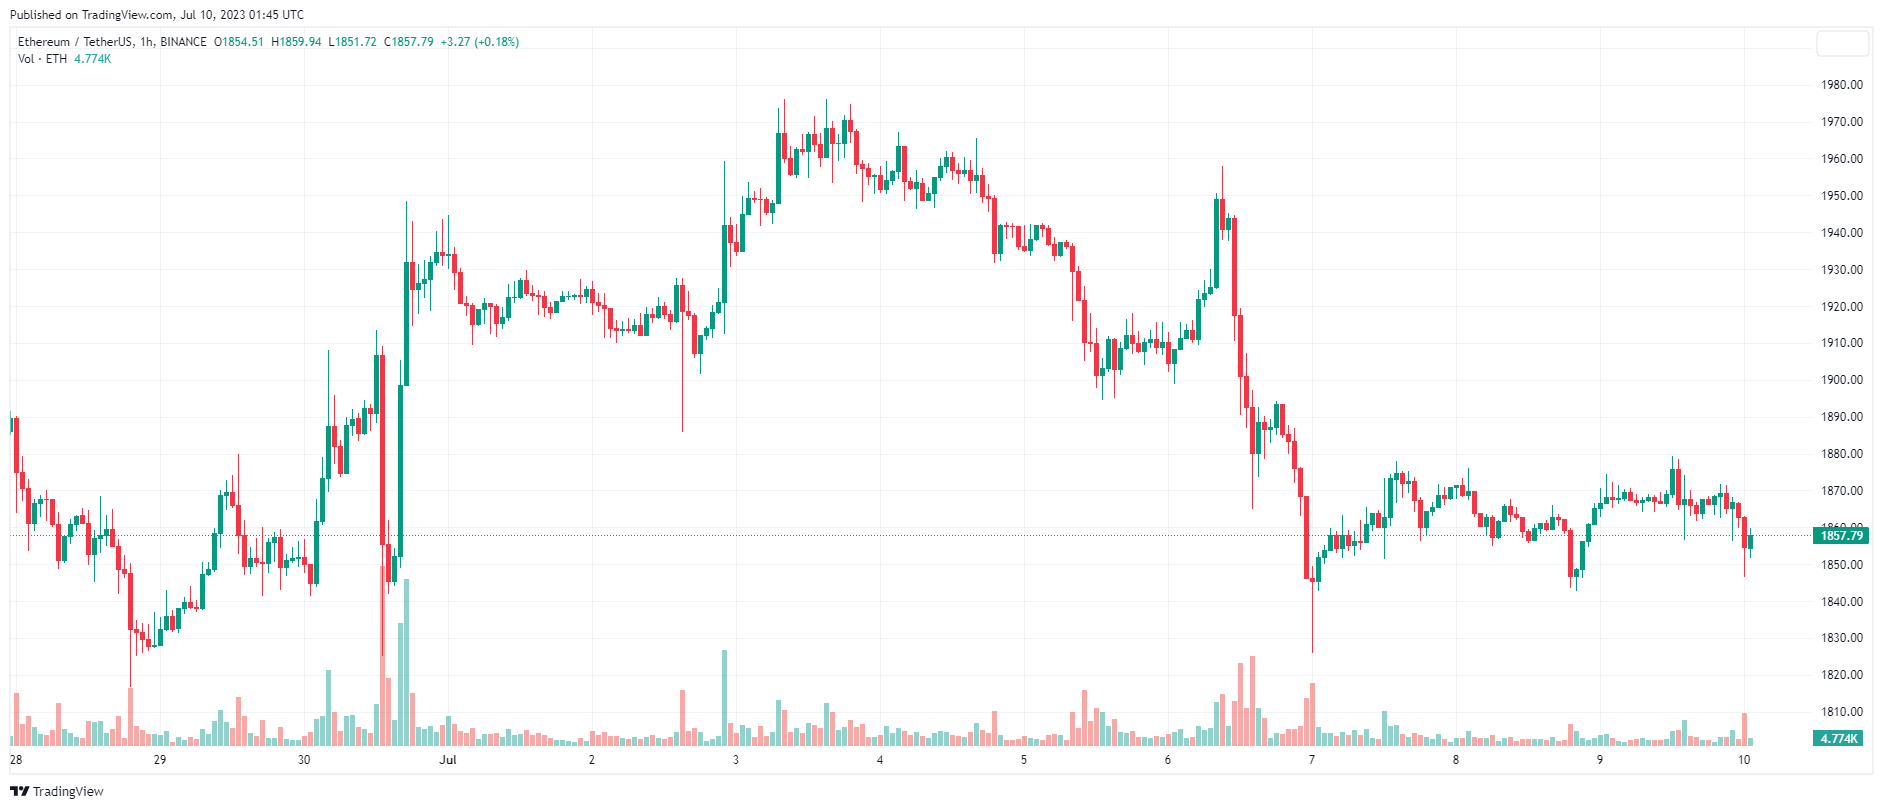
ETH price chart – 1 hour | Source: TradingView