Ethereum has flipped bearish following the market’s reaction to the Federal Reserve (Fed) meeting, but its price remains firm above the $2,100 level. Given the bearish conditions, the market dynamics of ETH are starting to shift as key metrics signal a possible liquidity trap ahead at current levels.
An Ethereum Liquidity Trap Signal Emerges
After recent price action, an on-chain indicator is triggering fresh concerns around Ethereum and its market dynamics. These kinds of signals are typically seen during volatile periods and could play a crucial role in shaping the altcoins’ next price trajectory in the short term.
Combining signals from multiple metrics, Boris, a crypto trader and on-chain analyst, has outlined the potential formations of a liquidity trap for ETH. Even though price activity may seem stable on the surface, underlying data indicate that liquidity is being concentrated in a way that could surprise traders.
As ETH’s price climbed toward the $2,400 level, the Whale Vs Retail Delta continued to move into negative territory. This trend underscores a key divergence in activity between large holders and smaller investors in the market. Simply put, large holders or whales are reducing their relative activity or exposure, while small traders are becoming more active in the market.
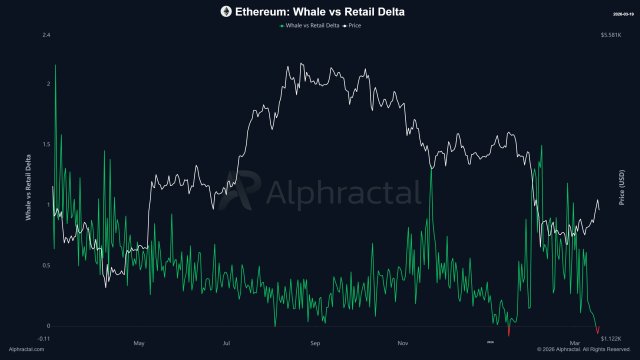
Currently, whale investors are closing their long positions in Ethereum and opening more short positions. Meanwhile, retail holders are doing the opposite as they aggressively open long positions. When institutional players retreat while retail engagement increases, this imbalance frequently indicates a shifting mood under the surface. A trend of this kind is considered a classic liquidity illusion.
Boris highlighted that buying pressure saw robust strength for a period, but those buys were absorbed by sell-side liquidity. As a result, the market has entered a cooling phase. Historically, the current market setup hints at further downside pressure.
Adding to the market trend is the ETH Liquidation Levels metric. Data shows a significant long buildup over the past month, with key liquidity targets at $1,850 and below. While the price is moving up, the market is clearly demonstrating weakening strength underneath.
ETH Closes Recent CME Gap
Ethereum’s recent price action was met with a CME Gap. However, CW, a market expert and investor, reported that the leading action has filled the gap, which was located at $2,117. As the market tries to correct inefficiencies, these gaps, which are frequently created during times of intense price movement, may serve as magnets for subsequent price action.
After closing the gap, a buy wall has been formed around $2,100, and this level aligns with the Fibonacci level of 0.382. If a rebound occurs after reaching the $2,100 level, the next target is around $2,686, a price that corresponds to the 0.382 fib level. Meanwhile, if ETH rises to this level, another CME gap ahead will be filled.