Solana price was off to a good start this week despite choppy market conditions. The bulls have tired out over the last 24 hours. In the past day, the altcoin fell by 3%. Solana prices have risen by nearly 6% in the last week.
The technical indicator continued to demonstrate that the bears were in control at press time. If buying strength continues to head in the same direction, then most of the coin’s weekly gains would be nullified.
The technical outlook for the coin was negative as the sellers took over at the time of writing.
The current support zone for the coin is between $33 and $26. If SOL falls below its current price level, then the bears will gain momentum on the chart.
With Bitcoin consistently wavering near the $19,000 mark, most altcoins also started to wobble on their respective charts and moved closer to their immediate support levels.
For Solana price to reach its next price ceiling, the demand for the coin has to increase on its chart.
Solana Price Analysis: One Day Chart
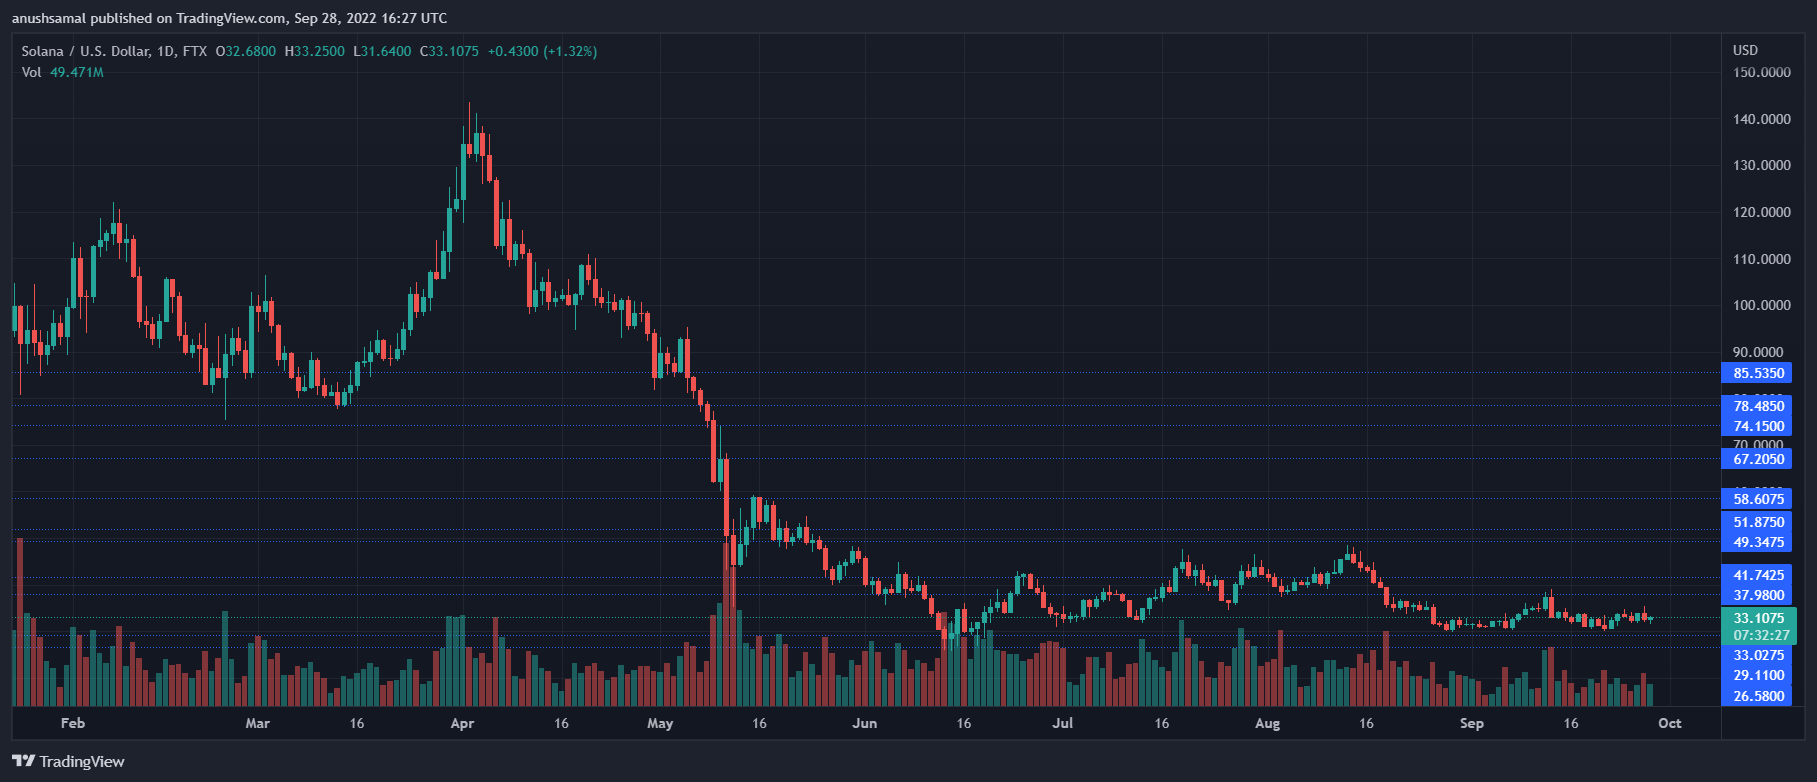
Solana was priced at $33 on the one-day chart | Source: SOLUSD on TradingView SOL was trading at $33 at the time of writing. The coin had registered recent gains over the past few days, but the bulls faced resistance and it fell on its chart.
The immediate resistance for the coin stood at $38 and then another price ceiling was at $41. If Solana price decides to move above the $41 level, then bulls could come around on the chart.
On the other hand, the closest support line was at $29, and a fall from that level would cause the altcoin to trade at $26.
The volume of altcoin traded decreased in the previous session, indicating that buying strength has decreased on the chart.
Technical Analysis
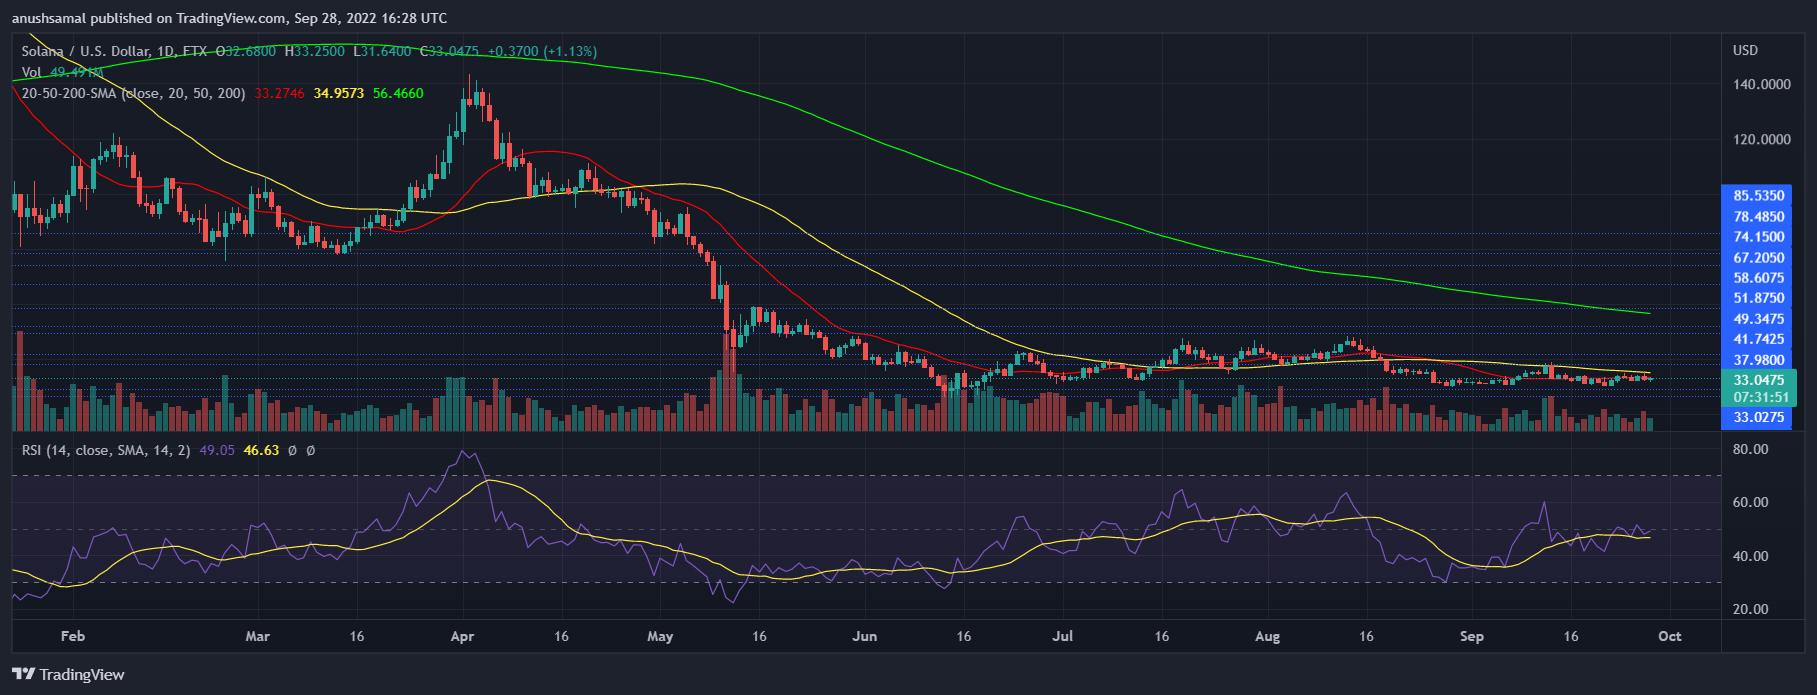
Solana registered a fall in buying strength on the one-day chart | Source: SOLUSD on TradingView The altcoin showed more selling strength on its one-day chart. Solana, despite gains in the last few days, has not witnessed a surge of buyers.
This also meant that demand was present at the lower levels. The Relative Strength Index displayed an uptick and the indicator was on the half-line, which meant that there was an even number of buyers and sellers.
Other indicators, however, aligned with the selling strength on the chart.
The Solana price was below the 20-SMA line, which also indicated that the sellers were driving the price momentum in the market. With a slight appreciation in demand, SOL could travel above the 20-SMA line.
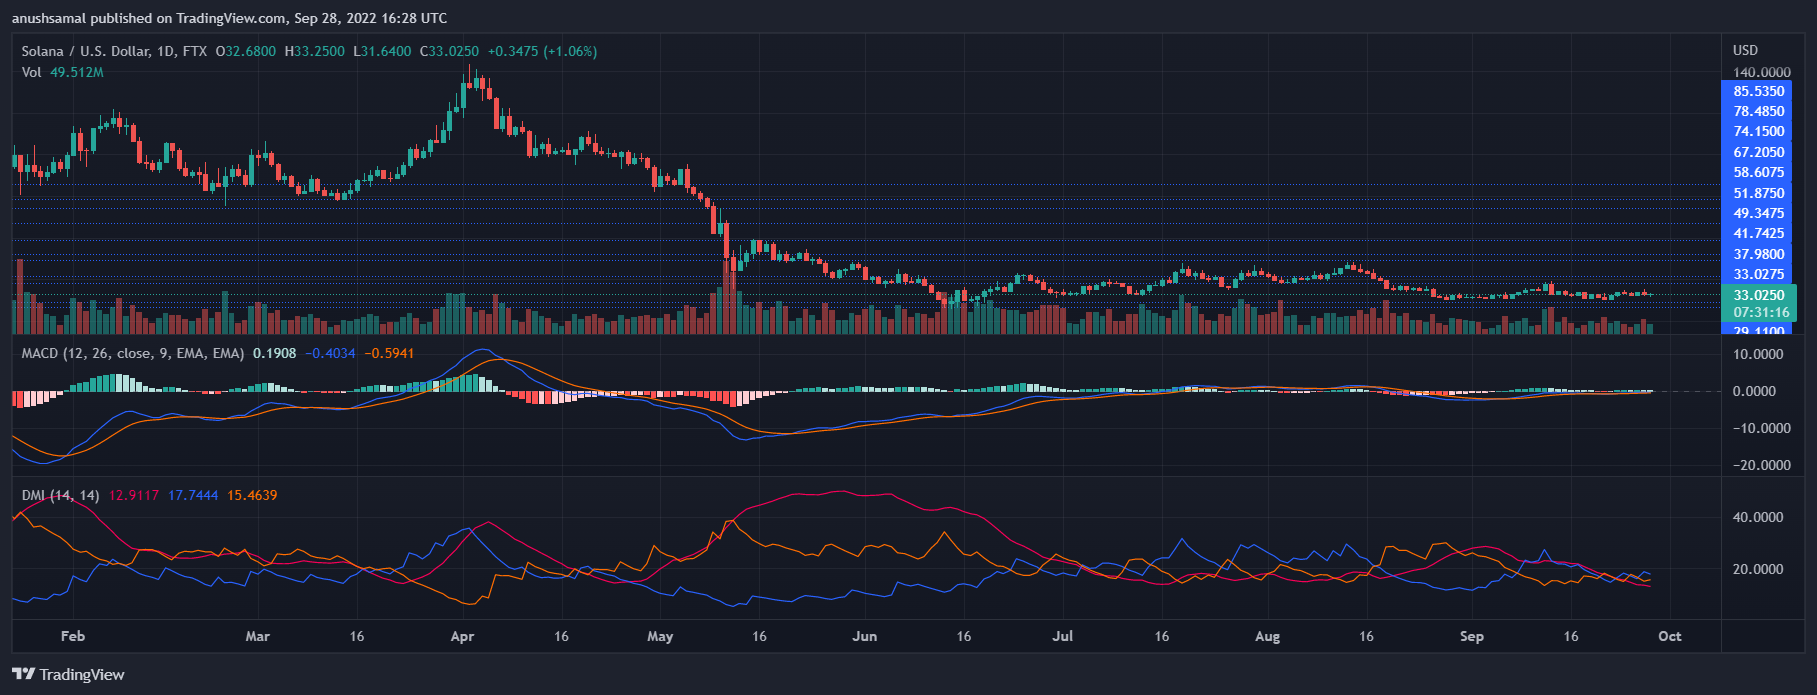
Solana displayed buy signal on the one-day chart | Source: SOLUSD on TradingView SOL’s other technical indicators were yet to turn entirely bearish, although the indicators depicted the onset of bearish pressure.
The Moving Average Convergence Divergence indicates the price momentum and overall price direction.
The MACD continued to display green histograms, which were buy signal for the coin.
The green signal bars were declining, which also meant that the positive price momentum was on a decline.
The Directional Movement Index showed the price momentum and it was positive as the +DI line was above the -DI line.
Average Directional Index was below the 20-mark, showing that the current market action had less strength.