Options markets encode a substantial amount of information about expected volatility and tail risk. Within the industry, 25-delta skew remains the go-to metric for viewing the digital asset options market. Skew is a powerful signal – it indicates how much more investors are willing to pay for downside protection relative to upside exposure. However, it is ultimately just one slice of a much richer volatility surface.
To move beyond this single-point view and make the full surface analytically usable, we are introducing a new suite of Interpolated Implied Volatility metrics that map IV across deltas and maturities. Users can now work with a continuous, model-driven representation that preserves structure, reduces noise, and supports cross-asset and cross-tenor comparison.
Options data is a major focus for Glassnode's product development. We are scaling our coverage with new metrics that extend the depth of our volatility tooling, broaden analytical use cases, and give professionals a more complete view of positioning and risk across the market.
New Interpolated IV Metrics
We have converted the raw, noisy volatility surface into a clean, standardized grid, allowing you to isolate specific risks with precision:
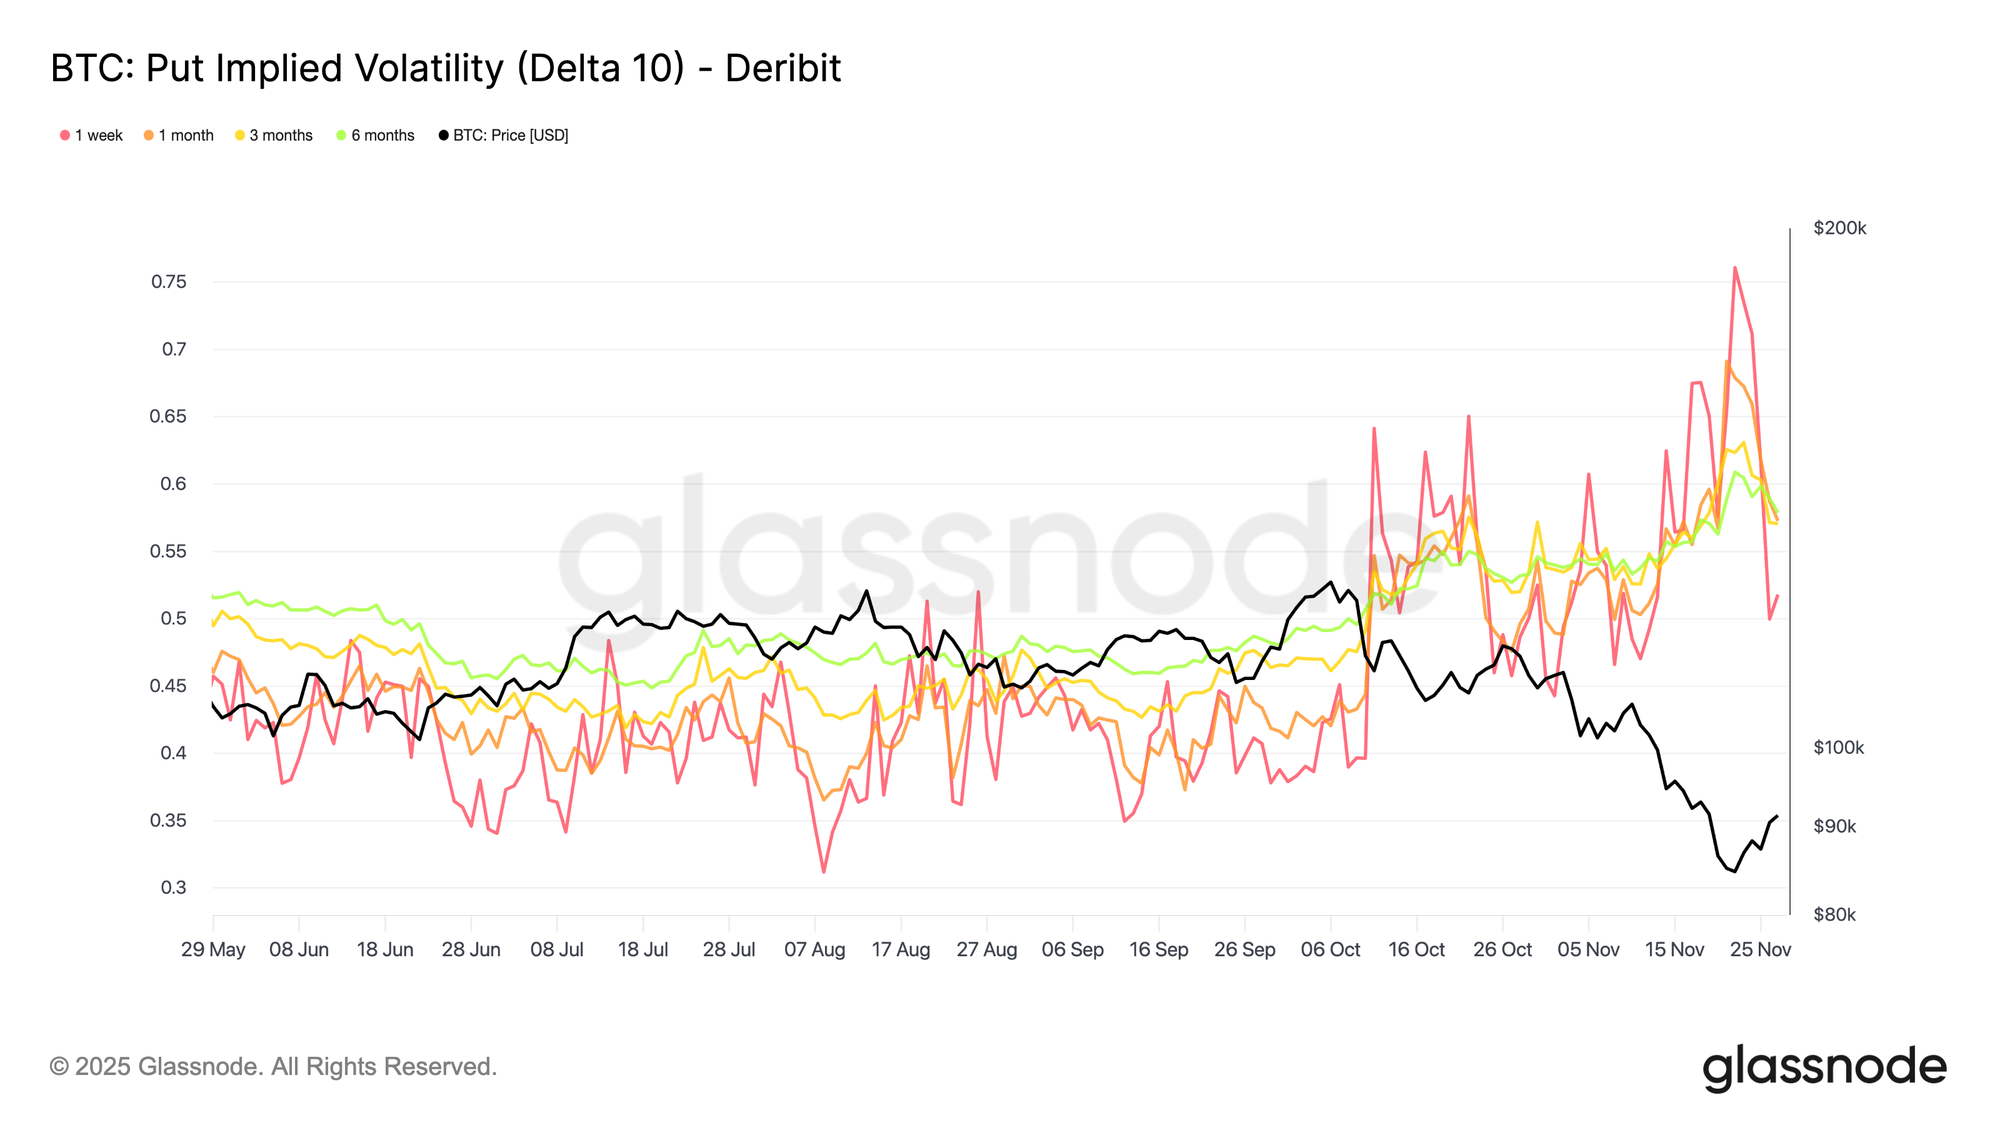
- Deltas: 5D, 10D, 15D, 20D, 25D, 50D
- Tenors: 1 week, 1 month, 3 months, 6 months
- Option types: Calls and Puts
- Assets: BTC, ETH, and now SOL, BNB, XRP and PAXG
- Resolutions: 10m, hourly, daily
Each time series represents the model-interpolated IV at a target delta and tenor, for a specific asset, exchange and quote currency. For example, “BTC: Put IV Delta 10 (All)” is the 10-delta put implied volatility curve across tenors, cleaned and interpolated from the live surface.

Why Do We Need Interpolation?
Options data in the real world is irregular. Exchanges list many strikes and expiries, but liquidity is uneven and can shift throughout the day. As a result, the raw volatility surface contains structural gaps: certain deltas rarely trade, some maturities are thin, and the specific points analysts care about (e.g., a 10-delta Put at exactly 1 month) often do not appear in the quoted market at all.
Interpolation addresses this by reconstructing the missing parts of the surface in a disciplined and repeatable way.
Instead of relying on whichever contracts happened to trade at a given moment —which can introduce noise and instability — we use neighboring quotes to infer a consistent value for each target delta and tenor. The procedure, in simplified form, is:
- Identify the two quoted options bracketing the target delta (one slightly below, one slightly above).
- Infer the implied volatility at the target delta using these neighboring quotes.
- Apply the same logic across maturities to obtain standardized IV values at 1w, 1m, 3m, and 6m.
This produces a smooth, time-consistent volatility surface that avoids gaps, filters out abrupt jumps, and does not depend on illiquid or irregular strikes. Analysts can therefore reference the same points on the surface at every timestamp, independent of market microstructure effects.
A Move from Broad Indicators to Granular Analysis
This update moves the focus away from broad measures to a structured, point-by-point set of IV metrics to examine how the market prices risk across specific deltas, maturities, and option types.
Go beyond 25D skew: Separate call and put legs at 5D–50D and see exactly where the market is paying for downside protection or bidding for upside exposure. This allows you to evaluate risk sentiment more precisely than skew, which compresses all this information into one value.
Compare risk across assets: These metrics make it possible to assess whether the market is pricing more crash risk into BTC or ETH. By overlaying their 10-delta Put IV time series, you can directly observe which asset carries the higher downside premium at any point in time, without being affected by differences in strike listings or liquidity conditions.
Identify cross-asset opportunities: Standardized delta buckets also help reveal shifts in relative demand. For example, if SOL 25D Call IV is rising while BTC 25D Call IV remains stable, the interpolated series makes that divergence easy to detect and quantify, which may signal rotation toward higher-beta assets or a change in market expectations for altcoin volatility.
Monitor term structure: The normalized tenors (1-week to 6-months) let you observe how the market is pricing short-term stress versus longer-term repricing. A widening spread between front-end IV and longer-dated IV can indicate immediate uncertainty, while a flattening or inversion may reflect broader shifts in macro or structural expectations.
Build systematic strategies: Because the metrics are interpolated, each time series is cleaned, stable, and normalized to standard tenors. This removes noise introduced by irregular strikes and uneven trading activity, making the data suitable for direct integration into systematic strategies, backtests, and execution models without requiring additional preprocessing.
This new suite is the foundation for the next wave of options analytics at Glassnode and a more precise way for you to see how the market is really pricing risk.
- Follow us on X for timely market updates and analysis
- Join our Telegram channel for regular market insights
- For on-chain metrics, dashboards, and alerts, visit Glassnode Studio
Disclaimer: This report is for informational and educational purposes only. The analysis represents a limited case study with significant constraints and should not be interpreted as investment advice or definitive trading signals. Past performance patterns do not guarantee future results. Always conduct thorough due diligence and consider multiple factors before making investment decisions.