Bitcoin is once again under pressure as the market navigates a volatile and uncertain phase. After briefly reclaiming the $111K level, the world’s largest cryptocurrency is struggling to maintain $110K as a stable support zone. Sellers are regaining control, and bearish traders are calling for a deeper retrace toward lower range levels — possibly below the six-figure mark.
Adding to the cautious tone, fresh data from CryptoQuant reveals a concerning on-chain development: old Bitcoin coins are waking up. This metric, which tracks previously dormant BTC moving on-chain, has shown a sharp increase among coins aged 3–5 years, indicating that long-term holders are starting to move or sell part of their holdings. Historically, such behavior has preceded phases of heightened volatility or deeper corrections, as these older coins often represent significant, high-volume supply entering the market.
While some analysts interpret these moves as long-term holders taking profits after the year’s rally, others warn that renewed selling from this group could intensify downward pressure. As market sentiment turns defensive, traders are watching closely to see whether Bitcoin can defend key support zones or if these “old coins” will fuel the next leg of a broader correction.
Long-Term Holders Move Supply as Selling Pressure Builds
Top analyst Maartunn shared data revealing a notable spike in long-term holder activity, with 3–5-year-old BTC spent jumping to 2,496 BTC — a significant move considering the typically dormant nature of this cohort. These “old coins” represent Bitcoin that hasn’t moved in years, often held by investors with high conviction. When this group becomes active, it usually signals a major shift in market dynamics.
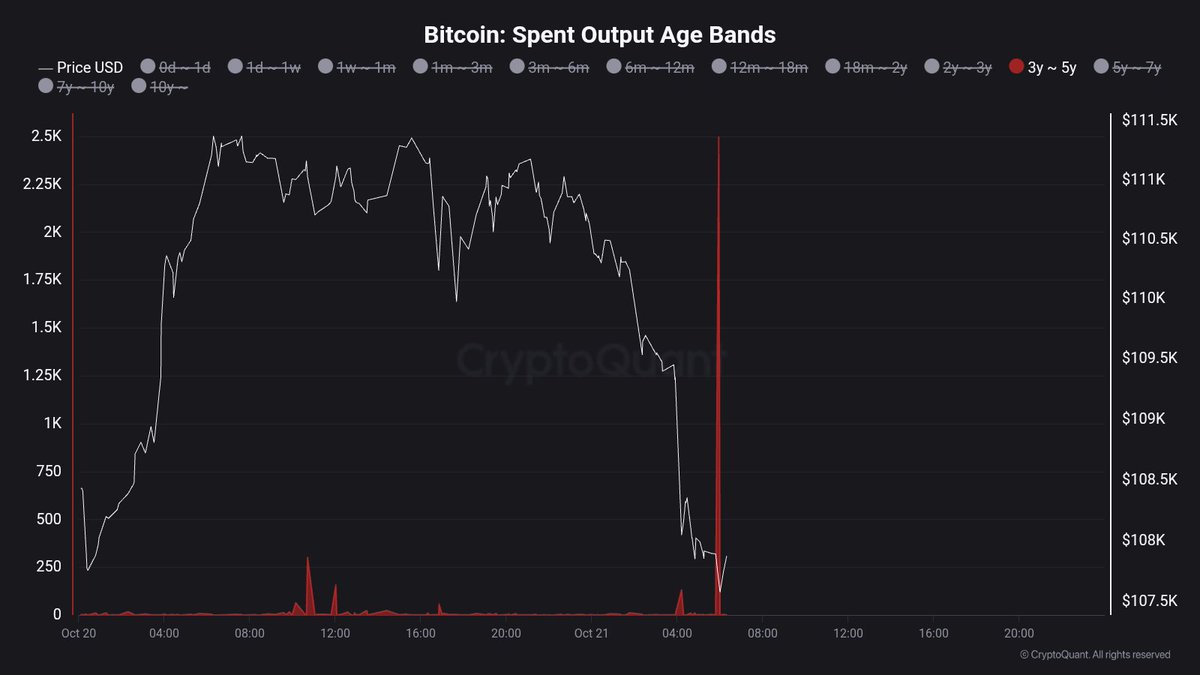
Bitcoin Spent Output Age Bands | Source: Maartunn
Historically, such spikes in long-term holder activity tend to occur near macro turning points, either as a sign of distribution during local tops or early reaccumulation phases after deep corrections. In the current context, this rise in aged coin movement could mean two things. First, it might reflect profit-taking from early holders who are capitalizing on gains as market volatility intensifies. Second, it could indicate reallocation or strategic rotation, where coins move between wallets as investors prepare for renewed market turbulence.
This comes amid a backdrop of persistent selling pressure, with Bitcoin struggling to hold above the $110K level. The broader market remains cautious, as liquidity thins and short-term traders react to each downside move.
While long-term holders moving supply can appear bearish in the short run, it’s also a natural part of market cycles — often preceding phases of redistribution that ultimately strengthen long-term structure. If Bitcoin can absorb this supply and maintain support above $106K–$108K, it could set the foundation for a more sustainable rebound. However, failure to do so might confirm a deeper correction, potentially testing the $100K zone once again.
Testing Support Amid Renewed Weakness
Bitcoin is struggling to find momentum after days of selling pressure, currently trading around $107,800. The 3-day chart shows BTC fighting to stay above the 200-day moving average (green line) near $106,000, a crucial support that has historically served as a base during major corrections. The bounce from the recent $103K low suggests some buying interest, but momentum remains fragile as bulls attempt to defend this key zone.
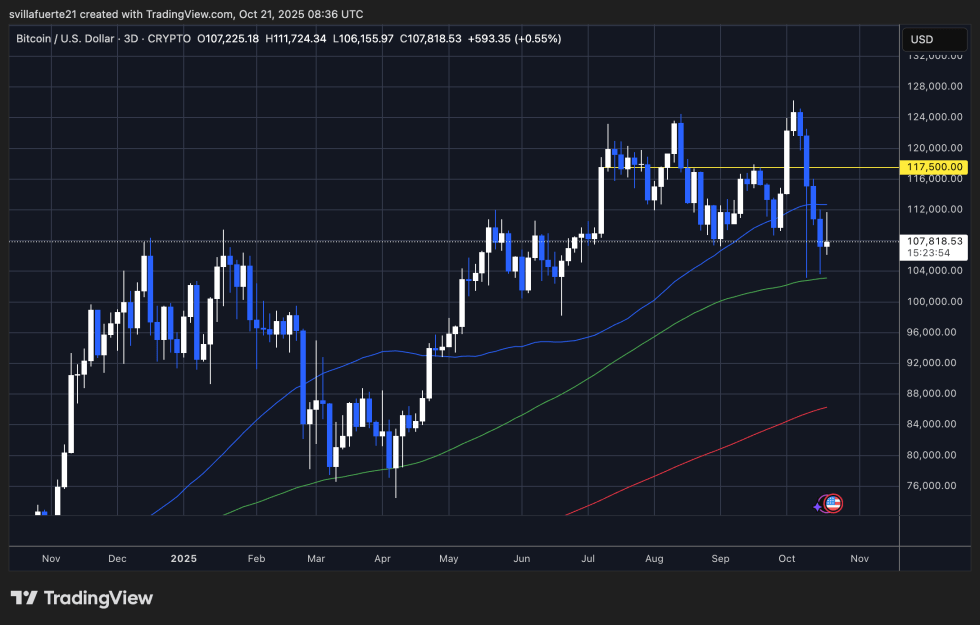
BTC testing key demand | Source: BTCUSDT chart on TradingView
The 50-day moving average (blue line), sitting above $112,000, now acts as short-term resistance, with a broader supply area forming around $117,500 — the same level that capped previous rallies. A close above this threshold could confirm a short-term reversal, signaling renewed buyer confidence. However, repeated failures to reclaim it may invite another wave of selling pressure.
Market structure remains neutral-to-bearish, with volatility compressing following the October 10 flash crash. If BTC loses the $106K–$107K zone, downside targets could extend toward $100K, where the yearly average offers the next layer of support.
Featured image from ChatGPT, chart from TradingView.com