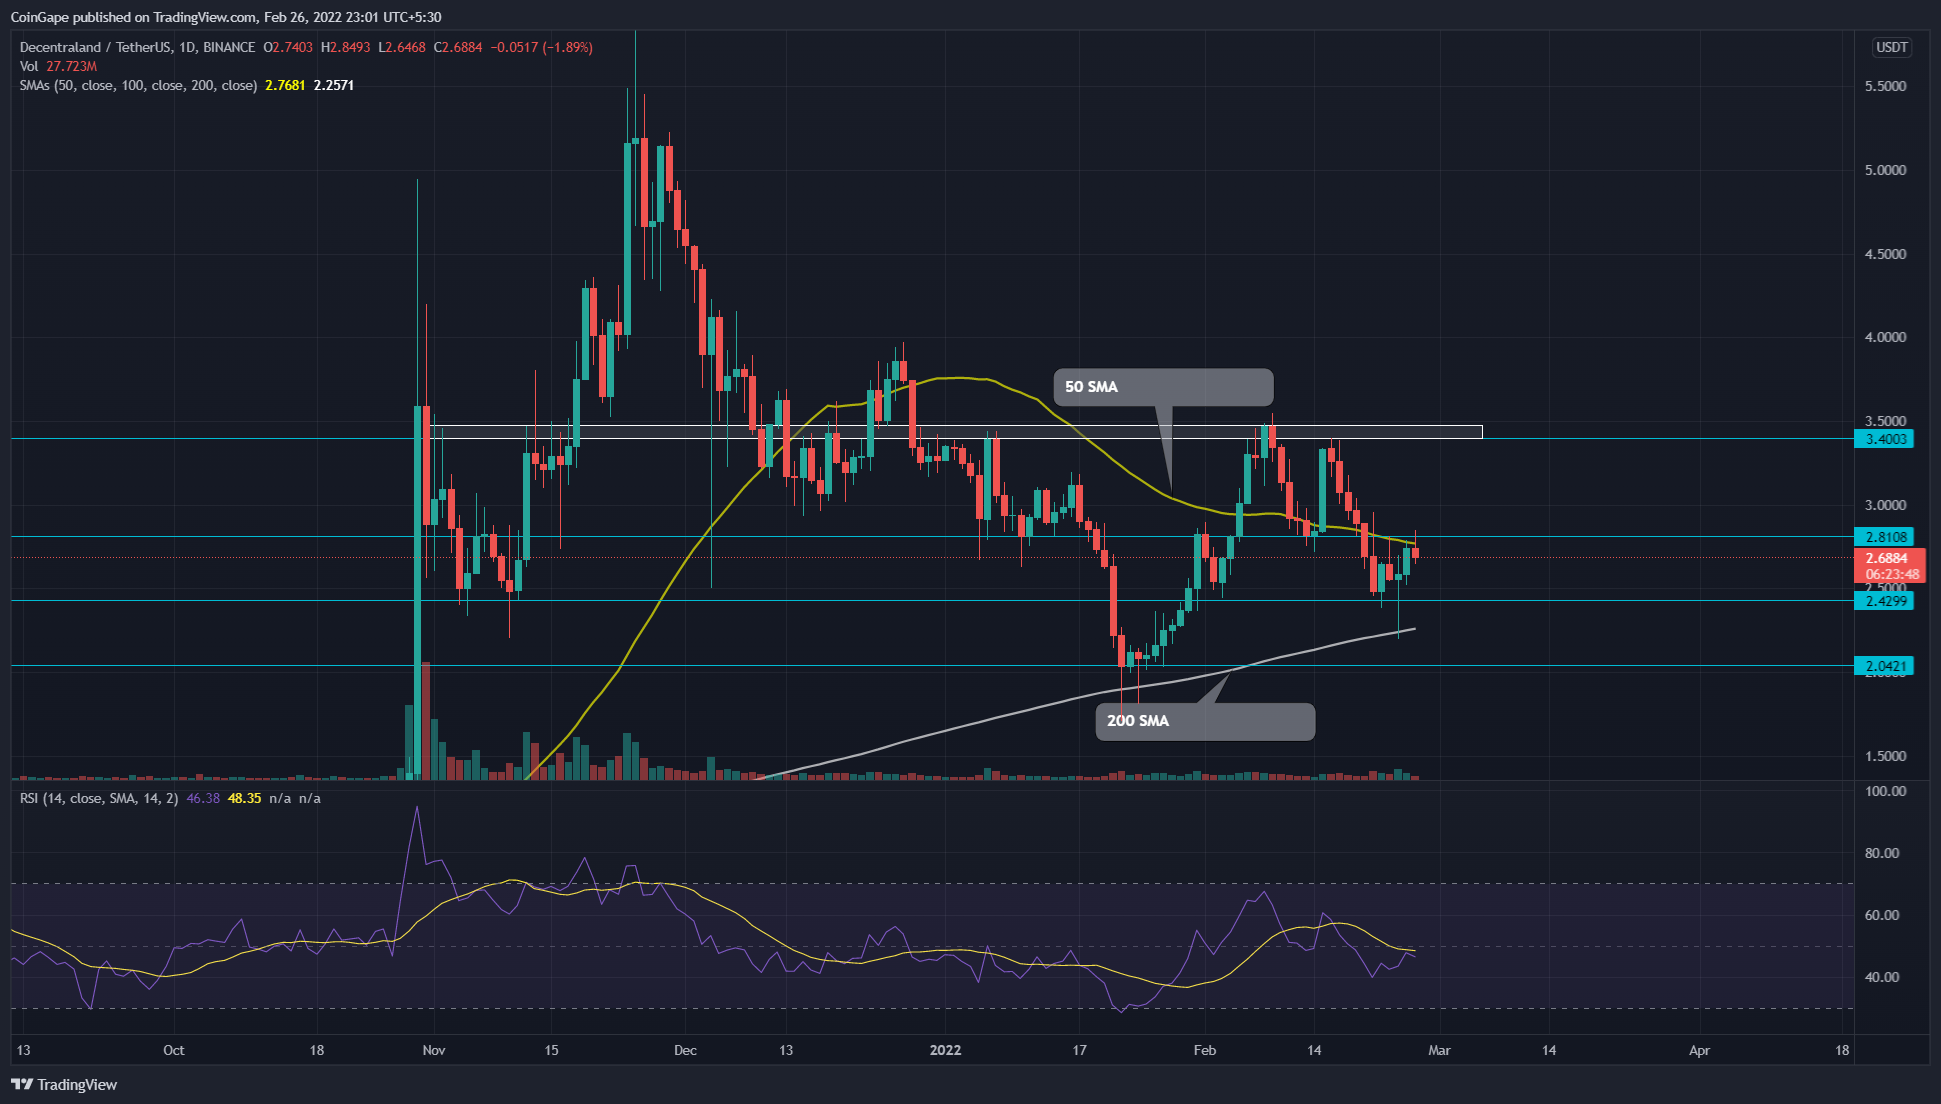
The shared support of $2.42 and the 200-day SMA prevented the extending loss in Decentraland (MANA) price. On February 24th, the 15% long-tail rejection on this support indicates intense demand pressure. The following rally struggles at the immediate resistance of $2.8, suggesting a downtrend continuation.
Key technical points:
- The MANA chart shows a shooting star candle at $2.8 resistance
- The 24-hour trading volume in the Decentraland is $688.1 Million, indicating a 47.6% loss.
Source-Tradingview
The MANA/USD technical chart showed a double top pattern in the daily time frame chart. On February 20th, the sellers gave a decisive breakout from the $0.28 neckline, extending the ongoing selling.
On the following day, the price retested the breached support, showing higher price rejection on the daily candle. This indicates the support has switched to resistance, and sellers sink the altcoin lower. However, things didn’t go as planned, as the buyers immediately rejected the down rally below the $2.43, resulting in a long-tail rejection candle.
The Relative Strength Index(46) slope curving down from the threshold indicates that buyers need more influence before entering positive territory.
The MANA price oscillates between its 50-day and 200-day SMAs. However, the coin price trading above the 200-day SMA maintains a bullish tendency.
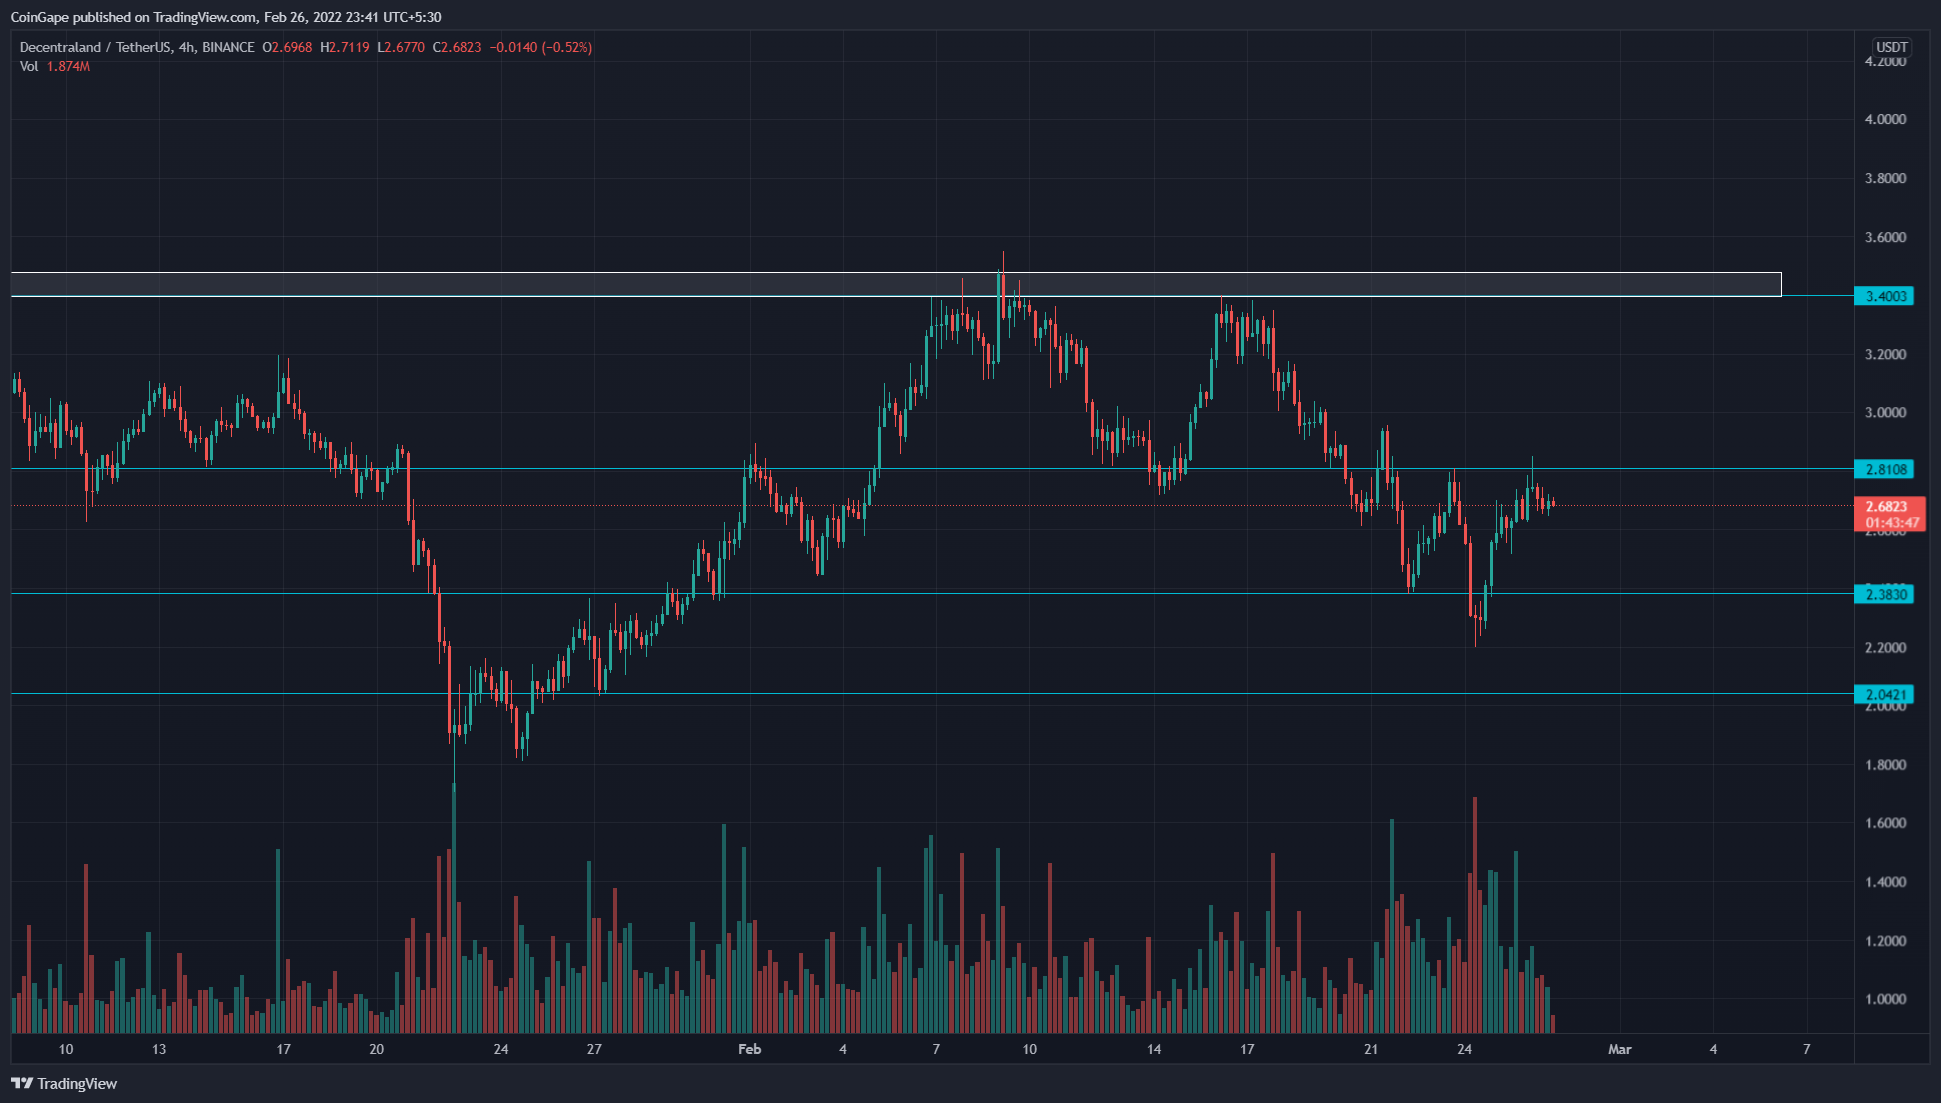
MANA/USDT: 4-Hour Time frame chart
Source- Tradingview
The MANA buyers bounced back from the $2.42 support and drove the altcoin 15% high to retest the $2.8 mark. The higher price rejection on this resistance is evidence that sellers are defending this level. A bearish reversal from this resistance could slump the altcoin to January low support at $2.
However, if buyers push the price above the $2.8 resistance, the traders have a 22% growth opportunity.
- Resistance level: $2.8, and $3.4
- Support level: $2.43, and $2.


