Executive Summary
- The announcement of US tariffs has caused significant disruption to major financial markets, with many experiencing some of their worst trading days since March 2020.
- Capital inflows into the major digital assets have ground to a halt, causing major headwinds and a contraction of liquidity.
- However, loss taking events across Bitcoin and Ethereum appear to be reducing in scale with each price leg lower, suggesting investors may be approaching a degree of near-term seller exhaustion.
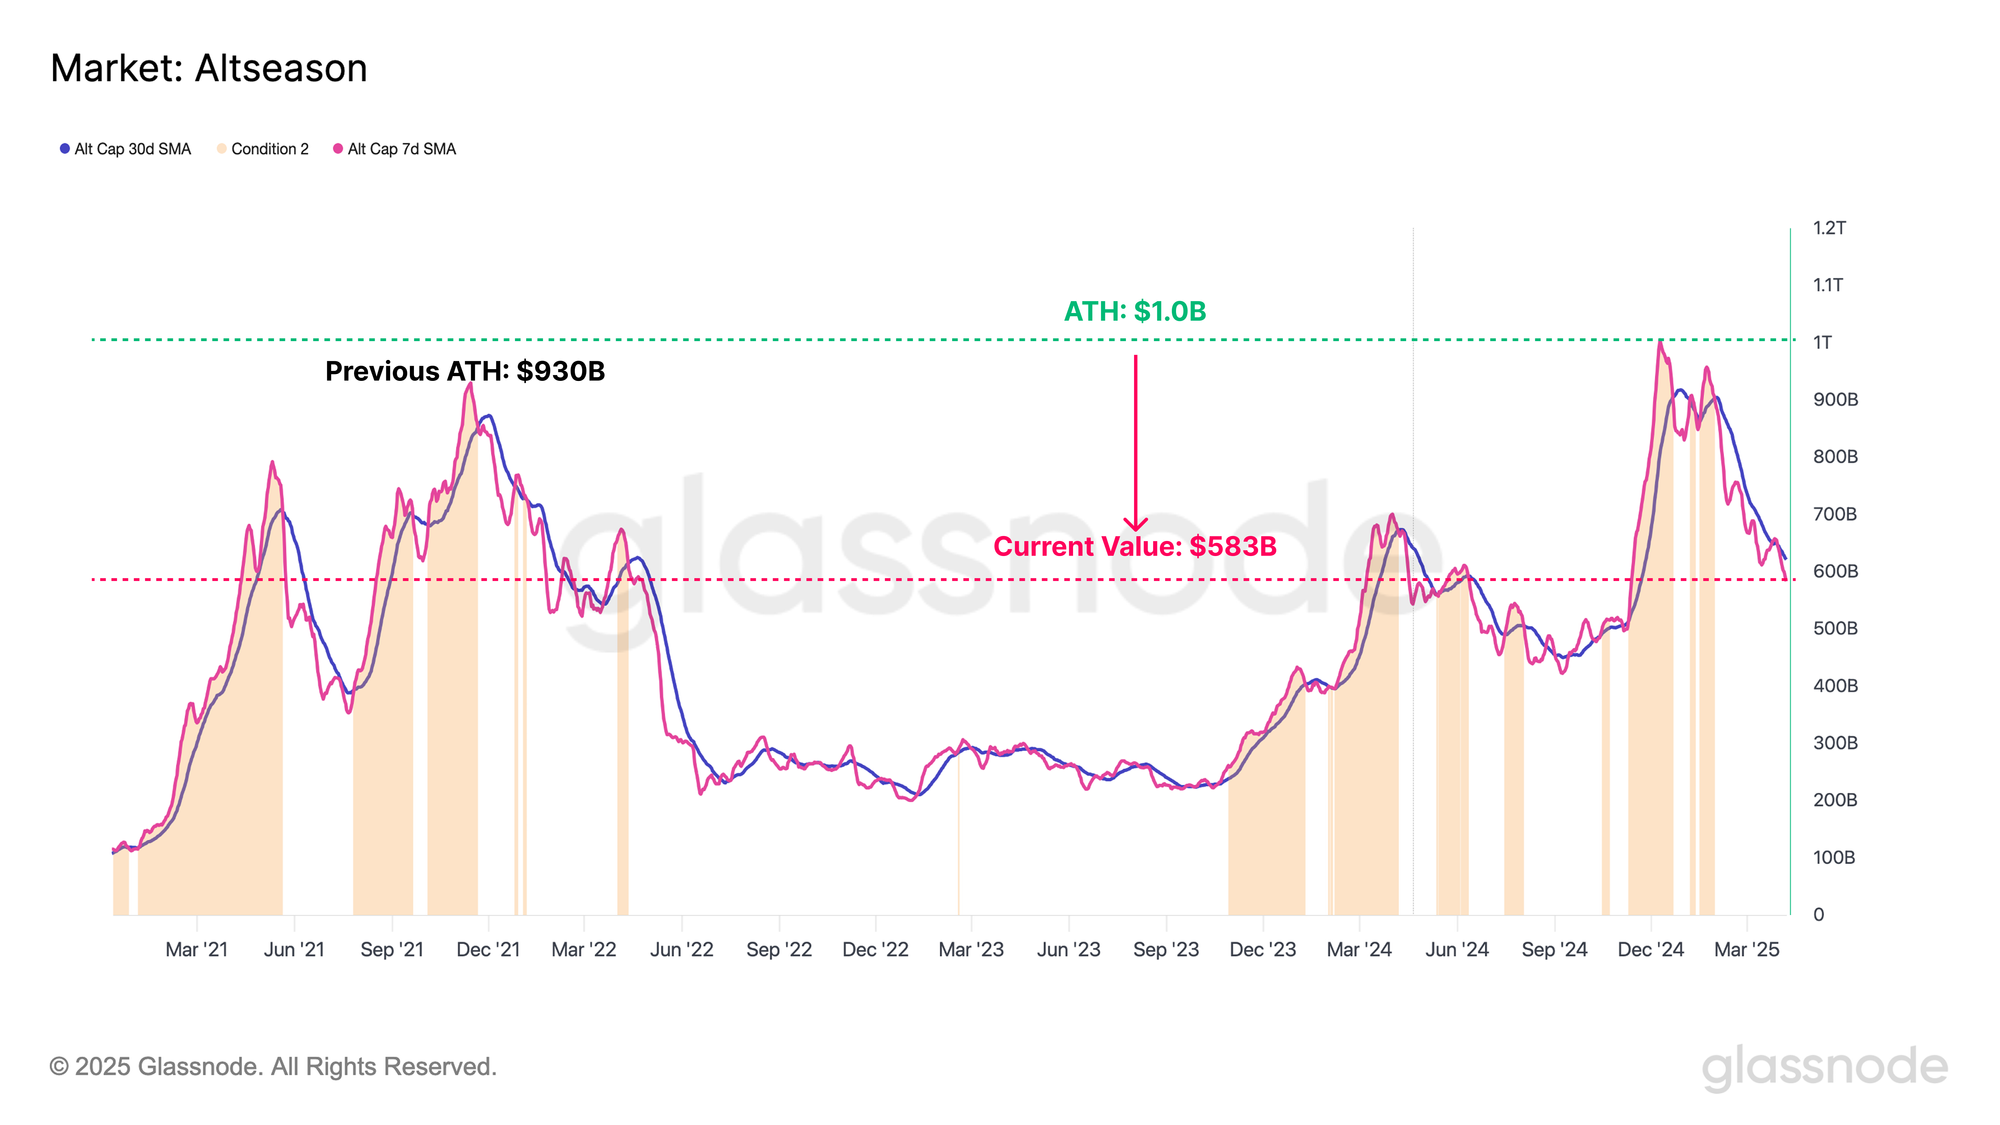
- The collapse across digital assets has been broad-based, with the altcoin market devaluing from $1T in Dec 2024, to a current value of $583B.
- Confluence between on-chain and technical models suggests that $93k is a key area of interest which must be reclaimed before upwards momentum is re-established. On the downside, the $65k to $71k region remains a critical threshold for the Bitcoin bulls to hold.
A Broad Based Decline
The announcement of Trump’s “Liberation Day” Tariffs has sent shock-waves through financial markets, with major indexes experiencing a unilateral decline. The US administration’s policy stance has shifted toward seeking a weaker U.S. dollar, lower interest rates, softer oil prices, and a contraction in fiscal spending. The combination of these factors may result in a marked slowdown in the US economy, and a substantial contraction in overall liquidity.
This tariff-related uncertainty has acted as a catalyst for a widespread risk-off event, catalyzing a sell-off across most major financial indices, with many markets experiencing their worst trading days since March 2020.

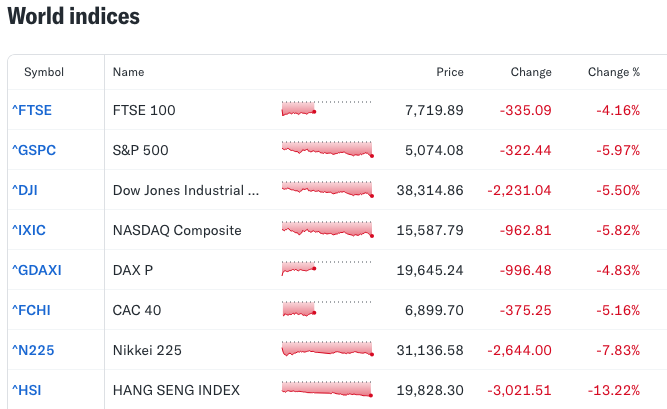
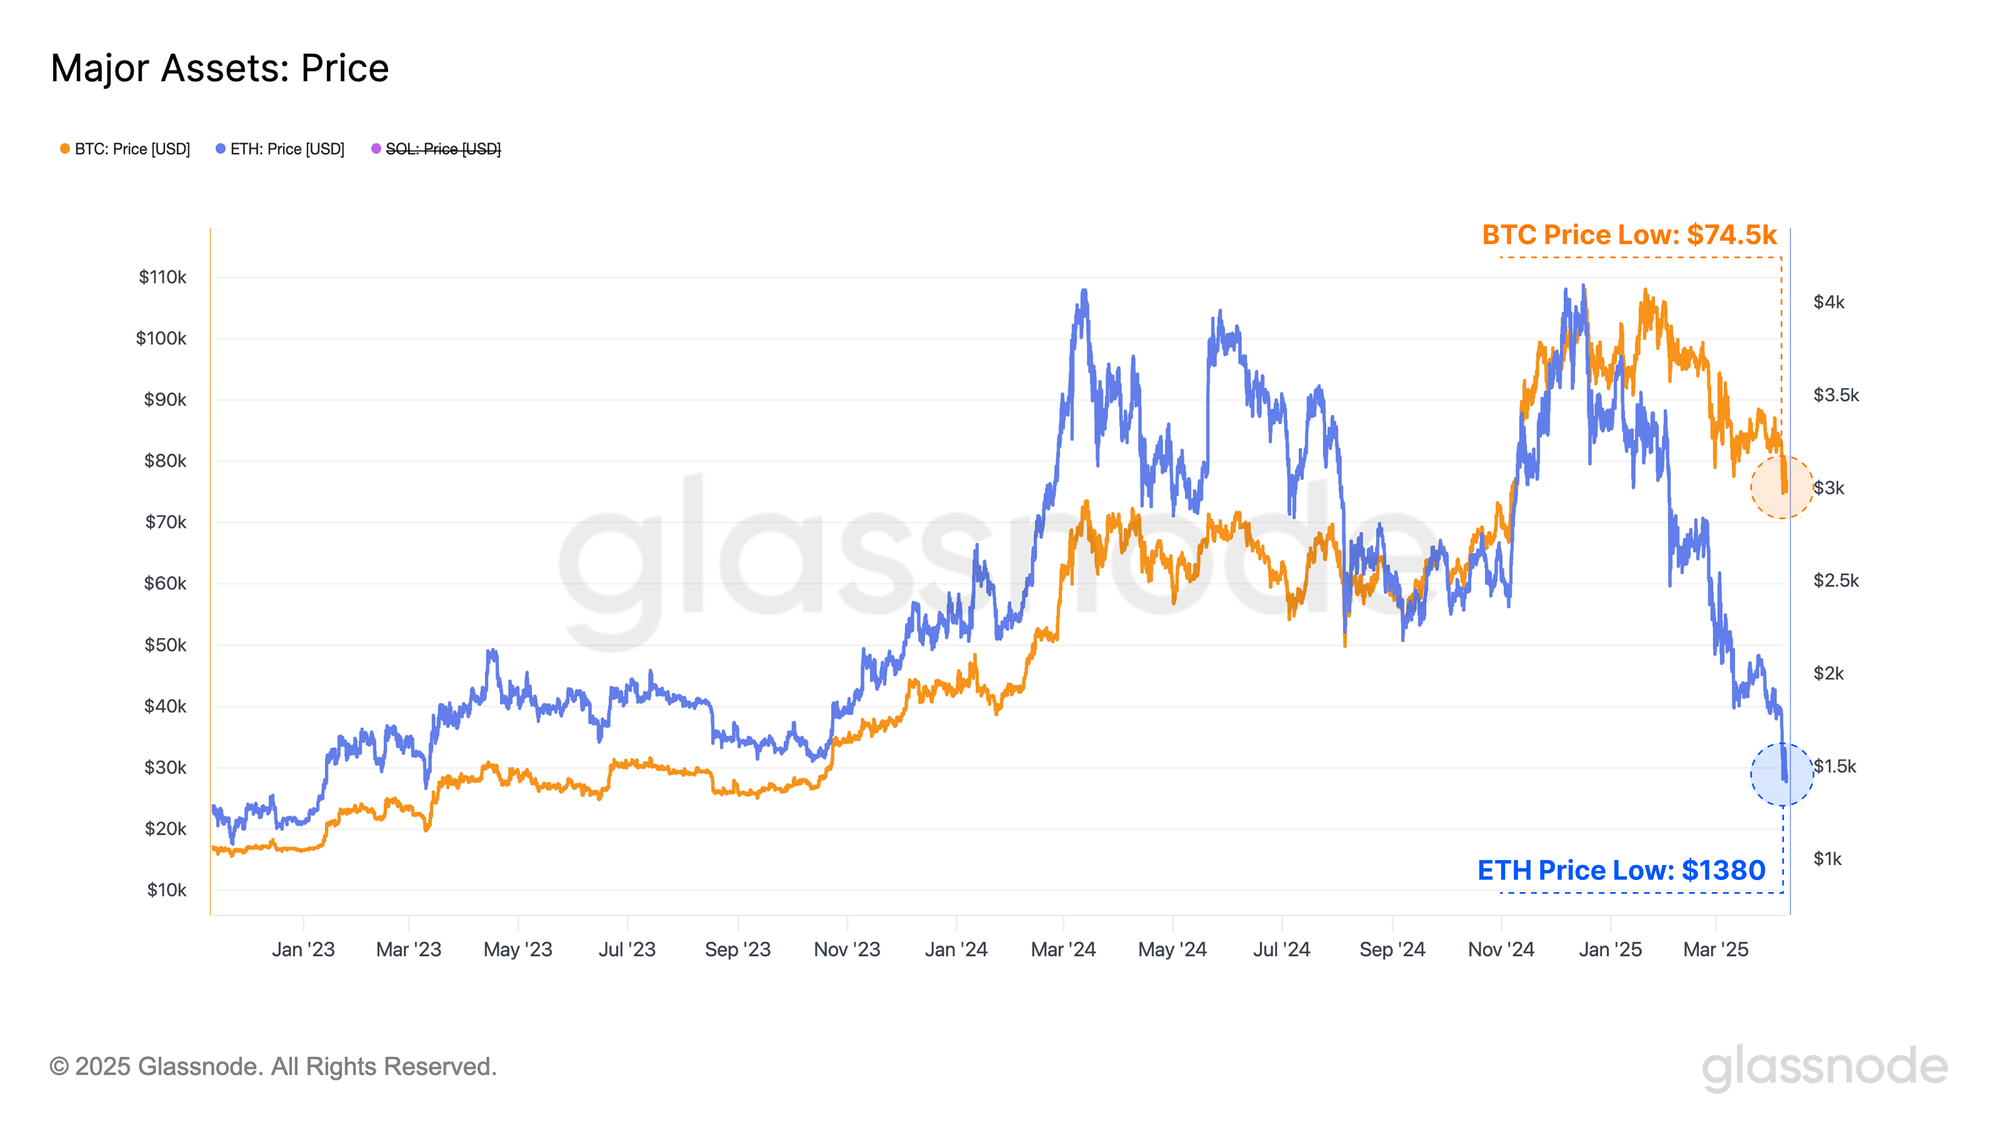
The digital asset market, which tends to have a heightened response to changes in global liquidity, has not escaped the drawdown, with many digital assets experiencing heavy double digit percentage point declines in prices.
Bitcoin, the leading digital asset, experienced a contraction from $83.5k to $74.5k, reflecting a $150B decline in the market cap. Ethereum, the second largest digital asset took even more of a beating, with the ETH price falling from $1800 to $1380, resulting in a market cap contraction of $40B.
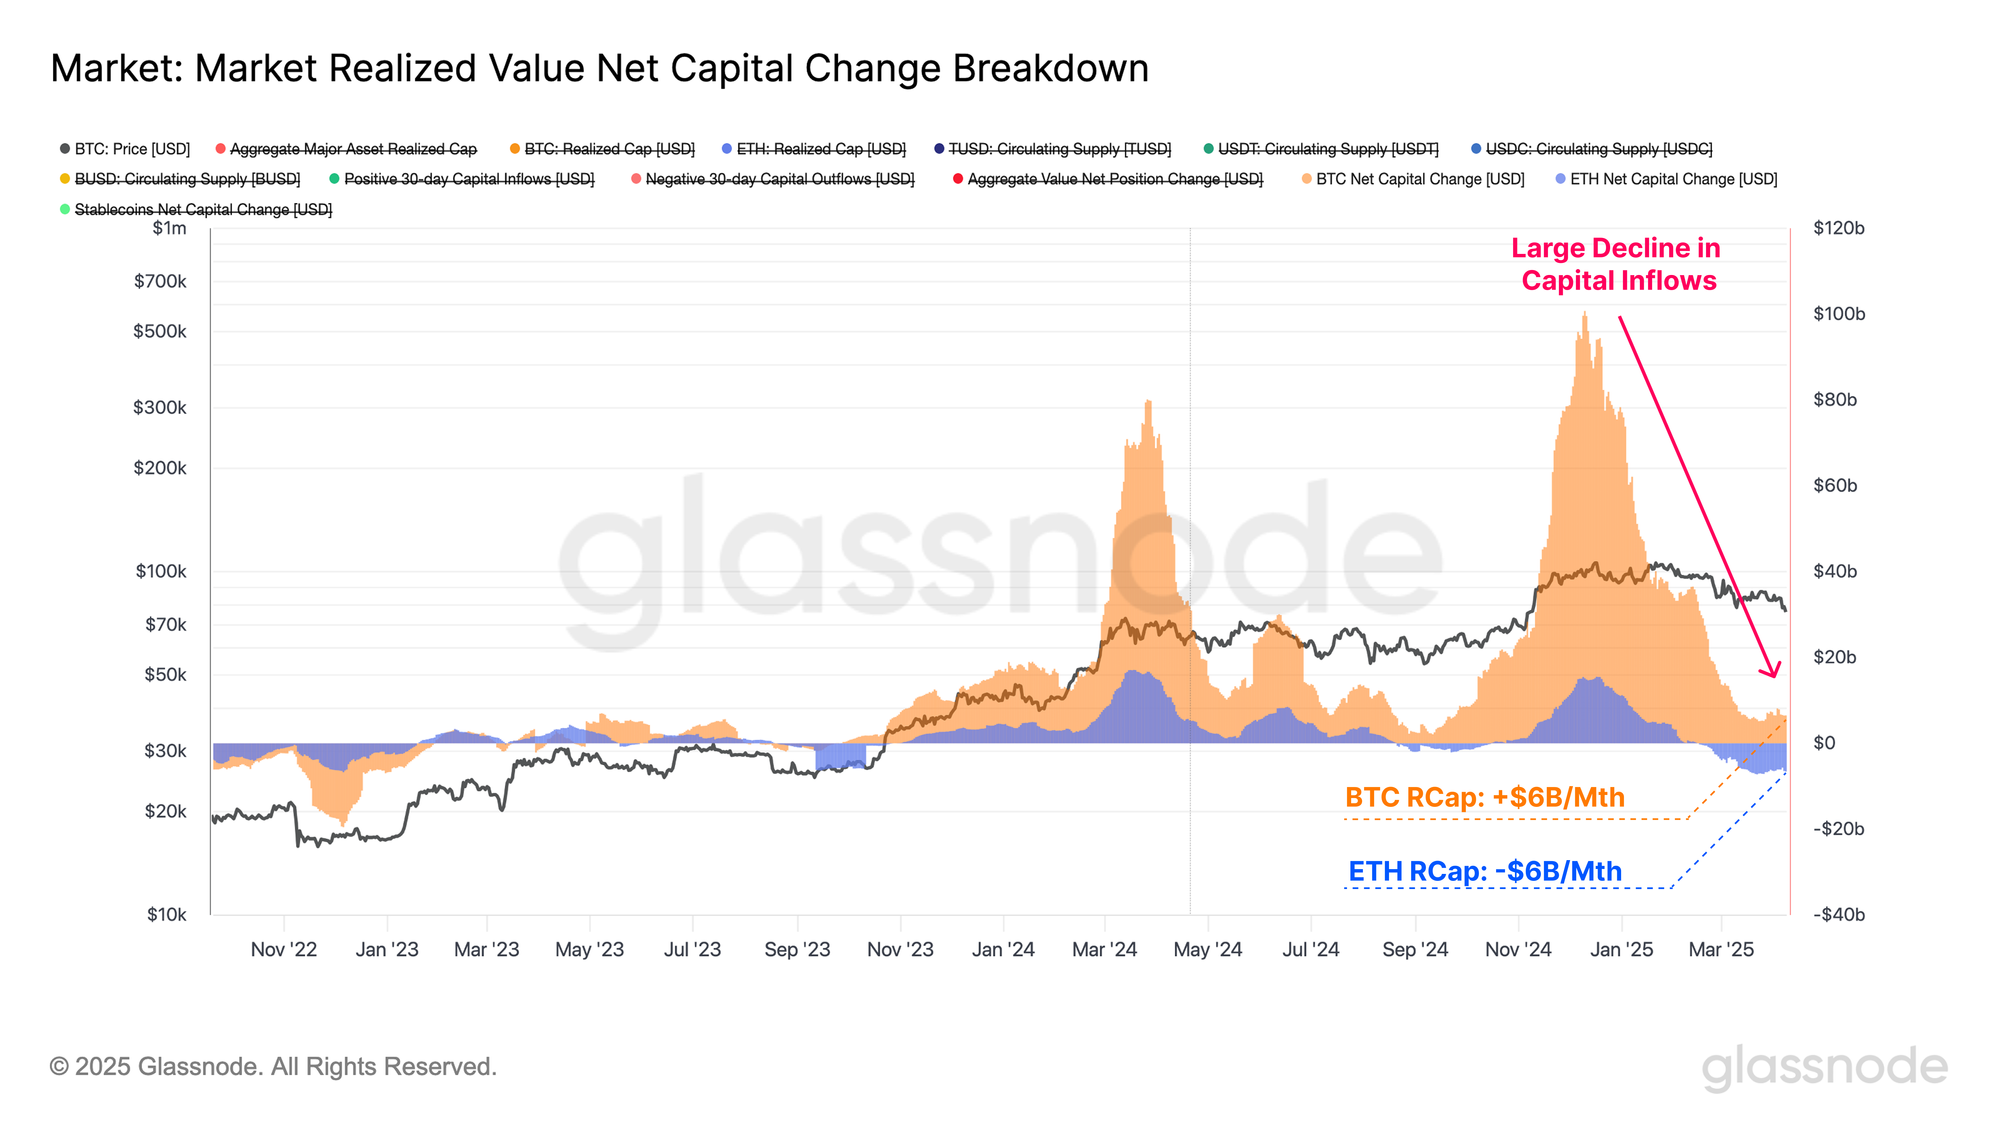
Across both major assets, there has been a clear reduction in capital inflows since the start of the year. This is largely reflected within the 30-day Realized Cap change, which assesses the monthly change in the assets net capital flow.
- Bitcoin peaked at a capital inflow rate of $100B/mth, which has now contracted to +$6B/mth.
- Ethereum peaked at a capital inflow rate of +$15.5B/mth, and is now experiencing a capital outflow of -$6B/mth.
Net capital flows across the Bitcoin network are beginning to grind to a halt, suggesting a lack of fresh capital entering the asset to support higher prices. The capital outflows for Ethereum are a result of ETH which was acquired at higher prices, being spent at lower prices, locking in a net capital loss relative to its acquisition price. This generally suggests that Ethereum is experiencing more headwinds relative to Bitcoin, which is being reflected in the weaker price performance.
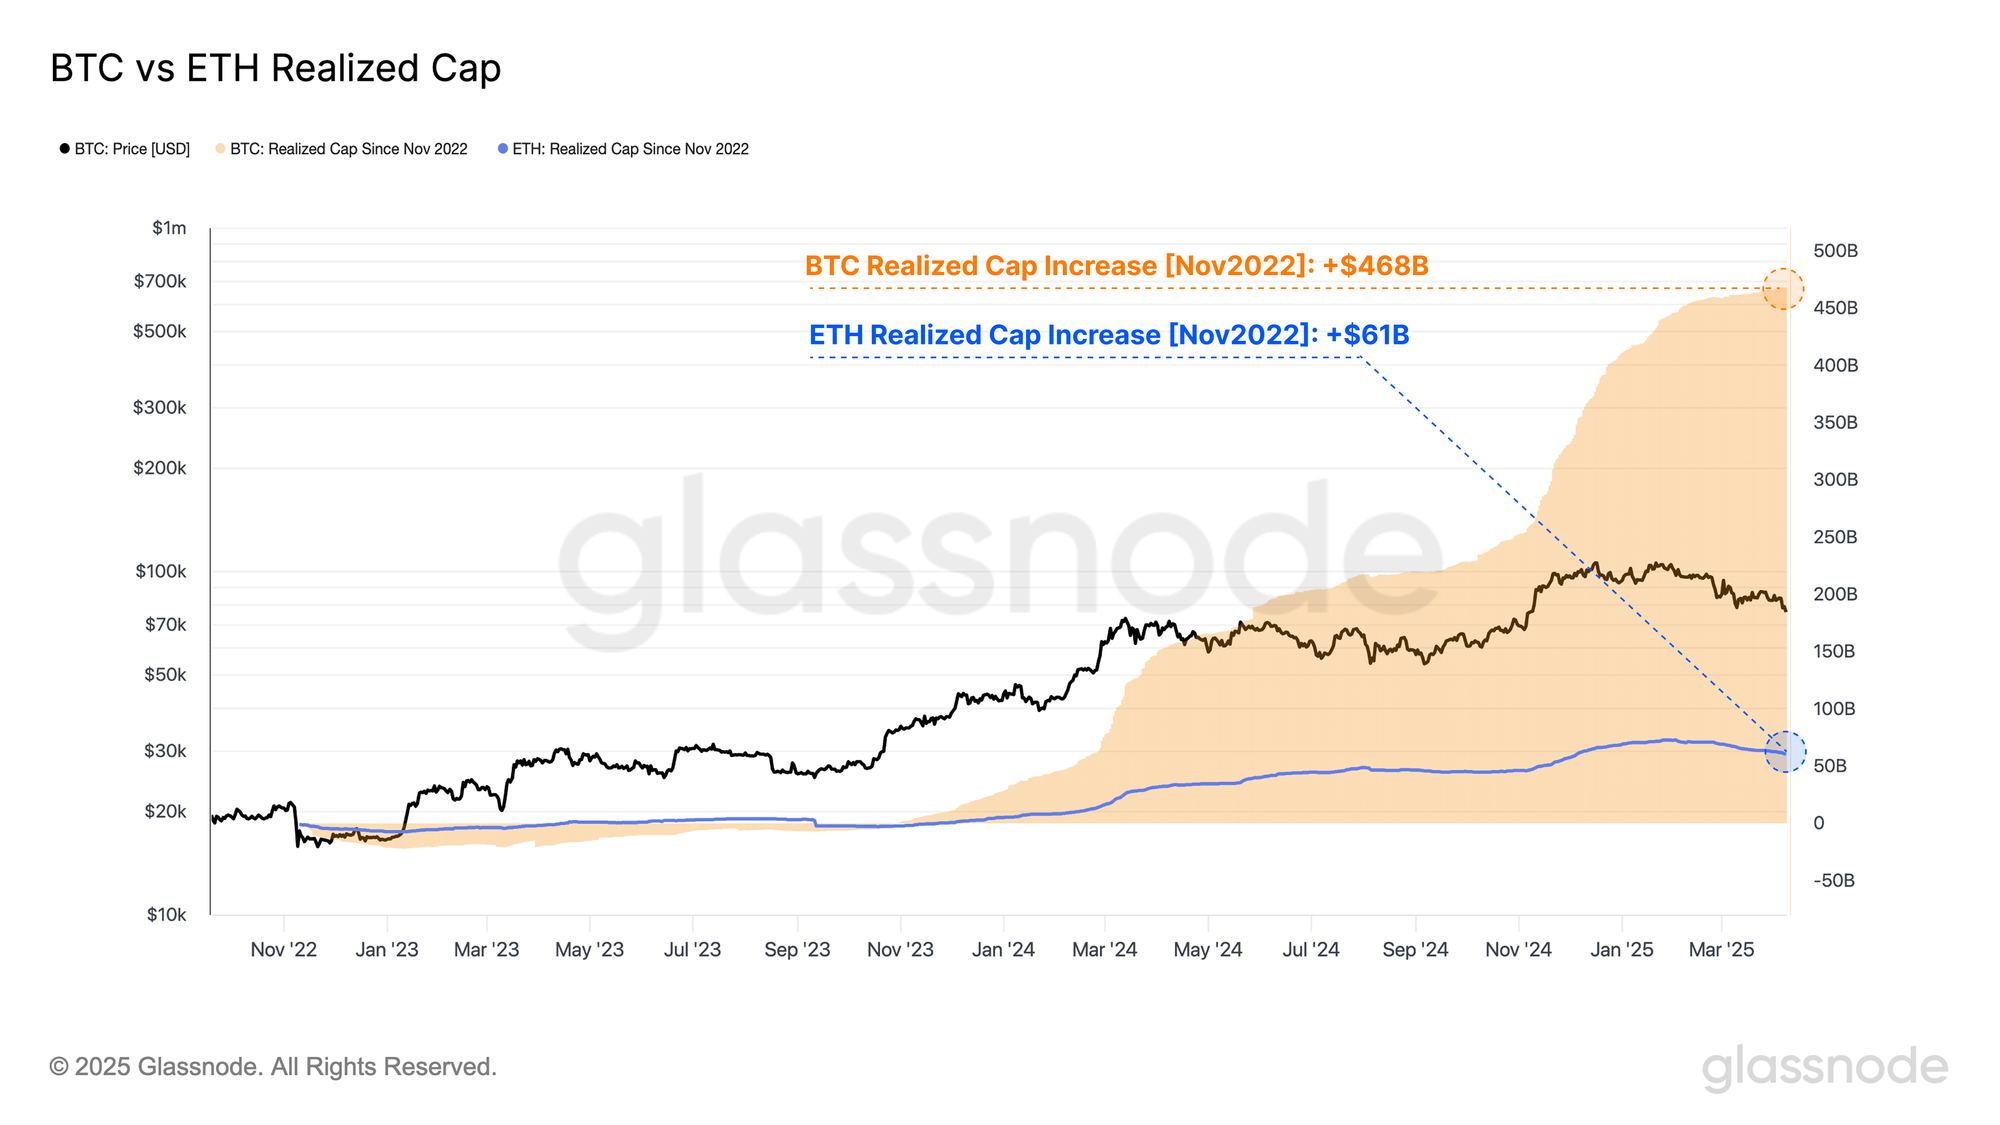
If we anchor the total change in the realized cap since the collapse of FTX in late 2022, we can quantify the magnitude of capital absorbed by both Bitcoin and Ethereum since the cycle low.
- The Bitcoin Realized Cap increased from $402B to $870B, adding +$468B in size (+117%).
- The Ethereum Realized Cap increased from $183B to $244B, adding +$61B in size (+32%).
This disparity in capital inflows between the two assets partly underscores why these assets have experienced diverging performance since 2023. Ethereum has experienced a relatively smaller inflow of demand and fresh capital this cycle, which has resulted in weaker price appreciation and a lack of a fresh ATH, despite Bitcoin prices reaching over $100k in December.
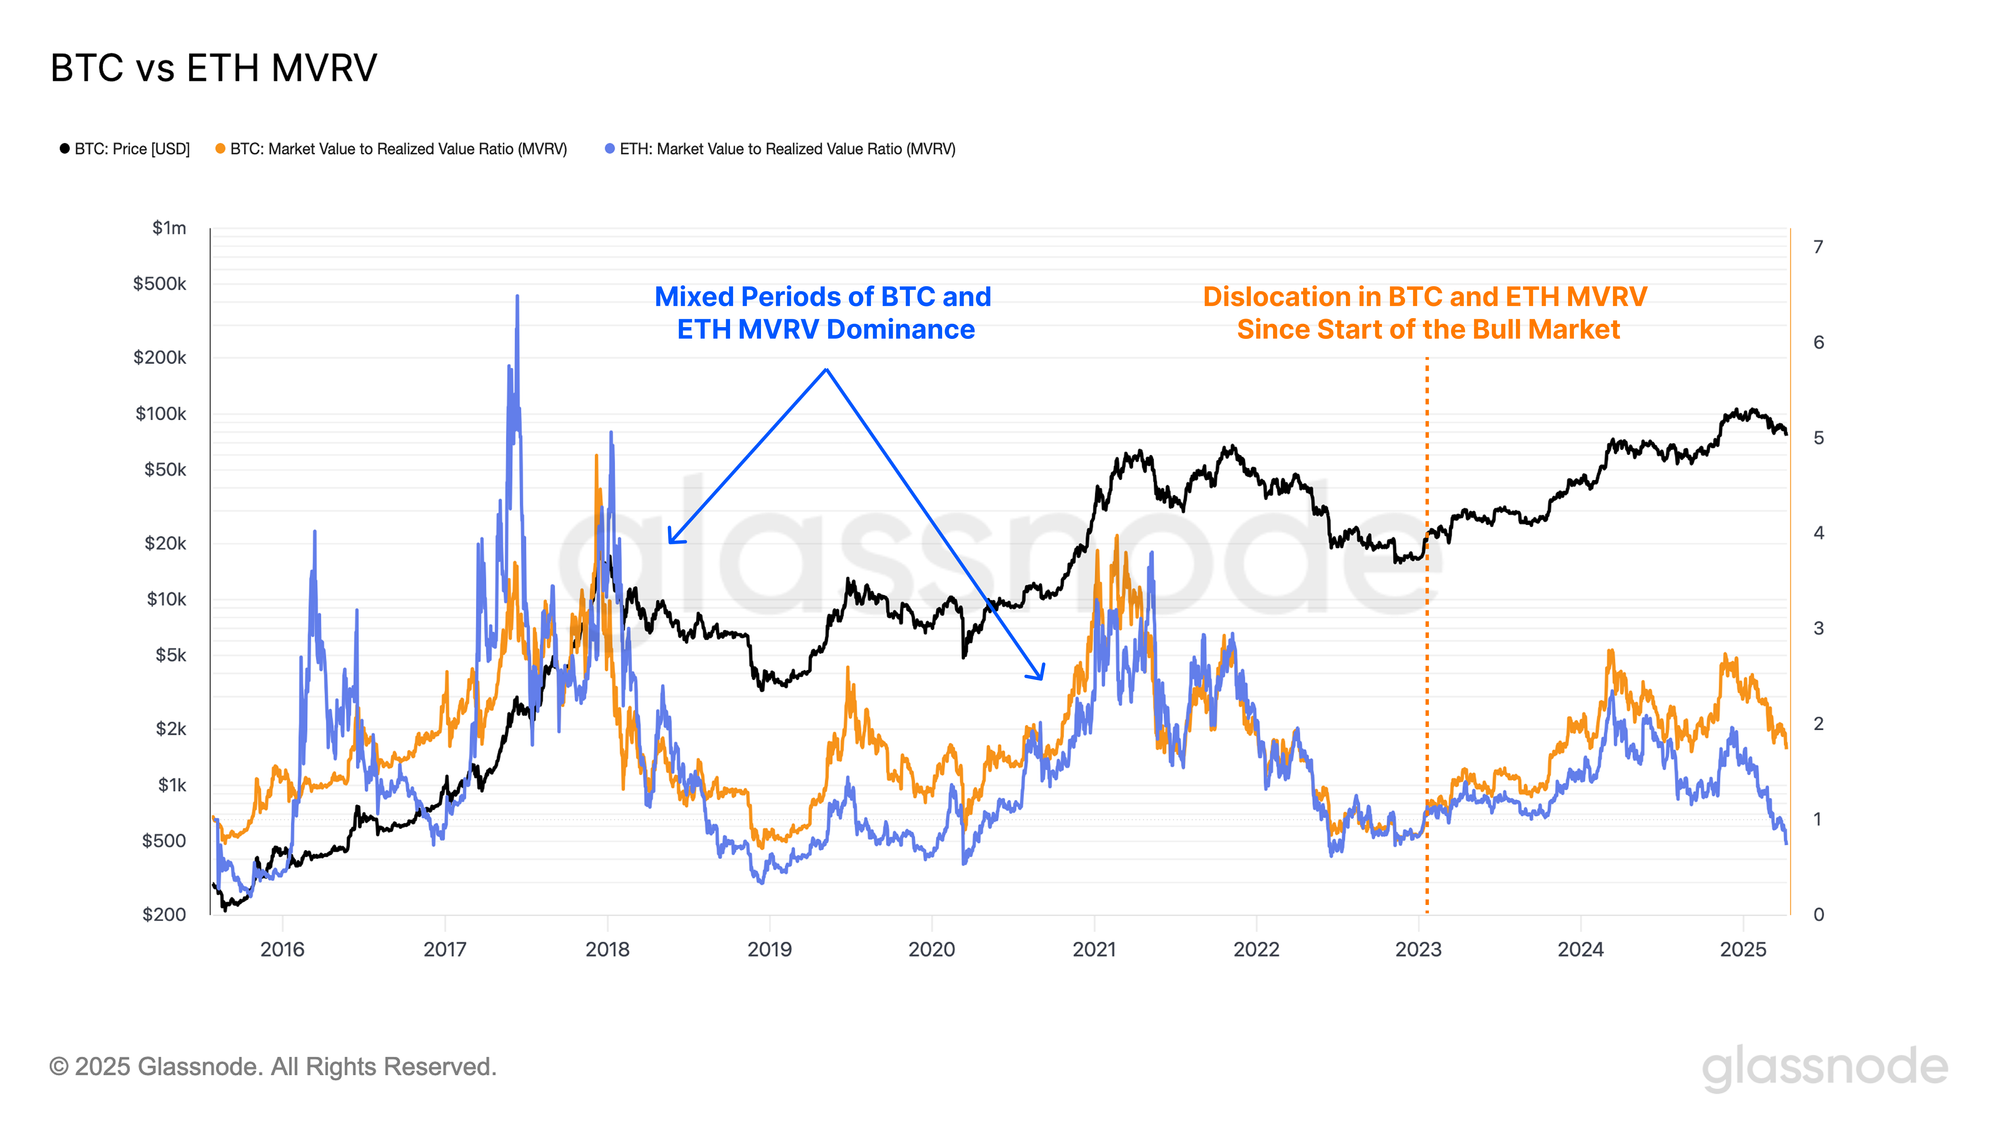
The MVRV Ratio describes the ratio between the spot price and the realized price, gauging the magnitude of unrealized profit held on average for each asset. Values above 1 signal an average unrealized profit, and trading below 1 indicates an unrealized loss.
Again, we can see a notable divergence between Bitcoin and Ethereum MVRV Ratios since the beginning of the bull market cycle in January 2023. Bitcoin investors have consistently held a greater magnitude of unrealized gains compared to their Ethereum counterparts, with the ETH MVRV Ratio dipping back below 1.0 in March.
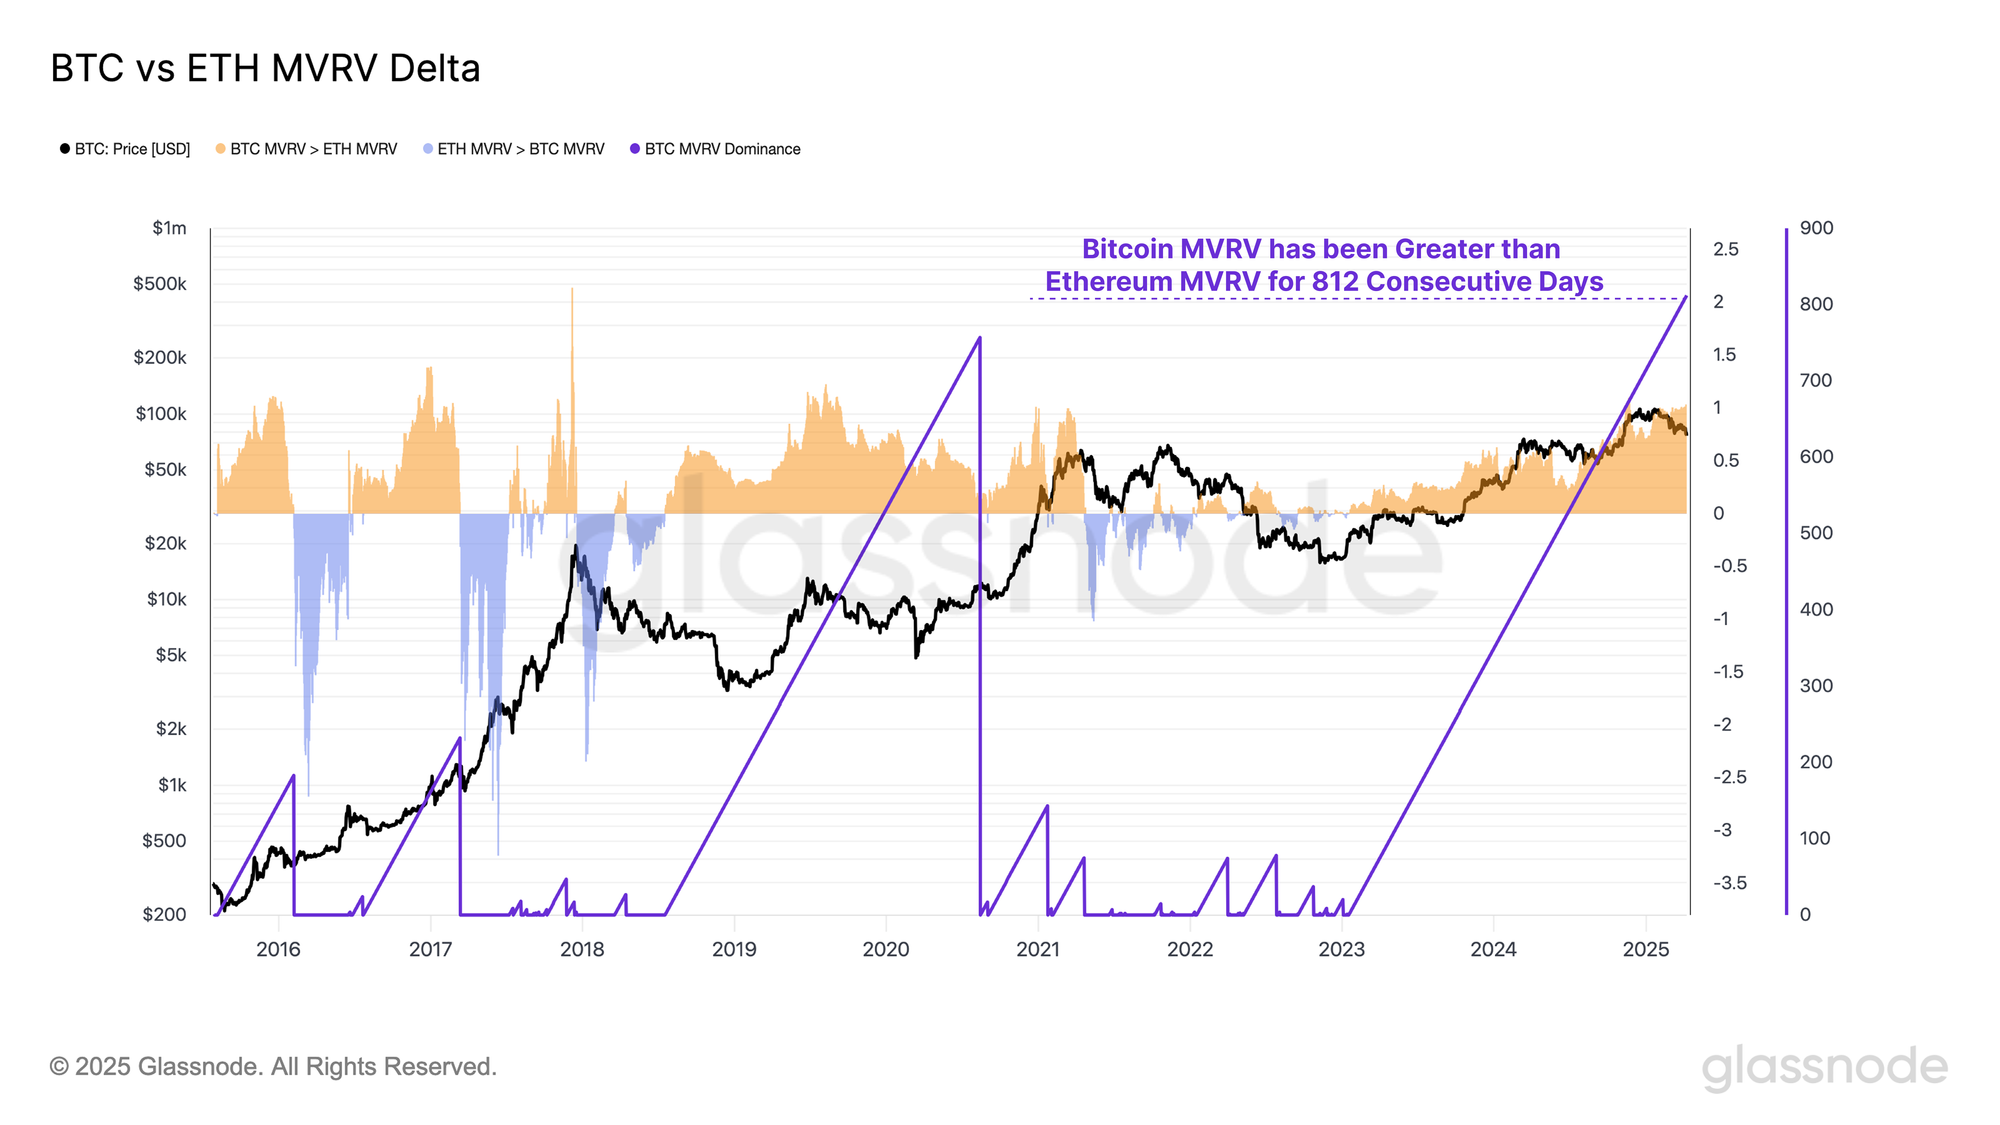
By calculating the difference between the BTC and ETH MVRV Ratios, we can identify periods during which the average Bitcoin holder is outperforming (or underperforming) the average Ethereum holder in terms of paper gains held.
- A positive spread indicates that Bitcoin investors, on average, are holding greater unrealized profits than their Ethereum investor counterparts.
- A negative spread implies higher average profitability amongst Ethereum investors.
As previously noted, Bitcoin investors have maintained a higher average profitability relative to Ethereum investors since the onset of the current bull market. This trend has now extended for 812 consecutive days, marking the longest such period on record.
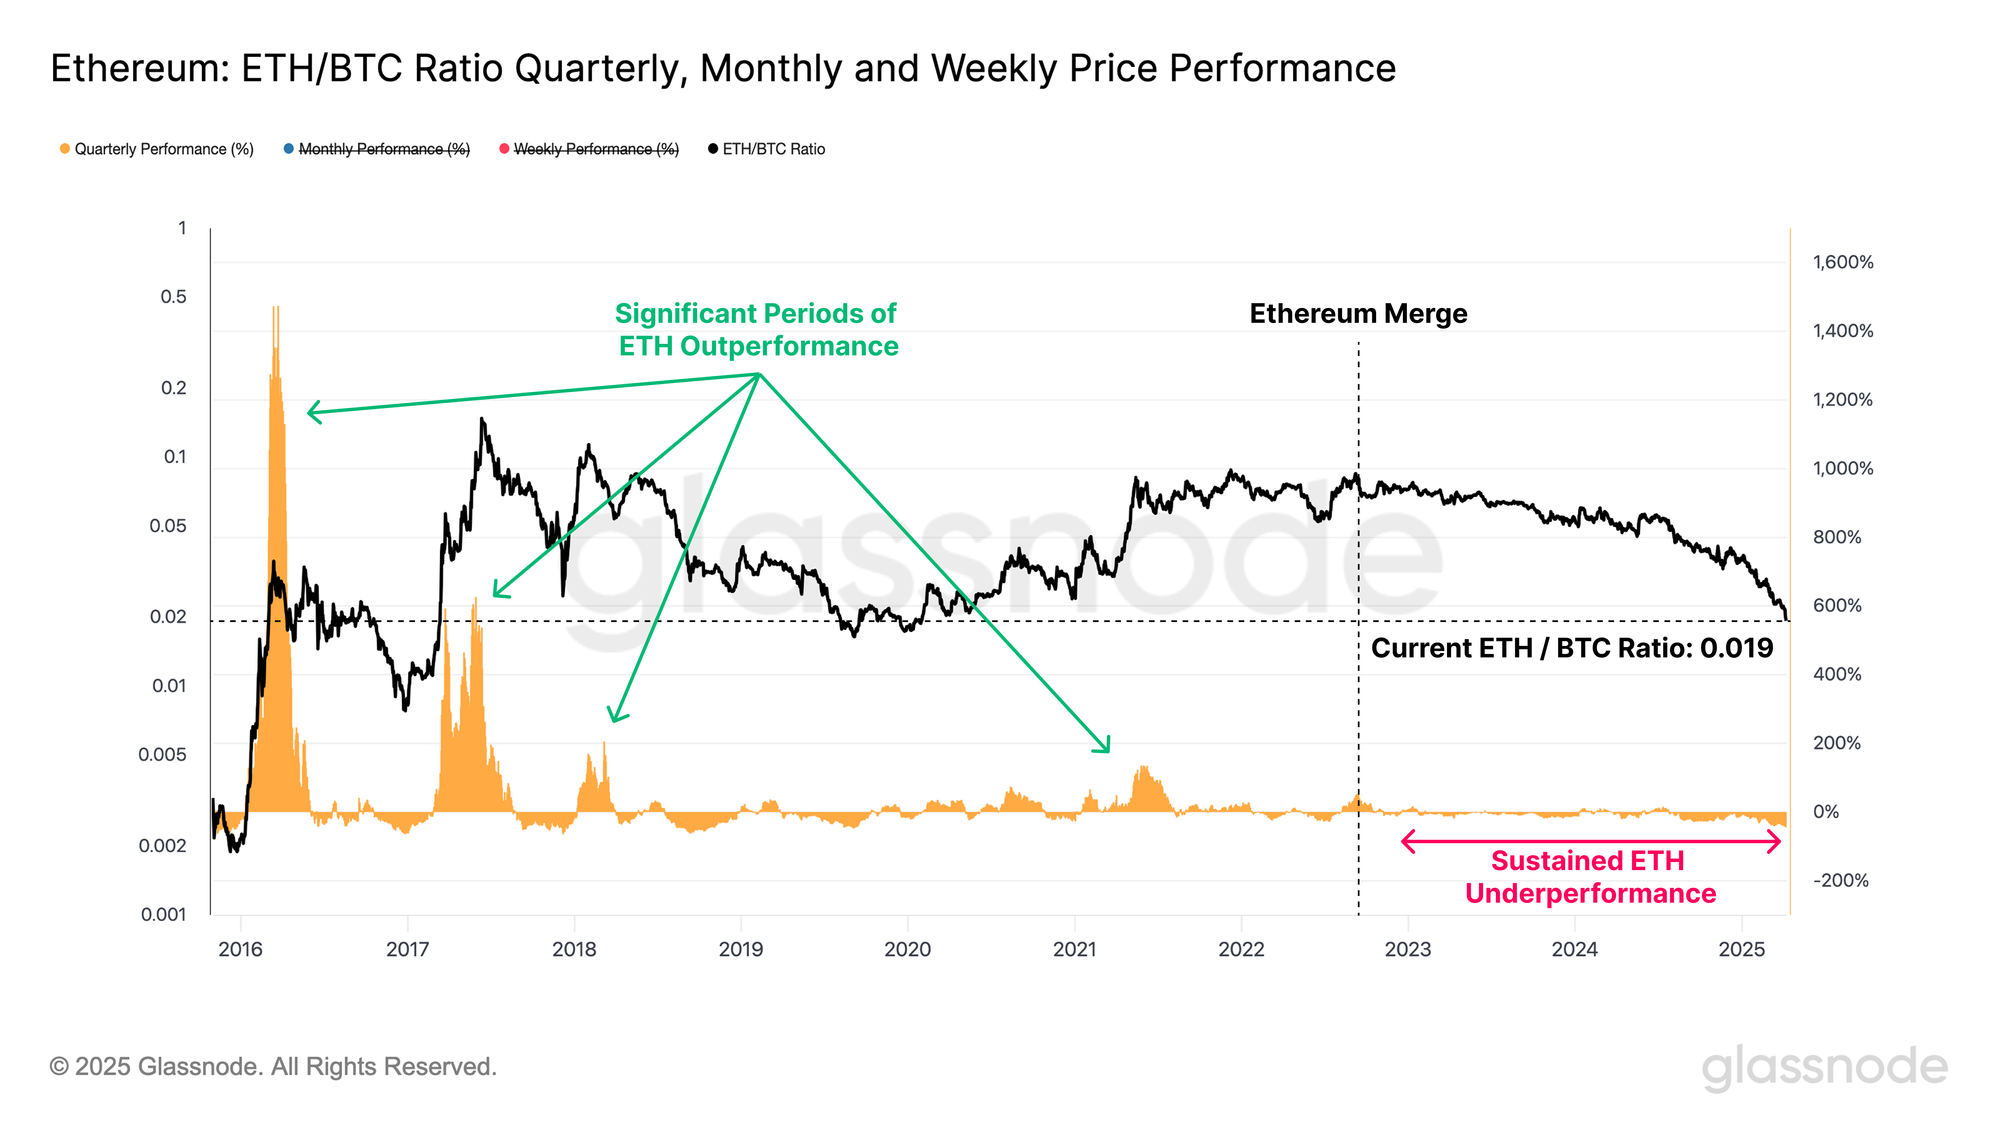
As evidenced, a relatively smaller influx of investor demand has been a primary factor in Ethereums softer performance this cycle. The growing divergence between the two major digital assets is best highlighted by assessing the ETH / BTC price ratio.
When measuring from the Merge in September 2022, the ETH/BTC ratio has collapsed from a value of 0.080 to a current value of 0.0196, reflecting a -75% decline. This is the lowest value of this pair since Jan 2020, with only 500 / 3531 trading days recording a lower value.
We can also see that the current bull market has lacked any extended periods where Ethereum significantly outperformed Bitcoin, which is highly atypical of bull market conditions, and further evidence of an unusual deviation in the historical patterns and performance digital asset investors are used to.
Inspecting Losses
In the wake of an aggressive market drawdown like we have seen this week, it is prudent to inspect the reaction of investors, particularly since bear markets are typically initiated by periods of heightened fear, and substantial losses.
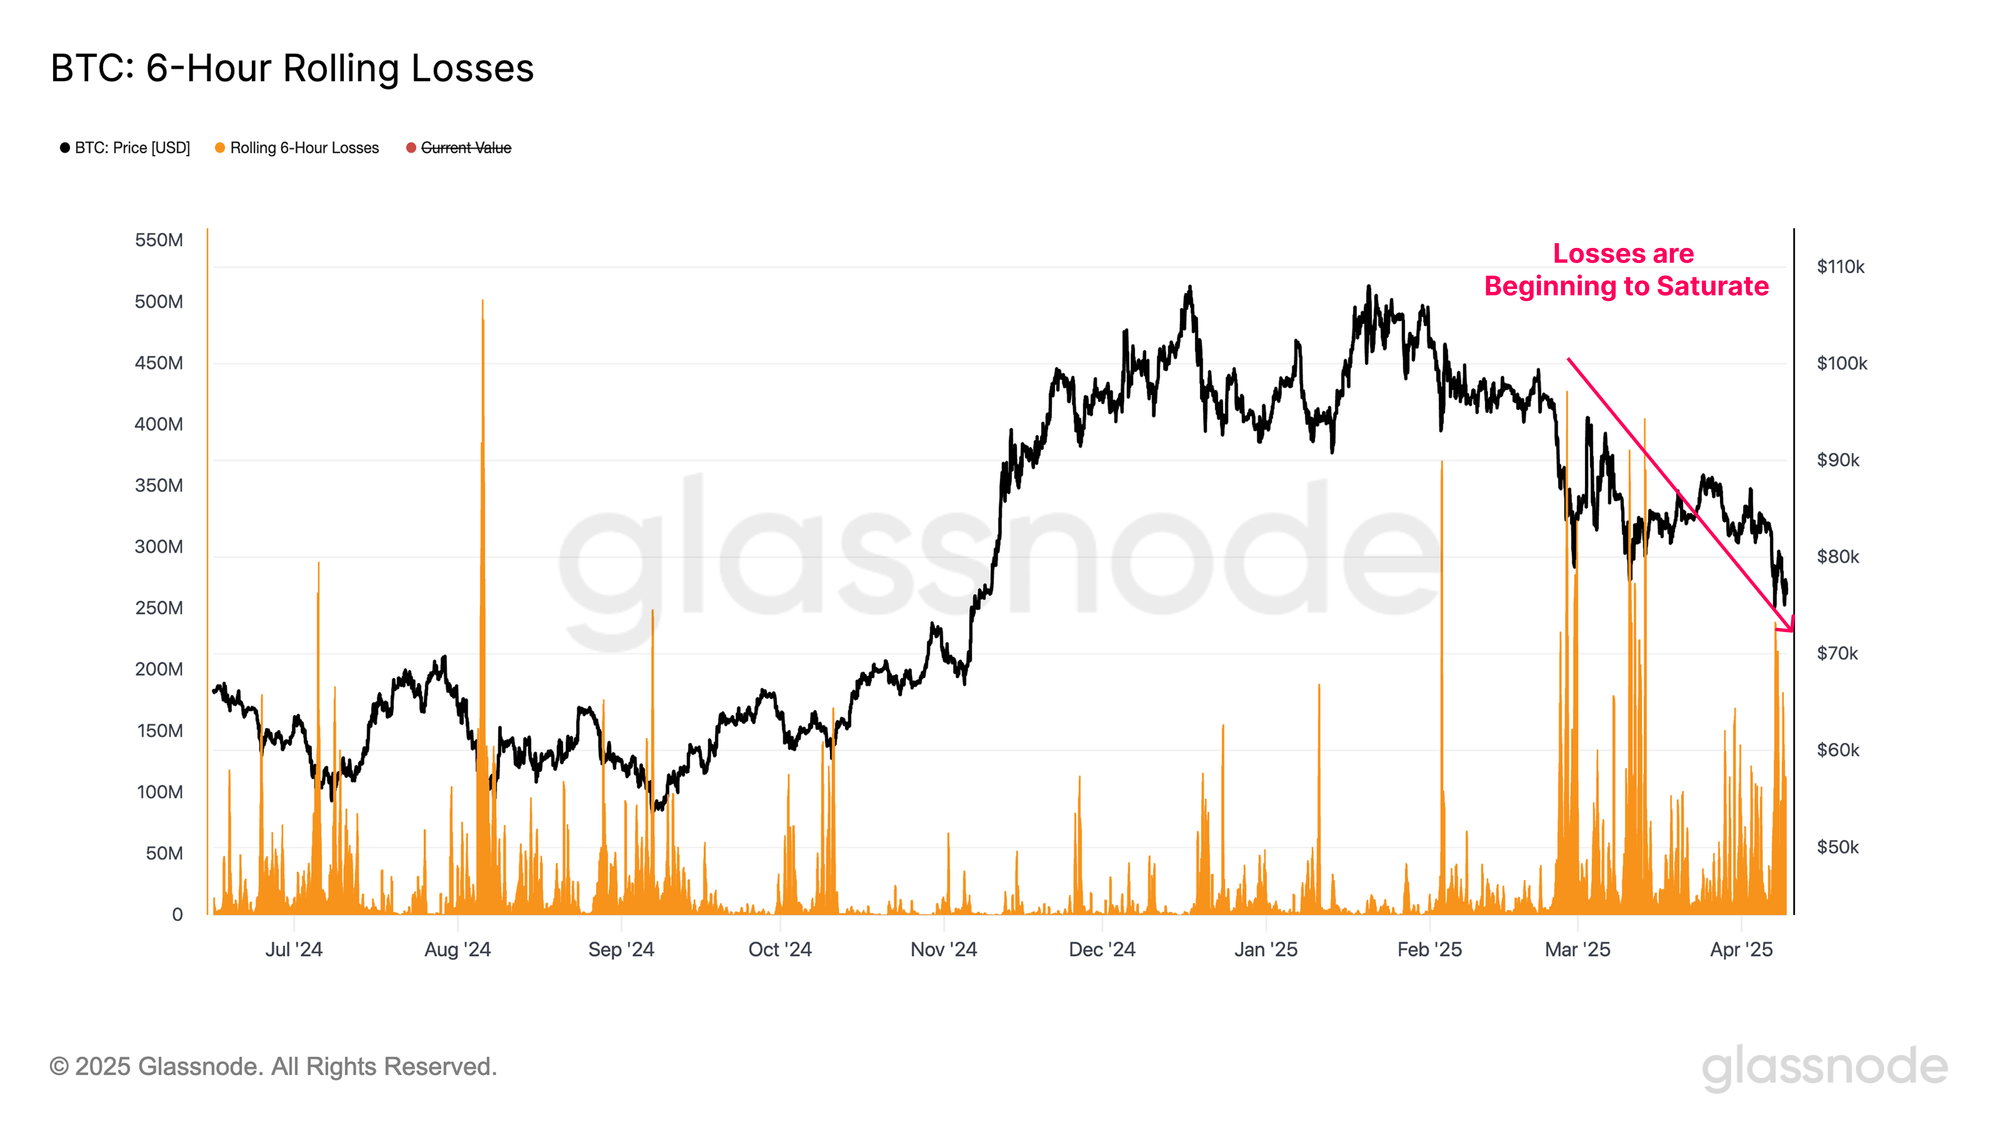
By evaluating the 6-hour rolling window for realized losses, we can better understand the behavior and disposition of market participants within the current downturn.
Investor capitulation events for Bitcoin have been sizeable, with a peak of $240M in losses locked in across the 6-hour window. This is of a similar scale to some of the largest loss events of the cycle.
However, the magnitude of losses realized during this drawdown has started to decrease with each successive price leg lower. This suggests a form of near-term seller-exhaustion may be starting to develop within this price range.
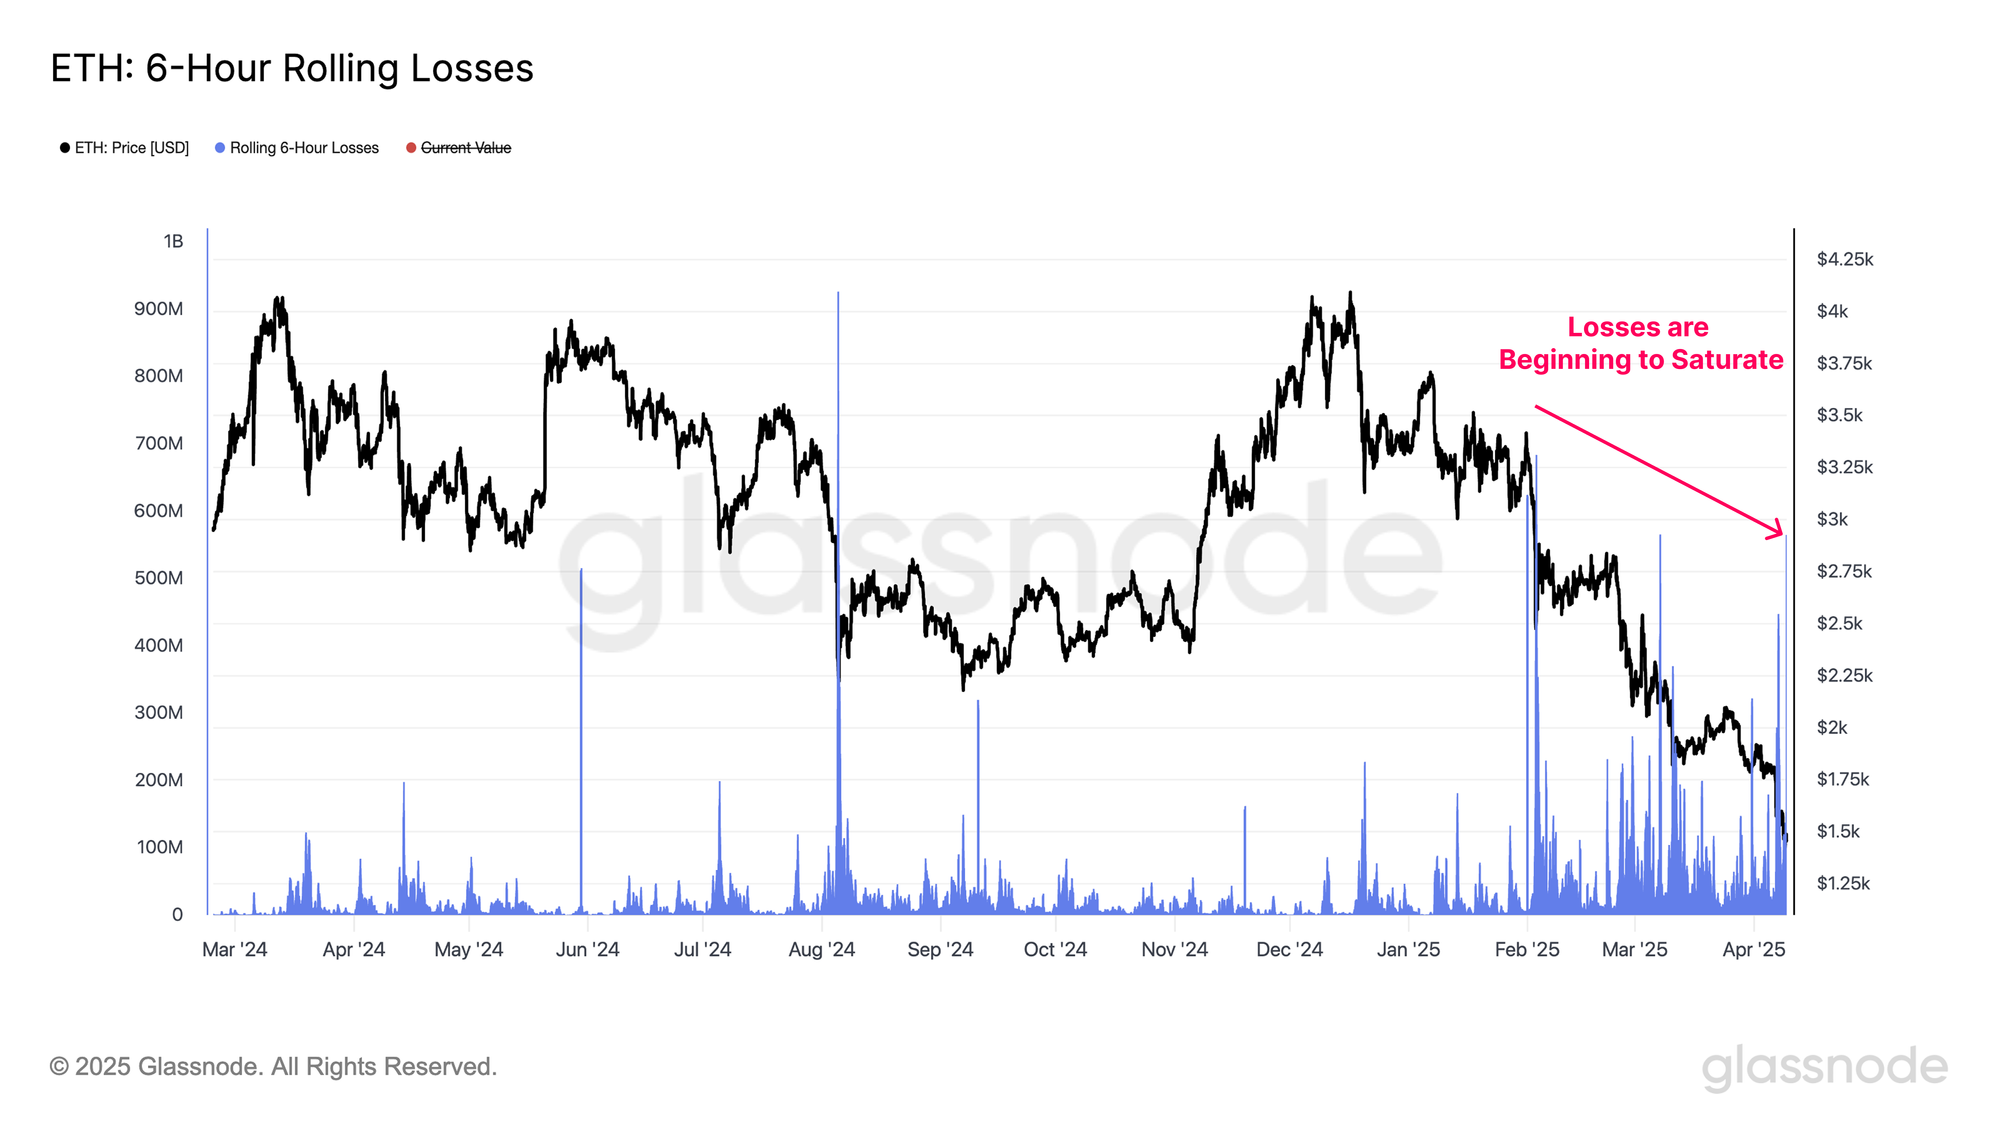
A similar behavior pattern can be seen for Ethereum, with losses locked in throughout the recent drawdown reaching a peak value of $564M. This puts the current sell-off as one of the largest loss taking events since the start of the bull market in Jan-2023.
The severity of realized losses for both assets is decreasing with each leg lower, which perhaps points to investors becoming more accustomed to lower price ranges, and tumultuous market conditions.
Broad Contraction
The prevailing contraction in market liquidity has triggered a significant devaluation across the entire altcoin sector, with assets further out on the risk curve exhibiting heightened sensitivity to liquidity shocks, usually resulting in more severe drawdowns.
As of December 2024, the aggregate altcoin market capitalization (excludes BTC, ETH and Stablecoins) had reached a cycle peak of $1T. Since then, it has retraced sharply, declining to $583B, a drawdown of over -40% across just a handful of months.
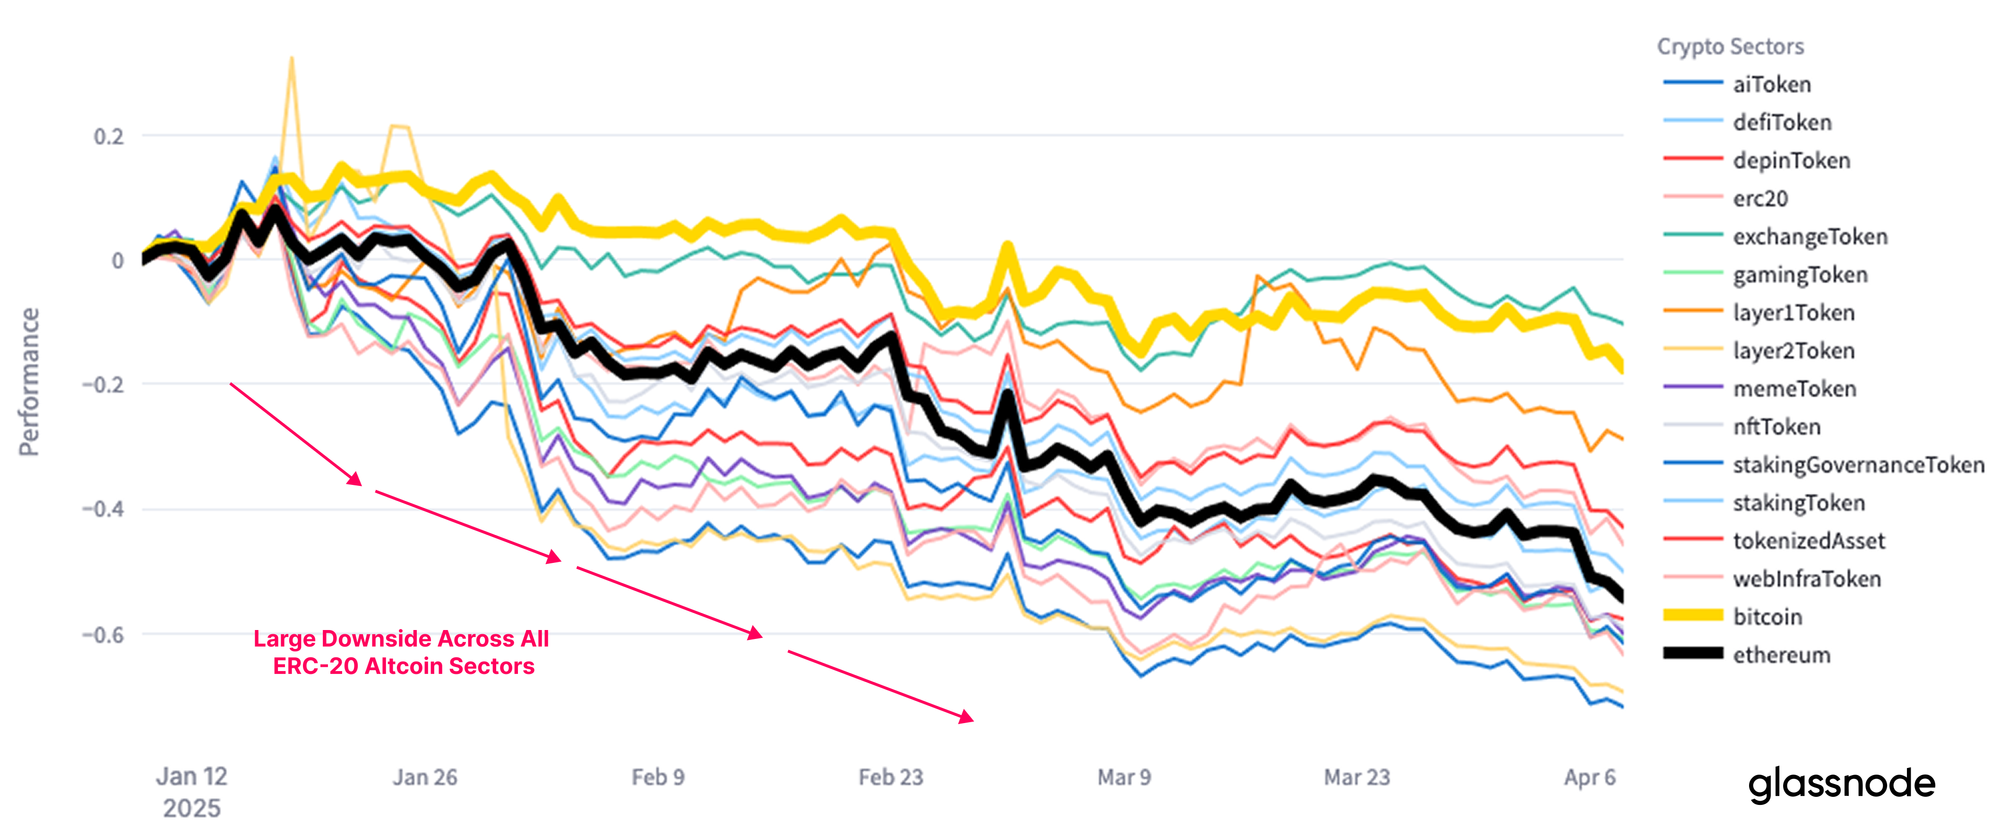
Notably, there has been a lack of idiosyncratic behavior amongst the altcoin subsectors during this drawdown. The contraction appears broad-based, with all sectors experiencing a significant devaluation, with even Bitcoin recording a negative performance over the last 3 months.
Range Navigation
To close out, we will assess how the market is reacting to key technical and on-chain cost-basis levels, which provide tools to help navigate choppy and uncertain market conditions.
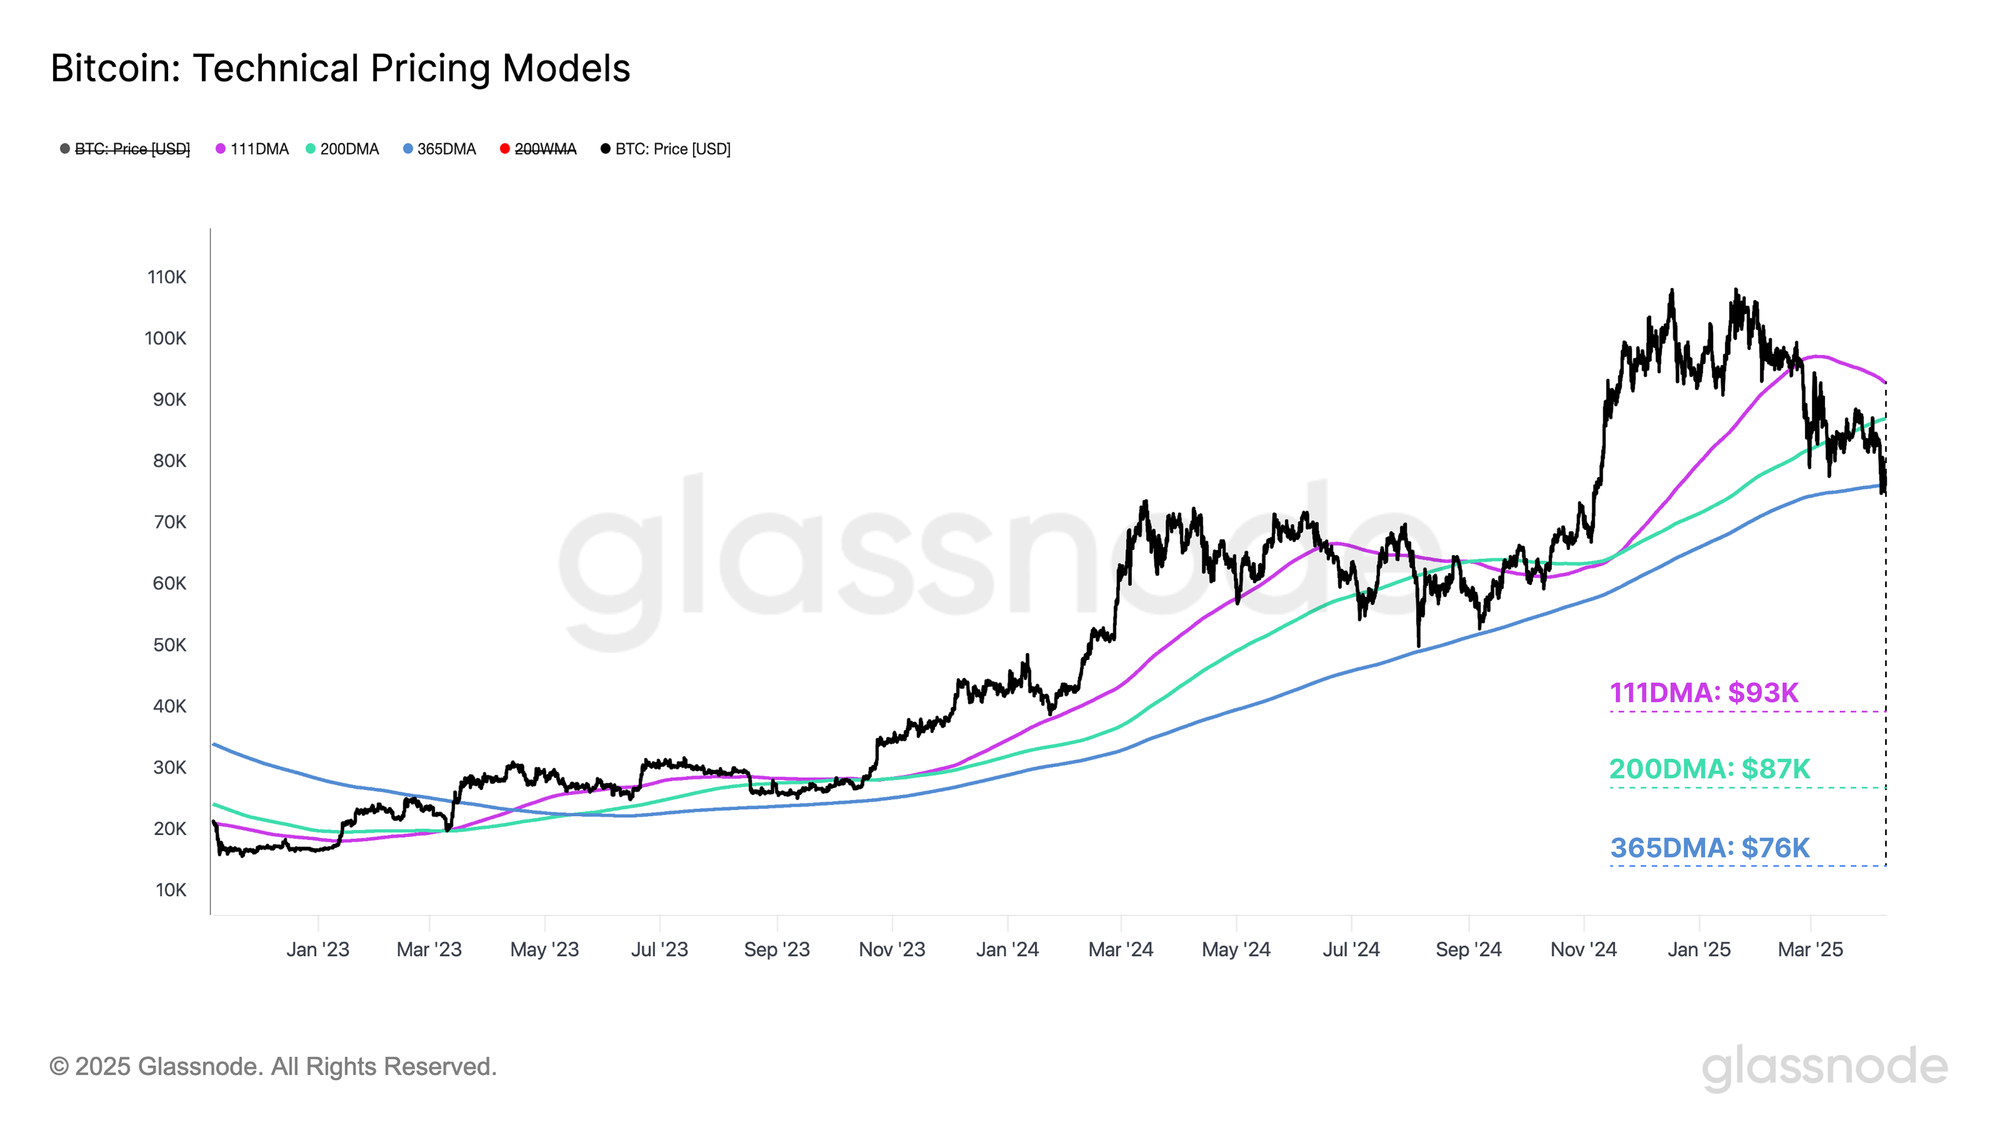
Technical analysis has been a cornerstone tool for investors for many decades, and Bitcoin investors tend to respond to a certain set of moving averages. The 111DMA, 200DMA and 365DMA are commonly used for assessing the momentum of the Bitcoin market.
This can be considered under the following framework
- The sharp sell-off below the 111DMA ($93k) indicated the first major hit to market momentum, with the market marking no significant attempt to reclaim the level.
- Following the first sell-off, price oscillated around the 200DMA ($87k), commonly considered as a bull/bear threshold by many technical analysts. Indecision around this pricing level eventually led to rejection, and the next major price leg lower.
- Most recently, price crashed below the 365DMA ($76k) for the first time since the 2021 cycle. This is a key momentum level that has thus far held as support, but needs to remain as support to avoid further downside momentum from being established.
During bull market uptrends, Short-Term Holder (STH) investors are often responsible for the majority of loss taking events during capitulation events. Changes in their behavior and sentiment can provide critical insight into the severity of market corrections, and how investors are responding to it.
The STH cost-basis has historically functioned as a critical benchmark level for evaluating market momentum during uptrends. We can construct ±1 standard deviation bands around the STH cost basis, which have typically acted as a form of upper and lower bound for local price action.
- Short-Term Holder Cost-Basis +1σ: $131k
- Short-Term Holder Cost-Basis: $93k
- Short-Term Holder Cost-Basis -1σ: $72k
Bitcoin’s initial drop below the Short-Term Holder Cost Basis (STH-CB) signalled the first sign of weakening momentum (alongside the break below the 111DMA). This was confirmed when the price rallied into the underside of this level, and was rejected, reinforcing a shift in investor sentiment.
The spot Bitcoin price is now firmly between the STH-CB and its lower -1σ band, with these levels defining the boundaries of our trading range between $93k and $72k.

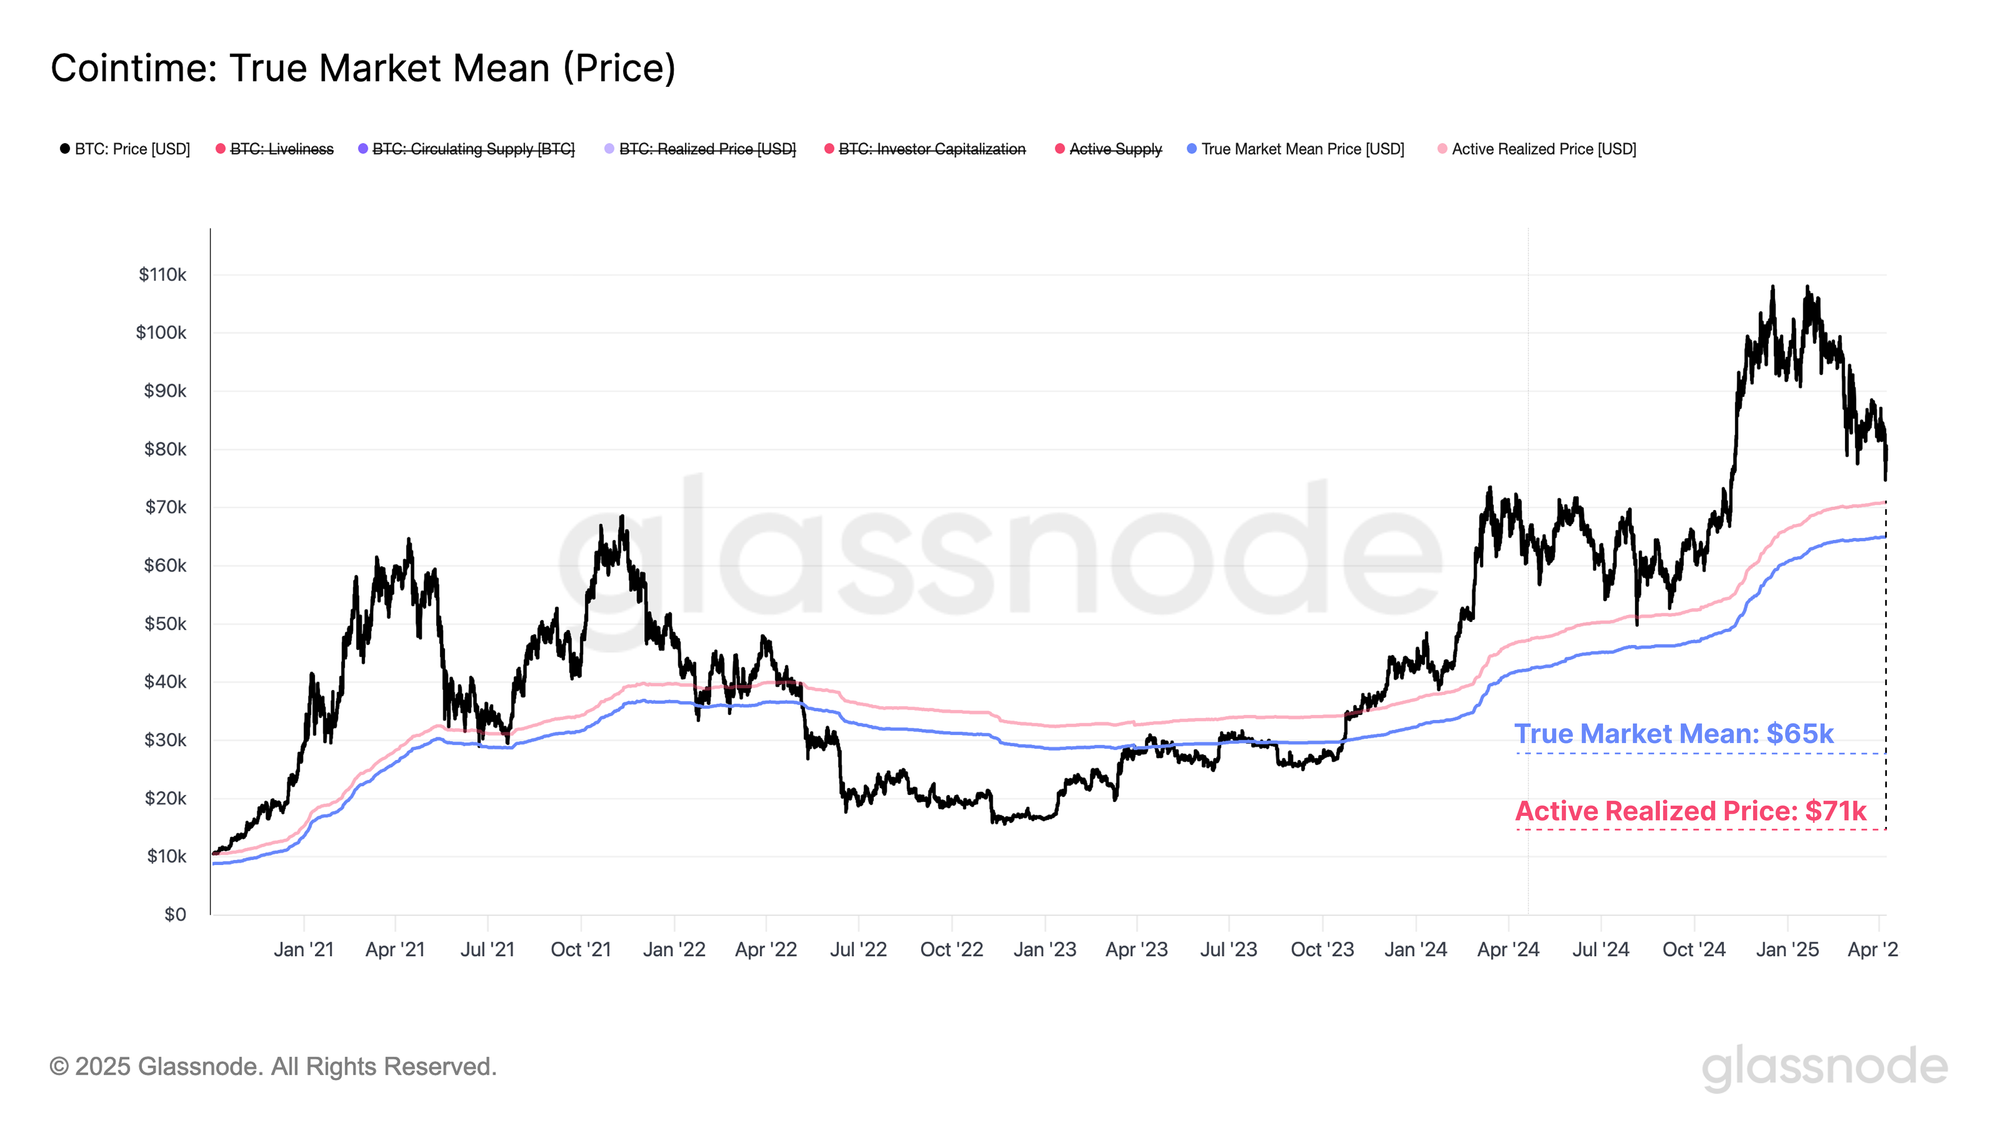
The Active Realized Price and Realized-Price-to-Liveliness Ratio are another set of price models, often trading near the midpoint of Bitcoin cycles. These two models represent a cost basis estimate for active market participants, by discounting lost and long-dormant supply.
Statistically speaking, approximately 50% of trading days see the spot price trade above / below these pricing models, allowing them to serve as a key mean reversion model, and a threshold delineating bullish and bearish market regimes.
- Active Realized Price: $71k
- True Market Mean: $65k
We now have confluence across several on-chain price models, highlighting the $65k to $71k price range as a critical area of interest for the bulls to establish long-term support. Should price trade meaningfully below this range, a super-majority of active investors would be underwater on their holdings, with likely negative impacts on aggregate sentiment to follow.
Summary and Conclusions
Pressure across global financial markets continues to escalate, driven by mounting uncertainty around the U.S. tariff regime. This weakness has permeated to nearly all asset classes, as evidenced by a significant drawdown across all major macro indices.
Digital asset markets have been no exception, experiencing a broad-contraction across all market sub-sectors. Bitcoin has traded as far down as $75k, marking one of the deepest drawdowns since the start of the bull cycle in Jan-2023. Ethereum has been hit even harder, and many longer-tail digital assets are now deep into bearish market trends.
Using a set of both on-chain and technical price models, the $65k to $71k region emerges as a key area of interest for the bulls to re-establish long-term support. If Bitcoin prices fall below this, it is likely sentiment will take a large hit, as a super-majority of active investors will be underwater on their holdings.
Disclaimer: This report does not provide any investment advice. All data is provided for information and educational purposes only. No investment decision shall be based on the information provided here and you are solely responsible for your own investment decisions.
Exchange balances presented are derived from Glassnode’s comprehensive database of address labels, which are amassed through both officially published exchange information and proprietary clustering algorithms. While we strive to ensure the utmost accuracy in representing exchange balances, it is important to note that these figures might not always encapsulate the entirety of an exchange’s reserves, particularly when exchanges refrain from disclosing their official addresses. We urge users to exercise caution and discretion when utilizing these metrics. Glassnode shall not be held responsible for any discrepancies or potential inaccuracies. Please read our Transparency Notice when using exchange data.
- Join our Telegram channel.
- For on-chain metrics, dashboards, and alerts, visit Glassnode Studio.