Here’s how Ethereum traders can navigate short-term trends

Ambcrypto发布于2023-07-13更新于2023-07-13

文章摘要

Ethereum has trended higher since January but has leaned bearish since May, and the lower timeframe range formation suggested buyers could be losing strength.

  • The price action of Ethereum in the past three weeks showed large volatility and no clear trend.
  • The psychological level at $1900 was retested as resistance in recent hours.

Ethereum [ETH] showed some conflicting signs on the higher timeframe charts. The asset has been on an uptrend in 2023 after the move above $1350, but the trend shifted bearishly in mid-April.

On 16 June, ETH dropped as low as $1626 before rallying to $1976 on 3 July. This signified a bullish structure- but is ETH ready to rally?

The lower timeframe picture was clearer. The 4-hour chart showed a strong possibility that Ethereum is preparing for the next big move. The price was in a phase of consolidation, but can the bulls drive another rally?

The rejection from $1978 saw selling pressure dominate

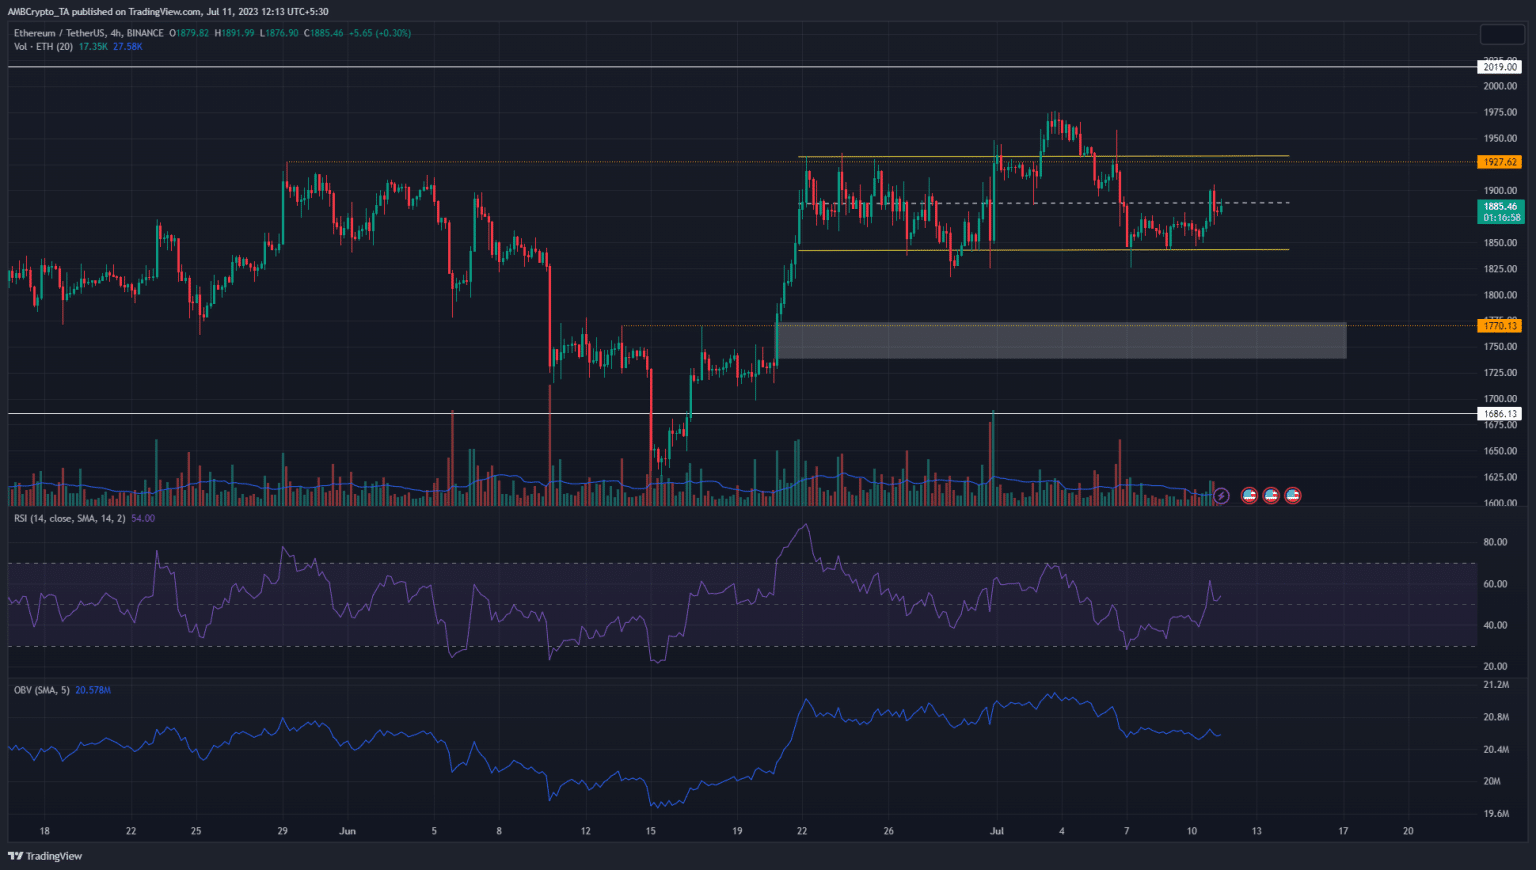
Source: ETH/USDT on TradingView

A range formation between $1843 and $1934 was highlighted in yellow. The brief breakout above this range in early July was quickly swatted down by the bears. Moreover, the OBV, which had been trending higher until then, declined.

Over the past week, the OBV continued to drop as the price dropped to the range lows. A candlewick to the $1826 mark on 7 July saw a quick reversal, which suggested that the bulls were not ready to give up on the range formation yet.

The RSI oscillated between bullish and bearish territory over the past few days to indicate the lack of a trend. However, on lower timeframes such as 1-hour, there was momentum for traders to profit from.

But, given the decline in OBV, the consolidation phase could be followed by a downtrend for Ethereum. Until the range lows are ceded to the bears, buyers can look to bid in the $1840-$1860 targeting the high at $1935.

The spot CVD remained flat despite Ethereum’s bounce from the range lows
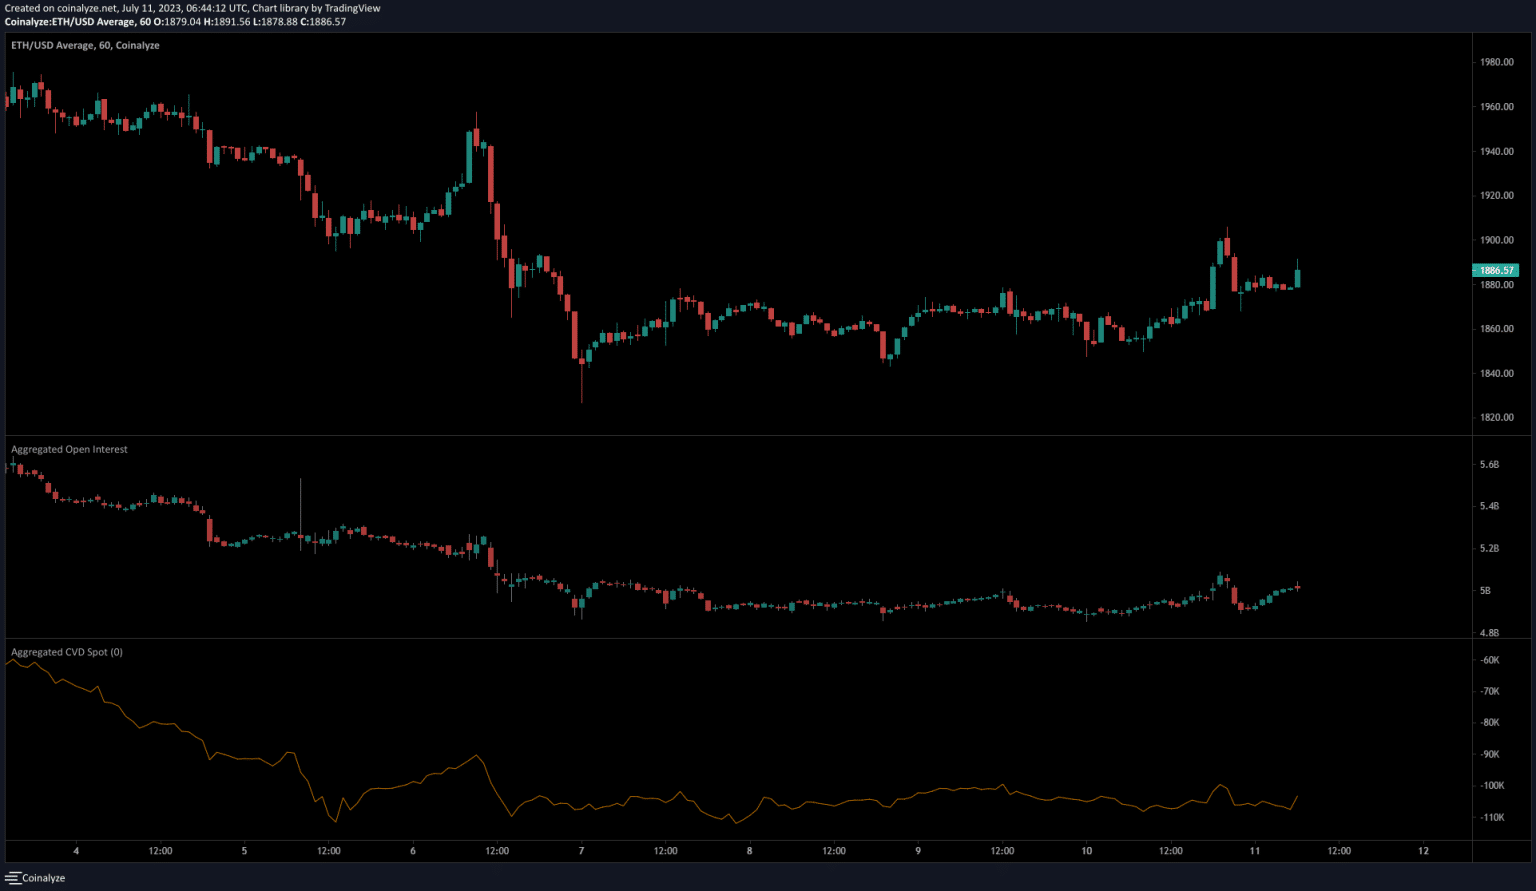
Source: Coinalyze

On 7 July, after the dip below $1830, Ethereum prices recovered. At the time of writing, ETH was trading at $1885 after rejection from $1900. Even though it was a minor bounce, the spot CVD did not climb higher.

Nor did the Open Interest budge much. It remained flat over the past few days and reflected the lack of conviction from speculators. The lack of reaction on the OI despite a minor bounce for Ethereum suggested the bullish side could be weakened.

你可能也喜欢

2026年6月六大加密预售项目

加密货币预售是项目在公开上市前,以预定价格向投资者出售代币的早期募资方式。2026年6月值得关注的六个预售项目如下: 1. **Nexchain**:一个完全由AI构建的区块链生态系统,结合了权益证明机制与创新的混合共识NEX AI,以确保持续性能与灵活性。其原生代币$NEX用于支持网络安全和激励参与。 2. **Mirex**:致力于将现实世界资产代币化,让用户能在MRX-20区块链上透明地使用代币化资产功能。其原生实用代币$MRX用于支付燃气费、执行智能合约等。 3. **Flozy**:基于Base链的社区驱动型迷因币$FLZY,融合了迷因文化传播力与实际效用,提供固定奖励质押和社区空投,总量固定为10亿枚。 4. **SurgeXRP**:一个代币化房地产市场,允许投资者通过区块链代币购买租赁房产的部分所有权,并按比例获得被动租金收益。其原生代币$SGP正处于预售阶段。 5. **Blockchain FX**:一个连接去中心化金融与传统金融市场的新型加密货币交易所,提供超过500种资产交易,目前已进入预售最后阶段,募资额超过1400万美元。 6. **Poly Truth**:一个AI驱动的分析与研究平台,作为去中心化预测市场的研究层,为用户提供体育、政治、加密货币价格等预测事件的概率分析。其原生代币$PTRUE支持多种加密货币购买。 预售是加密生态的重要组成部分,使用户有机会早期参与新项目。投资者在决策前应充分进行独立研究。

ambcrypto1小时前

2026年6月六大加密预售项目

ambcrypto1小时前

第三方服务商遭入侵引发300万美元钓鱼攻击,Polymarket承诺赔付受影响的用户

预测市场平台Polymarket表示,在因第三方供应商遭入侵导致其前端被植入恶意代码后,将全额赔偿受影响的用户。此次事件引发了一场网络钓鱼攻击,区块链安全研究人员估计损失近**300万美元**。 Polymarket在**6月25日**发布的声明中称,已于当日发现供应商遭入侵,并迅速移除了受影响的依赖项,控制了事态。公司表示正在联系受影响的用户并承诺全额退款。此次事件似乎仅影响了在攻击期间与受感染前端交互的用户,平台底层智能合约未受影响。 据分析,攻击源于一家遭入侵的第三方供应商,其在平台前端部分注入了恶意脚本。Polymarket尚未公开涉事供应商身份或发布详细的技术分析报告。 区块链安全公司PeckShield指出,这起事件疑似针对Polymarket用户的钓鱼活动。攻击者从超过**11个受害钱包**中盗取了价值约**300万美元的PUSD**,随后将被盗资金从Polygon桥接至以太坊,并兑换为约**1,893 ETH**,最终整合至一个被监控的地址。Polymarket未公开确认具体损失金额或受影响钱包数量。 与许多用户需自行承担损失的钓鱼事件不同,Polymarket承诺对所有受攻击影响的用户进行赔偿。公司表示正在直接联系受影响用户并继续调查此次入侵事件,但未提供赔偿流程或完整事件报告发布的具体时间表。

ambcrypto1小时前

第三方服务商遭入侵引发300万美元钓鱼攻击,Polymarket承诺赔付受影响的用户

ambcrypto1小时前

XRP周线RSI显示超卖信号,交易员紧盯1.10美元支撑位

XRP周线RSI指标显示超卖信号,交易员正密切关注1.10美元关键支撑位。在经历市场大幅回调后,XRP价格已进入一个被交易员拿来与先前周期底部条件相比较的深度超卖技术形态。当前焦点在于,这一位于关键支撑区域的技术设置,究竟会成为反弹信号,还是延续下跌的警示。 文章指出,在高时间框架图表上,极端的RSI读数能够显示卖压是否已过度延伸,但该指标本身衡量的是动量而非价值。对于XRP而言,当前技术层面的核心问题是:这一超卖状态反映的是市场抛售 capitulation,还是仅仅是一个弱势资产在弱市中的表现。答案将取决于买家能否守住支撑位,以及整个加密货币市场能否企稳。 XRP作为最受关注的大型山寨币之一,其技术形态容易快速吸引市场注意力,但也伴随着风险——如果比特币持续疲软,拥挤的反弹交易可能迅速瓦解。目前,RSI信号最好被解读为一个警告,表明XRP正处于一个重要的决策点。它并不保证底部已经形成,但暗示了价格在支撑位附近的下一步动向,或将决定未来一段时间的交易情绪。 最终,市场方向并非由单一头条决定。当前市场正同时应对流动性减弱、政策监管趋严、机构产品推出以及高波动性代币再度承压等多重因素。因此,最稳妥的解读方式是避免将此视为确定的价格催化剂,而应关注其对市场参与者、建设者和观察下一阶段加密货币采用的投资者所带来的实际影响。

bitcoinist1小时前

XRP周线RSI显示超卖信号,交易员紧盯1.10美元支撑位

bitcoinist1小时前

交易

现货
合约
活动图片