In 7 days, the value of Bitcoin dropped 7.14% while consolidating around the $26,700 region. However, the days of sighing of relief may be near, based on a tweet issued by Gert van Lagen. It seems that this prediction is correct as the price has increased by almost 2% today and is trading at $27,189.
According to the technical analyst, BTC has formed a “perfect” head and shoulders pattern bottom below the 200-day Simple Moving Average (SMA). This leads to a bear trap bottom preparing for a bullish crossover.
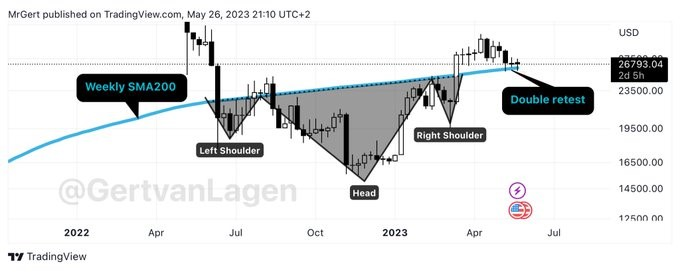
Source: Gert van Lagen
Used by traders to identify price reversals, the bearish head and shoulders pattern has three peaks, with the top in the middle being higher than the rest. In a case like this, BTC could reverse the uptrend.
But according to Lagen's chart, this pattern depicts a trend from down to up. This is because the vertex in the middle drops extremely low relative to the edges. This signals the end of the downtrend.
Before his latest observation, the analyst pointed out the trend of impulse, correction and historic recession peak. He noted that that is the current situation for BTC.
On May 20, he said that Bitcoin could match a large degree of bullish movement, as described by the Elliotwave impulse.
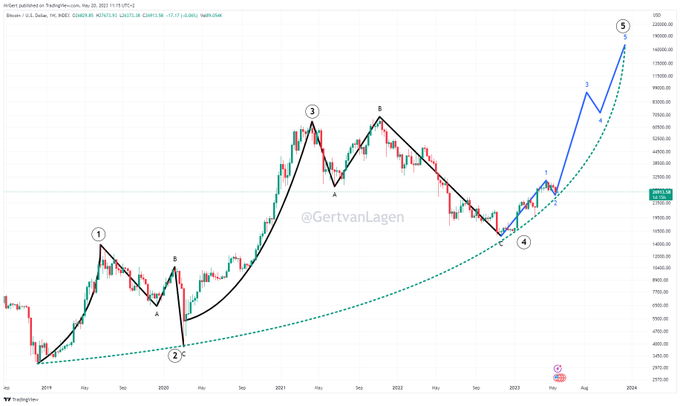
Source: Gert van Lagen
Interestingly, Lagen isn't the only one who shares the optimism. In a May 26 publication on CryptoQuant, BTC is forming a bullish divergence similar to the exit point from the bearish peak of November 2022.
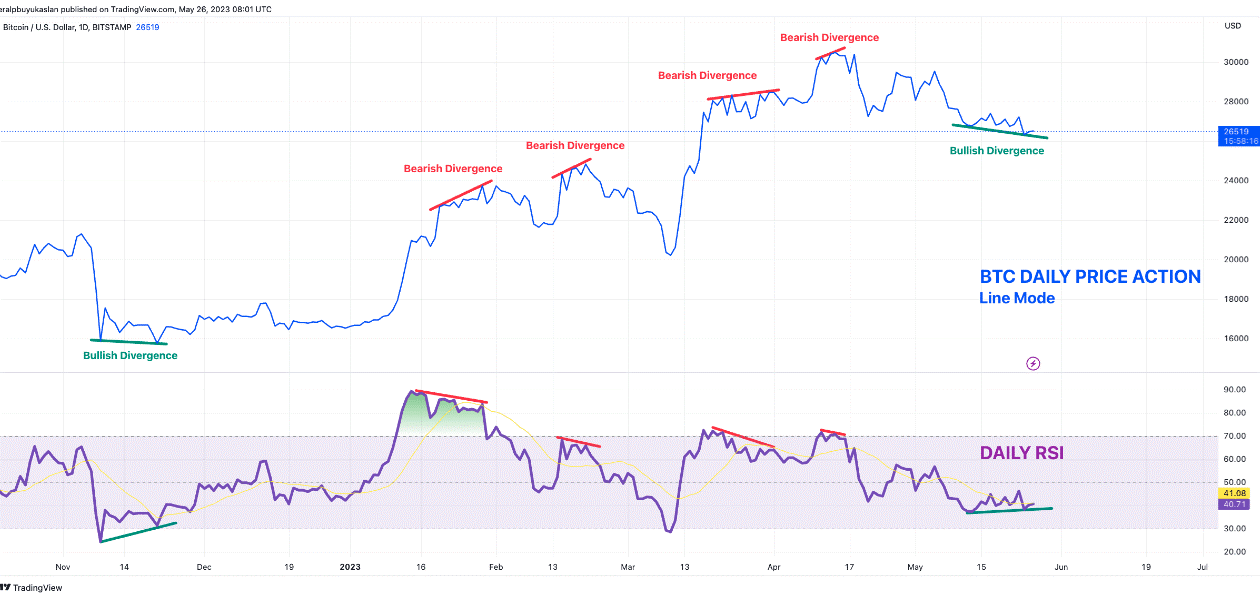
Source: CryptoQuant
Investors and analysts also point to the exchange's negative net flow as another reason for the short-term bullish move. When the indicator is negative, it means that the outflow is overwhelming the inflow.
Therefore, when this persists, it could be a sign of accumulation and turning into an uptrend in the asset's price.
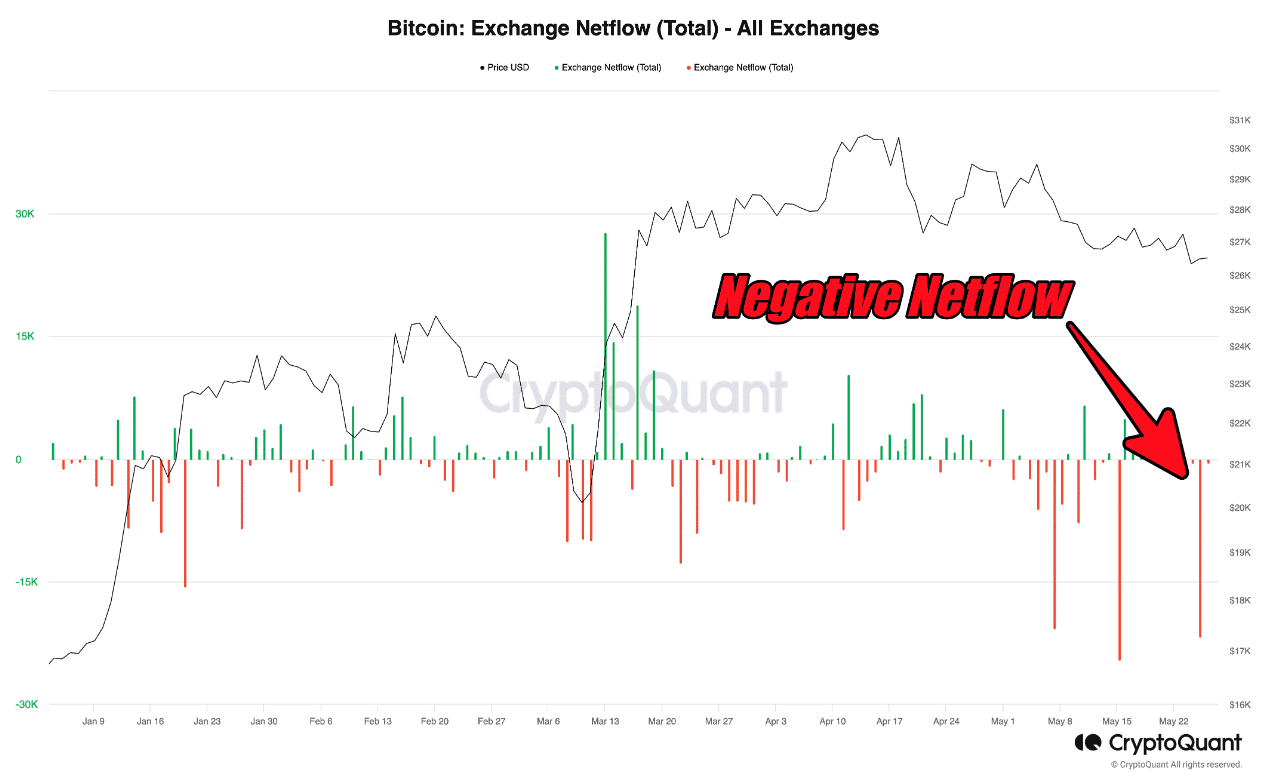
Source: CryptoQuant
From a technical point of view, Bitcoin's volatility appears to be shrinking. Recently, especially on May 25, the price left the area where it touched the lower part of Bollinger Bands (BB).
This move means that BTC has exited the oversold zone, even if the price is not near the upper band. At press time, the relative strength index (RSI) is 43.02 — up from 38.36 on May 24.
While the slight uptick represents movement away from the downside, the buyers need to neutralize the seller's dominance to reinforce a potential uptrend.
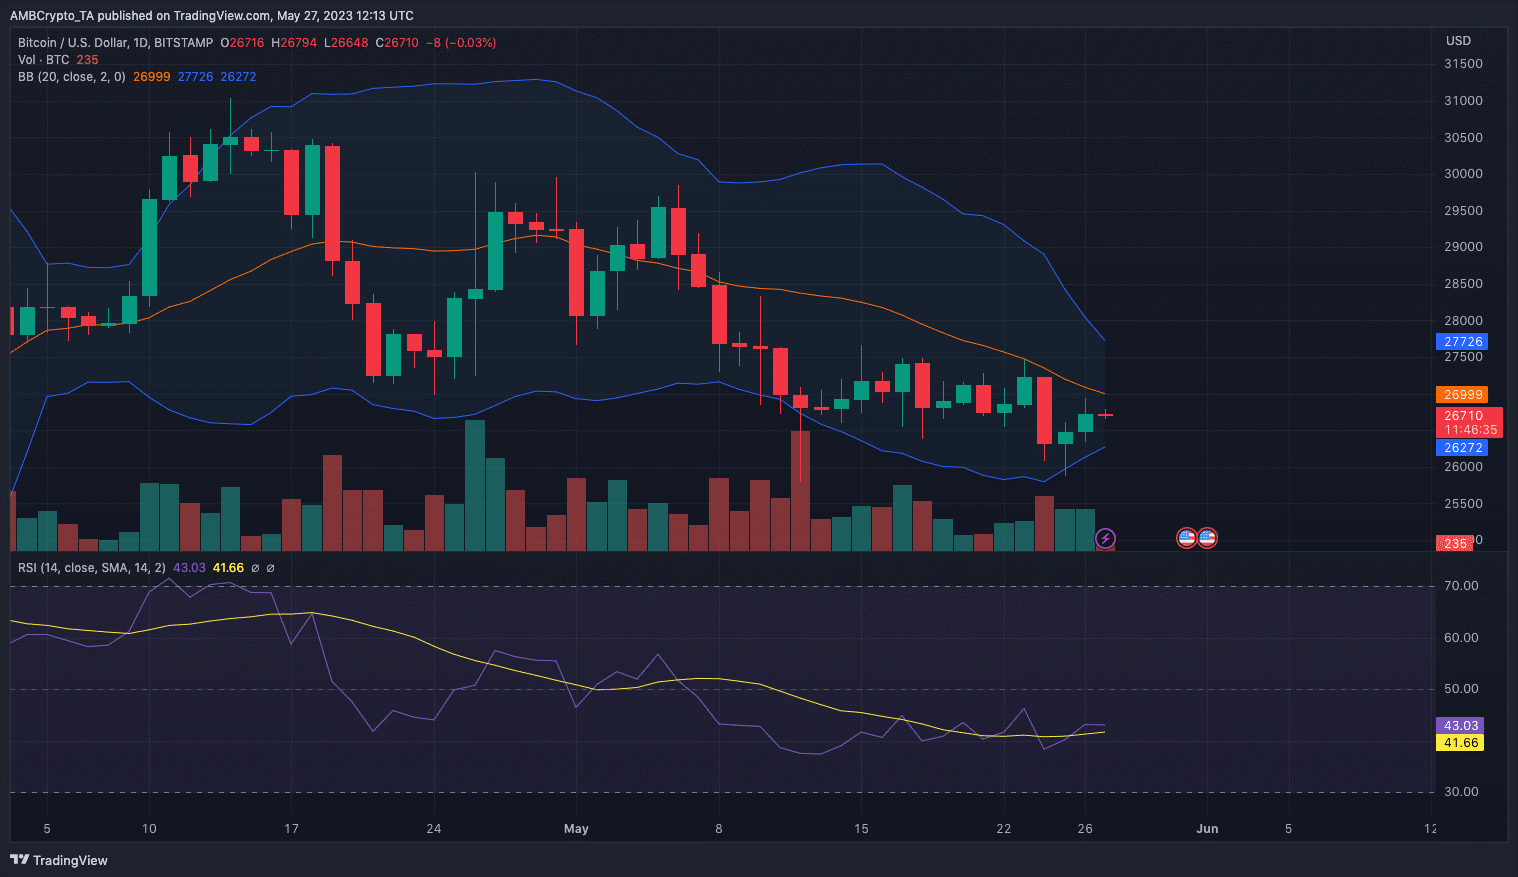
Source: TradingView