Author: Ray Dalio
Compiled by: Deep Tide TechFlow
Deep Tide Guide: This article received 75 million views and is the second chapter of Ray Dalio's book "Principles: Dealing with the Changing World Order," specifically discussing how to configure an investment portfolio within the framework of the big cycle.
Dalio uses real historical data to reveal an unsettling fact: in the past century, the wealth of seven out of ten major countries was nearly wiped out at least once—and most investors have never studied this history. At a time when global order friction is intensifying, the reference value of this analytical framework far exceeds that of general macro commentary.
Full Text as Follows:
Last week, I shared a chapter from the 2021 book "Principles: Dealing with the Changing World Order," detailing the classic signals and evolution process to watch for when the world's geopolitical order collapses in what I call the "big cycle." This article was very popular, receiving over 75 million views, and many people asked what it means for investment.
Due to the high number of inquiries, I am now forwarding the next chapter in the book—"Investing in the Big Cycle"—to everyone. I believe it is very helpful for current investment perspectives. You can read the full chapter below.
Additionally, since many people are interested in my investment principles, I will share them gradually over the next few weeks. If you wish to receive release notifications, please subscribe to my newsletter "Principle Perspectives" or register for email reminders.
My strategy for dealing with life and career is to try to figure out how the world works, develop corresponding principles to deal with it, and then make arrangements. The research I share in this book is done for this purpose.
Naturally, when I review everything covered so far, I think about how to apply it to investment. To be confident that I am doing well, I need to know how my method would have performed in history. If I cannot confidently explain what happened in the past, or at least do not have a set of strategies to deal with what I do not know, I consider this a dangerous oversight.
As my research from the past 500 years to the present reveals, there have been cycles of great accumulation and great loss of wealth and power in history, and the biggest contributing factor among them is the debt and capital market cycle. From an investor's perspective, this can be called the "big investment cycle." I believe it is necessary to fully understand these cycles to tactically move or diversify investment portfolio to guard against them or profit from them. By understanding these cycles and ideally judging where countries are in their cycles, I can do this.
In my roughly 50-year career in global macro investing, I have discovered many universal truths across time and geography that form my investment principles. Although I will not delve into all principles here, and will discuss most in the next book "Principles: Economics and Investment," I want to convey an important principle.
All markets are mainly driven by four factors: growth, inflation, risk premium, and discount rate.
This is because all investments are essentially an exchange of a one-time payment today for future payments. Future cash payments are determined by growth and inflation; how much risk investors are willing to take compared to holding cash is the risk premium; and how much these future payments are worth today, i.e., "present value," is determined by the discount rate.
Changes in these four determinants drive changes in investment returns. Tell me how these four factors will each evolve, and I can tell you how investments will perform. Understanding this allows me to know how to connect what is happening in the world with what is happening in the market, and vice versa. It also shows me how to balance my investments so that the portfolio is not biased towards any specific environment, which is exactly the way to achieve good diversification.
Governments influence these factors through fiscal and monetary policies. Therefore, the interaction between what the government expects to happen and what actually happens is what drives the cycles. For example, when growth and inflation are too low, the central bank creates more money and credit growth, generating purchasing power, first causing economic growth to accelerate, and then inflation to rise (with a lag). When the central bank restricts money and credit growth, the opposite happens: both growth and inflation slow down.
There is a difference between what the central government and the central bank do to drive market returns and economic conditions. The central government decides where the funds it uses come from and where they go, because it can tax and spend, but cannot create money and credit. The central bank can create money and credit, but cannot decide which areas of the real economy this money and credit enter. The actions of the central government and the central bank affect the buying and selling of goods, services, and investment assets, driving their prices up or down.
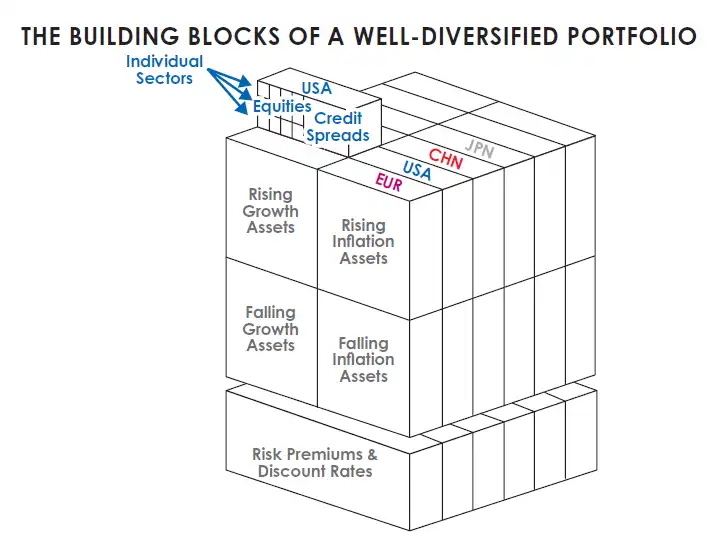
For me, each investment asset reflects these driving factors in its own way, in line with the logic presented by its impact on future cash flows. Each investment asset is a building block of the investment portfolio, and the challenge is to reasonably combine the investment portfolio considering these factors.
For example, when growth is stronger than expected, all else being equal, stock prices may rise; when growth and inflation are higher than expected, bond prices may fall.
My goal is to combine these building blocks into a well-diversified portfolio that is tactically tilted based on world events that are happening or will happen and affect these four driving factors. These building blocks can be subdivided by country, by environmental preference, all the way down to the industry and individual company level. When this concept is applied to a balanced investment portfolio, the effect is as shown in the figure below. This is the perspective through which I examine historical events, market history, and portfolio behavior.
I know my approach is different from that of most investors for two reasons. First, most investors do not look for analogous periods in history because they believe history and past investment returns are largely irrelevant to them. Second, they do not view investment returns through the perspective I just described. I believe these perspectives give me and Bridgewater a competitive advantage, but whether to adopt them is up to you.
Most investors set expectations based on their lifetime experiences; a few more diligent ones look back at history to see how their decision rules would have worked in the 1950s or 1960s. Among the investors I know, none—and among the senior economic policymakers I know, none (I know many, and I know the best of them)—have an excellent understanding of what happened in the past and why. Most investors who look at longer-term returns view the returns of the United States and Britain (the countries that won World War I and World War II) as representative data.
That is because not many stock and bond markets survived after World War II. But these countries and periods are not representative because they have survivor bias. Examining the returns of the United States and Britain is examining uniquely lucky countries during the best periods of the big cycle. Not examining what happened in other countries and earlier periods creates a distorted perspective.
Starting from the known knowledge of the big cycle and reasoning logically, when we extend our vision forward decades and examine what happened in different places, we get a shockingly different perspective. I will show this because I think you should know it.
In the 35 years before 1945, almost all wealth in most countries was destroyed or confiscated; in some countries, when capital markets and capitalism collapsed along with other aspects of the old order, many capitalists were killed or imprisoned, stemming from anger towards them.
If we look back over the past few centuries, we see such extreme boom/bust cycles occurring regularly—periods of capital and capitalist prosperity (such as the Second Industrial Revolution and the Gilded Age in the late 19th and early 20th centuries) followed by transition periods (such as the 1900-1910s when internal conflicts intensified and international wealth and power struggles intensified), leading to periods of great conflict and economic depression (similar to those that occurred between 1910 and 1945).
We can also see that the causal relationships behind those boom and bust periods are now more similar to the depression and restructuring periods at the end of the cycle than to the early prosperity and construction periods.
My goal is simply to see and understand what happened in the past and then try my best to show it to you. This is what I will try to do now. I will start from 1350, although the story began long before that.
The Big Cycle of Capitalism and Markets
Before about 1350, interest-bearing loans were prohibited by Christianity and Islam—in Judaism, it was also prohibited within Jewish communities—because it caused serious problems: human nature leads people to borrow more debt than they can repay, creating tension between borrowers and lenders, often triggering violence. Due to the lack of loans, money was "hard money" (gold and silver). About a century later, during the Age of Exploration, explorers traveled the world, collecting gold and silver and other hard assets to accumulate more wealth. This was how the greatest wealth was accumulated at that time. The explorers and those who funded them split the profits, which was an effective incentive-based system for getting rich.
The alchemy of lending as we know it today was first created around 1350 in Italy. The rules of lending changed, and new types of money were created: cash deposits, bonds, and stocks, in forms very similar to what we know today. Wealth became promises to pay money—what I call "financial wealth."
Think about how much impact the invention and development of bond and stock markets had. Before that, all wealth was tangible. Think about how much more "financial wealth" the creation of these markets created. To imagine this difference, consider: if your cash deposits and the future payments promised by stocks and bonds did not exist, how much "wealth" would you have now? You would have almost nothing, you would feel bankrupt, and you would behave differently—for example, you would accumulate more savings in tangible wealth. This is probably what it was like before cash deposits, bonds, and stocks were created.
With the invention and growth of financial wealth, money was no longer constrained by the link to gold and silver. Because money and credit, and purchasing power, were less constrained, it became common practice for entrepreneurs with good ideas to start companies, borrow money, and/or sell company shares to obtain the necessary funds. They were able to do this because promises to pay became money in the form of ledger entries.
Around 1350, those who could do this—most famously the Medici family in Florence—could create money. If you could create credit—say, five times the actual money (banks can do this)—you could generate a lot of purchasing power, so you no longer needed so much other types of money (gold and silver). The creation of new types of money was, and still is, a kind of alchemy. Those who could create and use it—bankers, entrepreneurs, and capitalists—became very wealthy and powerful.
This process of expanding financial wealth has continued to this day, and financial wealth has become so huge that hard money (gold and silver) and other tangible wealth (such as real estate) have become relatively unimportant. But of course, the more promises there are in the form of financial wealth, the greater the risk that these promises will not be fulfilled. This is the cause of the classic big debt/money/economic cycle. Think about how much financial wealth there is now relative to actual wealth, and imagine that you and other holders of financial wealth really try to convert it into actual wealth—that is, sell it and buy something. This is like a bank run. It cannot happen. The value of bonds and stocks is too large relative to what they can buy. But remember, under a fiat currency system, the central bank can print money to provide the currency needed to meet demand. This is a universal truth across time and geography.
Also remember that paper money and financial assets (such as stocks and bonds), which are essentially promises to pay, are not very useful in themselves; what is useful is only what they can buy.
As discussed in detail in Chapter 3, when credit is created, purchasing power is created along with the promise to pay, so it is stimulating in the short term and inhibitory in the long term. This creates cycles. Throughout history, the desire to obtain money (by borrowing or selling stocks) and the desire to store money (by lending or buying stocks for investment) have been in a symbiotic relationship. This leads to growth in the form of purchasing power, eventually generating far more payment promises than can be delivered, and crises of default promises in the form of debt default depressions and stock market crashes.
At that time, bankers and capitalists were literally and figuratively hanged, a large amount of wealth and lives were wiped out, and a large amount of fiat currency (currency that can be printed and has no intrinsic value) was issued to try to alleviate the crisis.
The Complete Picture of the Big Cycle from an Investor's Perspective
Although it is too burdensome for me and you to review all the relevant history from 1350 to the present, I will show you what it would have been like if you had invested from 1900. But before that, I want to explain how I view risk, because I will highlight these risks in what follows.
In my view, investment risk is the inability to earn enough money to meet your needs, not volatility measured by standard deviation—although the latter is almost exclusively used as a risk measure.
For me, the three major risks faced by most investors are: the portfolio cannot provide the returns needed to meet spending needs, the portfolio faces destruction, and most wealth is confiscated (e.g., through high taxes).
Although the first two risks sound similar, they are actually different because it is possible to have an average return higher than needed while simultaneously experiencing one or more devastating large losses.
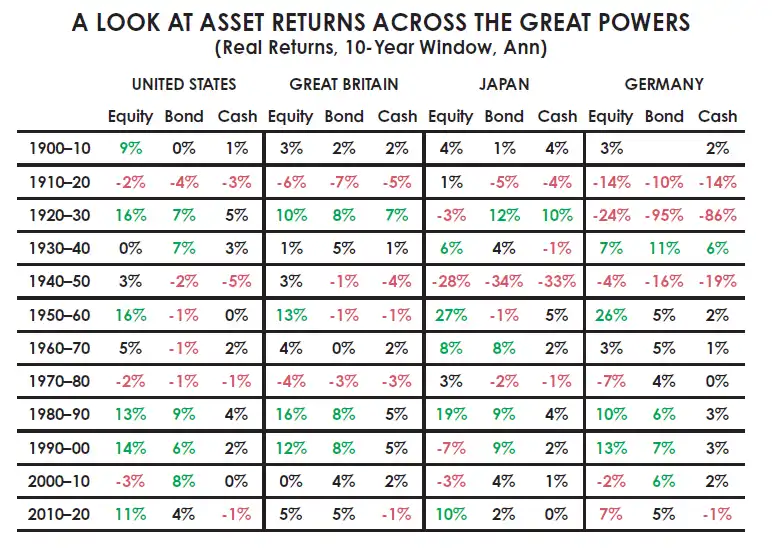
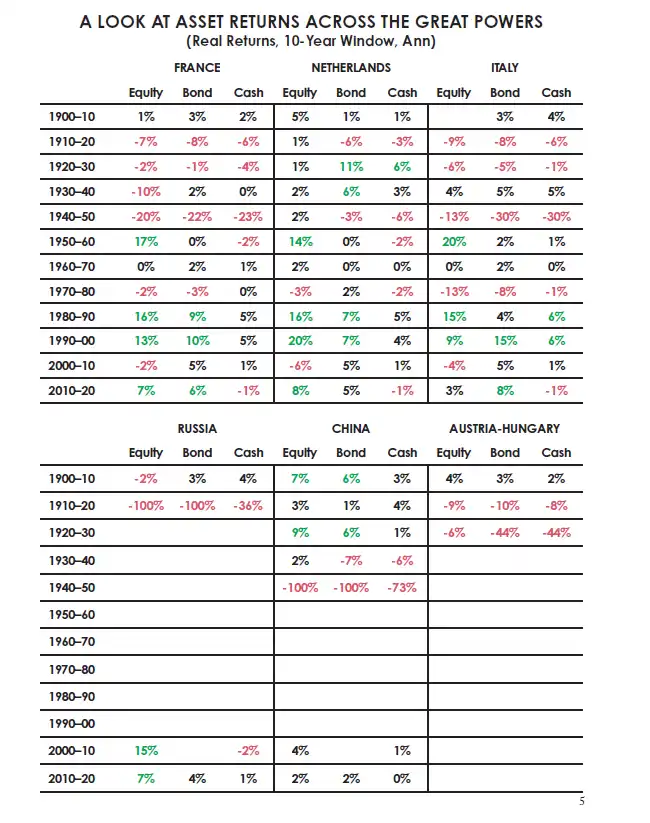
To gain perspective, I imagine myself thrown into 1900 and see how my investments would have fared in each decade since then. I chose to examine the 10 most powerful countries in 1900, skipping those less developed countries that are more prone to bad results. In fact, any of these countries was or could become a great wealthy empire, and they are all reasonable places to invest, especially when people want to have a diversified portfolio.
Seven of these 10 countries experienced at least one instance of wealth being almost completely wiped out, and even those that did not see wealth destroyed experienced decades of terrible asset returns that almost led to financial ruin. Two great developed countries—Germany and Japan, which people might easily have bet on to become winners—saw almost all their wealth destroyed in the two world wars, and many lives were lost. I have seen similar results in many other countries. The United States and Britain (and a few other countries) are particularly successful cases, but even they experienced periods of large-scale wealth destruction.
If I had not examined the returns from the period before the new world order began in 1945, I would not have seen these periods of destruction. If I had not looked back at 500 years of global history, I would not have seen this happen repeatedly almost everywhere.
The numbers shown in the table below are the annualized real returns for each decade, meaning that the loss over the entire decade is about eight times the number shown, and the gain is about 15 times the number shown.
Perhaps the following chart presents a clearer picture, showing the proportion of major countries that suffered losses when holding a 60/40 stock/bond portfolio over five-year periods.
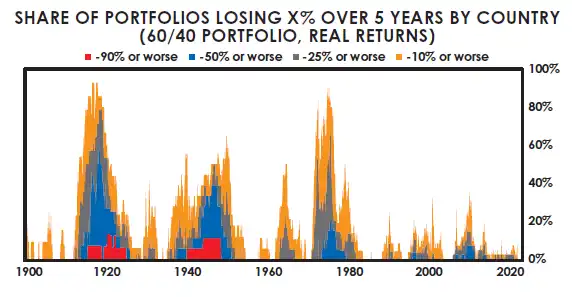
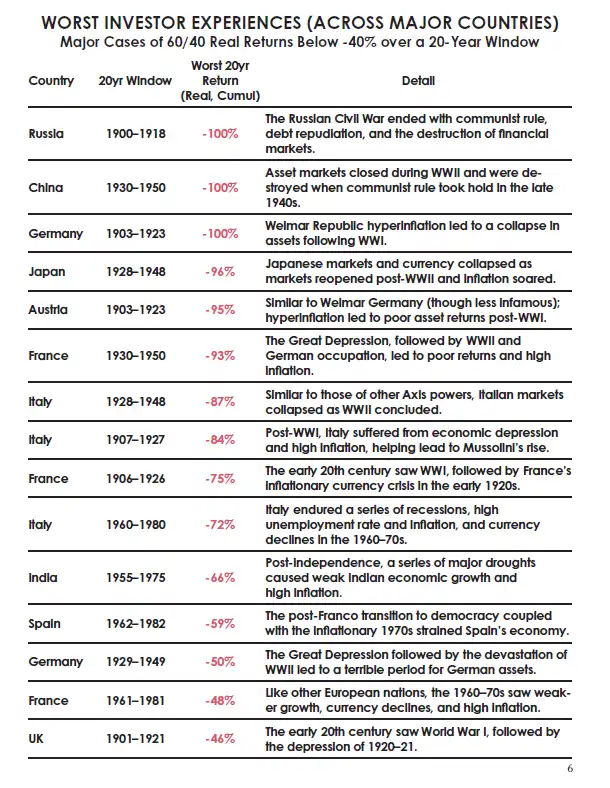
The table below details the worst cases of investing in major countries. You will notice that the United States does not appear on this table because it is not among the worst cases. The United States, Canada, and Australia are the only countries that did not experience sustained loss periods.
Naturally, I think about how I would have coped if I had been going through these periods at the time. I can say for sure that even if I had seen the signs of those things I am conveying to you in this book coming, I would never have had the confidence to predict such bad outcomes—as mentioned earlier, seven out of ten countries saw their wealth wiped out. In the early 20th century, even those who looked back at the past few decades would never have foreseen this, because based on what happened in the second half of the 19th century, there was ample reason for optimism.
Today, people often assume that World War I should have been easily foreseeable in the years before the war, but that was not the case. Before the outbreak of war, there had been almost no conflict between the world's major powers for about 50 years. During those 50 years, the world experienced the largest innovation and productivity growth in history, bringing great wealth and prosperity.
Globalization reached new heights, with global exports multiplying several times in the 50 years before World War I. Countries were more connected than ever before. The United States, France, Germany, Japan, and Austria-Hungary were rapidly rising empires, experiencing dizzying technological progress. Britain was still the dominant global power. Russia was rapidly industrializing.
Among the countries shown in the worst investor experience table, only China was clearly in decline. The powerful alliances between European powers were seen at the time as a means of maintaining peace and balancing power. Entering 1900, everything looked good, except that the wealth gap and resentment were intensifying, and debt had become huge. Between 1900 and 1914, these conditions deteriorated and international tensions escalated. Then came those terrible return periods I just described.
But it was worse than terrible returns.
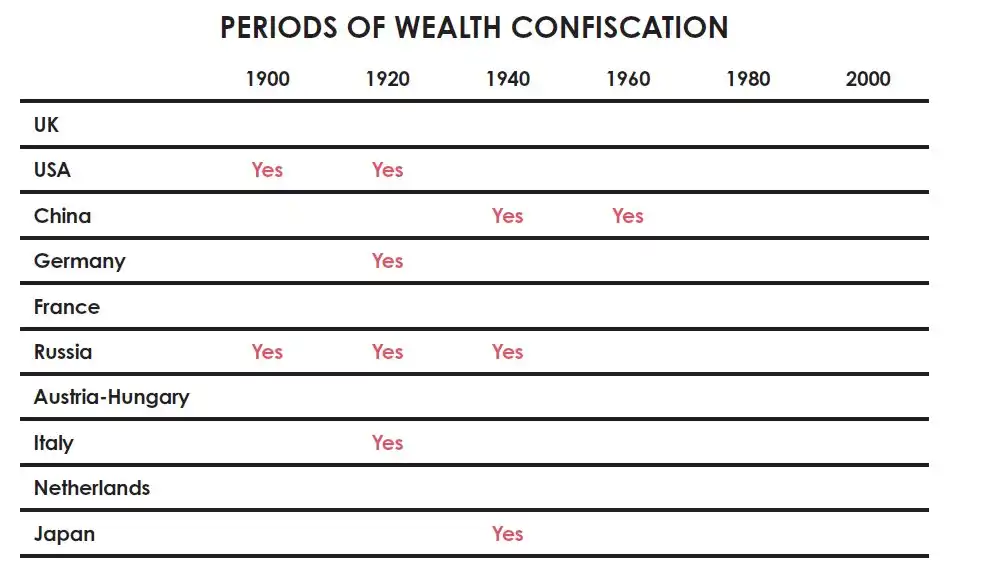
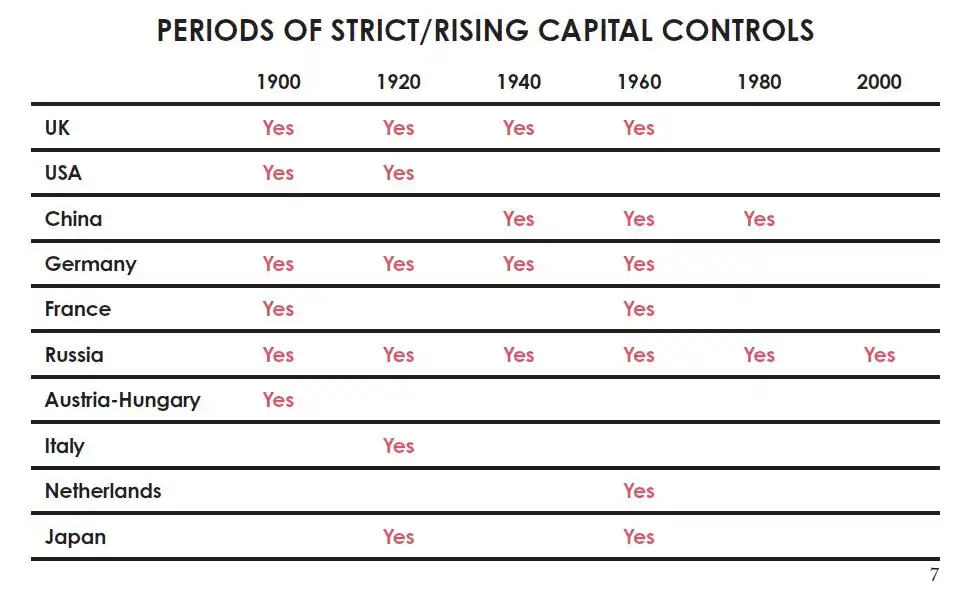
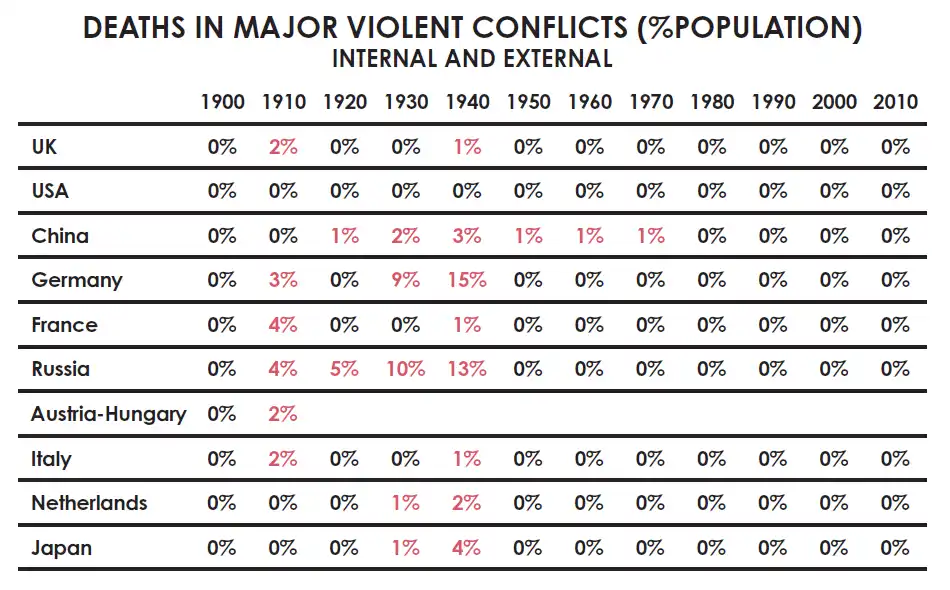
In addition, the impact of wealth confiscation, confiscatory taxes, capital controls, and market closures on wealth was huge. Most investors today are unaware of such things and think they cannot happen because they do not see these situations when looking back at the past few decades. The table below shows in which decades these events occurred. Naturally, the most severe cases of wealth confiscation occurred during periods of internal wealth conflict when the wealth gap was large and economic conditions deteriorated, and/or during periods of war.
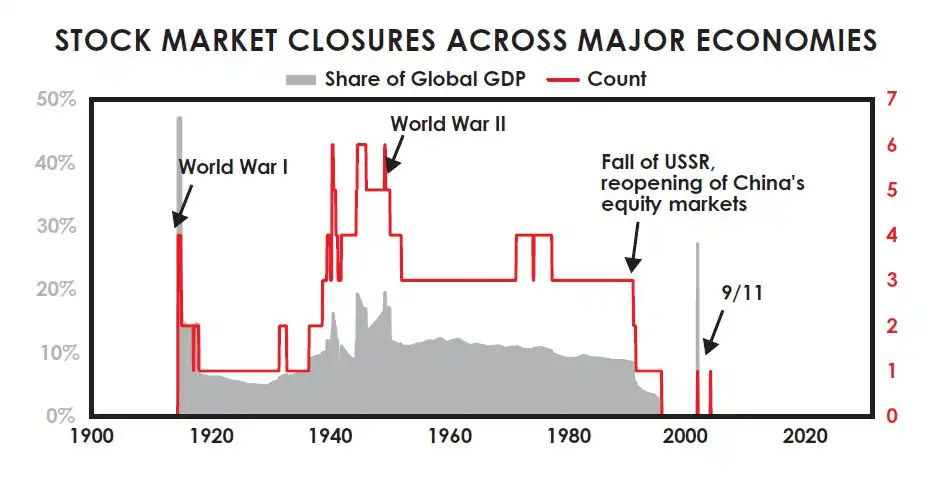
The next chart shows the proportion of major countries' stock markets closed over time. Stock market closures during war were common, and communist countries certainly closed their stock markets for more than a generation.
The bad parts of all cycles before 1900 were equally bad. Worse, these periods of internal and external struggle around wealth and power led to massive deaths.
Even for investors lucky enough to be in countries that won the wars (such as the United States, which was the biggest winner both times), there were two further headwinds: market timing and taxes.
Most investors sell near the lows when conditions are bad because they need money and tend to panic; they tend to buy near the highs because they have ample funds and are attracted by euphoria. This means their actual returns are worse than the market returns I showed. A recent study showed that between 2000 and 2020, U.S. investors underperformed U.S. stocks by about 1.5 percentage points per year.
As for taxes, the table below estimates the impact of taxes on the average S&P 500 investor over all 20-year periods (using the average tax rate for the top fifth of earners today throughout the analysis period). Different columns represent different ways of investing in the U.S. stock market, including tax-deferred retirement accounts (taxed only at the end of the investment) and holding physical stocks as in a regular brokerage account with dividends reinvested annually.
Although these different implementations have different tax impacts (retirement accounts have the least impact), all methods show significant impact, especially in terms of real returns, where taxes can erode a considerable portion of returns. In any given 20-year period, U.S. investors lost about a quarter of their real stock returns to taxes on average.
Reviewing the Big Capital Market Cycle
Earlier, I explained how the classic big debt and capital market cycle works. To reiterate: in the upward wave, debt increases, financial wealth and obligations rise relative to tangible wealth, until these future payment promises (i.e., the value of cash, bonds, and stocks) cannot be met.
This leads to a "bank run"-style debt problem, which in turn leads to money printing to try to alleviate the problems of debt default and stock market decline, which in turn leads to currency depreciation, and financial wealth declines relative to real wealth until the real (inflation-adjusted) value of financial assets becomes cheap relative to tangible wealth. Then the cycle starts again.
This is a very simplified description, but you get the idea—in the downward wave of this cycle, the real returns of financial assets are negative relative to real assets, and times are tough. This is the anti-capital, anti-capitalist phase of the cycle, lasting until the opposite extreme is reached.
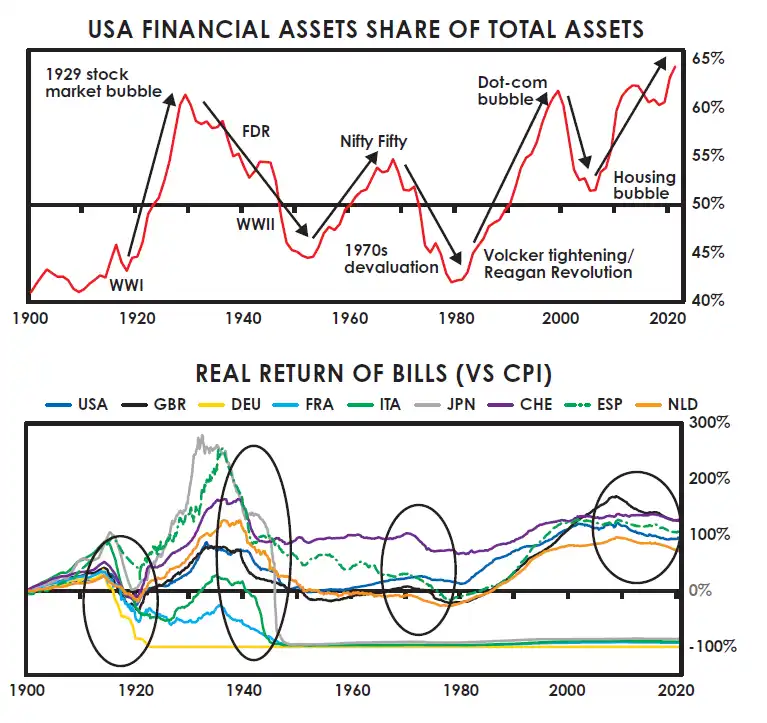
This cycle is reflected in the following two charts. The first shows the total value of financial assets relative to the total value of real assets. The second shows the real return of money (i.e., cash). I use U.S. data rather than global data because they are the most continuous since 1900. As you can see, when financial wealth is high relative to real wealth, it reverses, and the real returns of financial wealth (especially cash and debt assets like bonds) are poor.
This is because the interest rates and returns of debt holders must be kept low and poor to provide relief for over-indebted debtors and to try to stimulate more debt growth to stimulate the economy. This is the classic late stage of the long-term debt cycle.
It happens when more money is printed to减轻 debt burdens and new debt is created to increase purchasing power. This depreciates the currency relative to other stores of wealth and goods and services.
Eventually, as financial asset values fall until they become cheap relative to real assets, the opposite extreme is reached and reverses, then peace and prosperity return, and the cycle enters an upward phase where financial assets have excellent real returns.
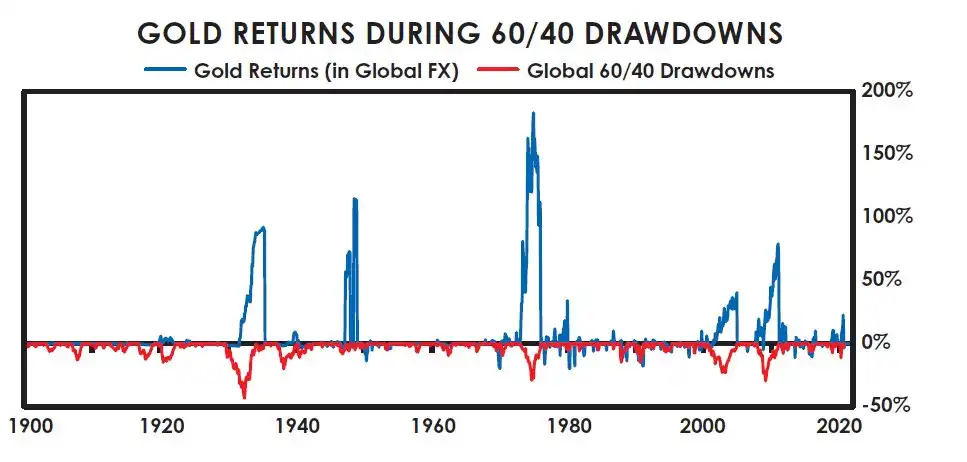
As mentioned earlier, during periods of currency depreciation, the value of hard money and hard assets rises relative to cash. For example, the next chart shows that the periods when the value of a classic 60/40 stock/bond portfolio fell were precisely the periods when gold prices rose. I am not saying whether gold is a good or bad investment, I am just describing the economic and market mechanisms, and how they are reflected in past market movements and investment returns, with the purpose of sharing my perspective on what happened, what might happen, and why.
One of the most important questions investors need to ask themselves regularly is: is the interest paid sufficient to compensate for the depreciation risk they face.
The classic big debt/money/capital market cycle, repeated throughout history in various places, is reflected in the charts I just showed,表现为
1) Physical/tangible money and physical/tangible wealth
versus 2) Financial money and financial wealth. Financial money and financial wealth are only valuable if they can be exchanged for real money and real wealth with actual (i.e., intrinsic) value.
The way these cycles work has always been: in the upward phase, the amount of financial money and financial wealth (i.e., created debt and equity assets) increases relative to the amount of physical money and physical wealth they represent.
It increases because:
a) It is profitable for capitalists engaged in the business of creating and selling financial assets;
b) Increasing money, credit, and other capital market assets is an effective way for policymakers to create prosperity because it funds demand;
c) When the book value of financial investments rises due to the decline in the value of money and debt assets, it creates the illusion that people are wealthier. In this way, central governments and central banks have historically created far more financial claims than can be converted into real wealth and real money.
In the upward phase of the cycle, as interest rates fall, stocks, bonds, and other investment assets rise because falling interest rates raise asset prices all else being equal. At the same time, injecting more money into the system increases demand for financial assets and reduces risk premiums.
When these investments rise due to falling interest rates and more money in the system, they appear more attractive at the same time, while the interest rates and future expected returns of financial assets are falling.
The more outstanding claims there are relative to what is being claimed, the greater the risk. This should be compensated by higher interest rates, but usually is not, because conditions look good then, and memories of debt and capital market crises have faded.
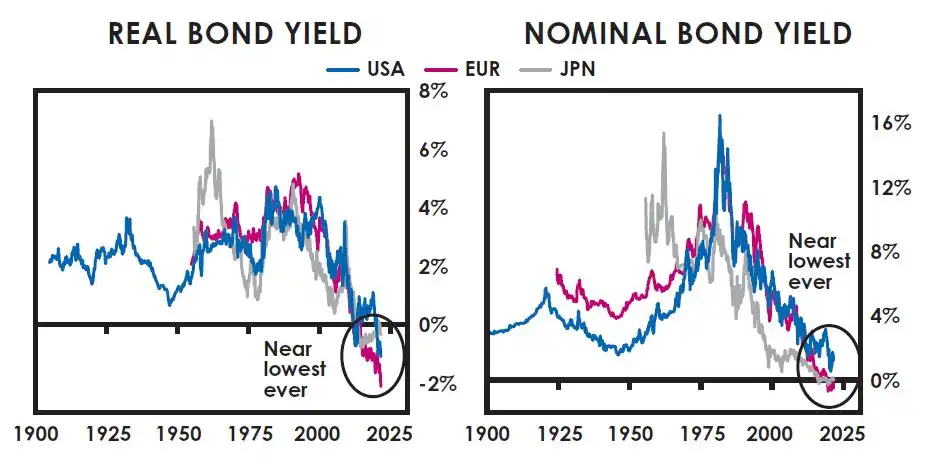
The charts I showed earlier to convey the cycle would not be complete without adding some interest rate charts. Interest rates are shown in the next four charts dating back to 1900. (Note: This chapter was originally published in 2021, and the following charts only include data up to that year.)
They show the real (i.e., inflation-adjusted) bond yields, nominal (i.e., not inflation-adjusted) bond yields, and nominal and real cash rates in the United States, Europe, and Japan at the time of writing. As you can see, they were much higher once, and are very low now.
At the time of writing, the real yields of reserve currency sovereign bonds were near the lowest ever, and nominal bond yields were about 0%, also near the lowest ever. As shown, real cash yields were even lower, although not as negative as during the periods of heavy money printing in 1930-45 and 1915-20. Nominal cash yields were also near the lowest ever.
What does this mean for investment? The purpose of investment is to place money in a store of wealth so that it can be converted into purchasing power later. When people invest, they exchange a one-time payment for future payments.
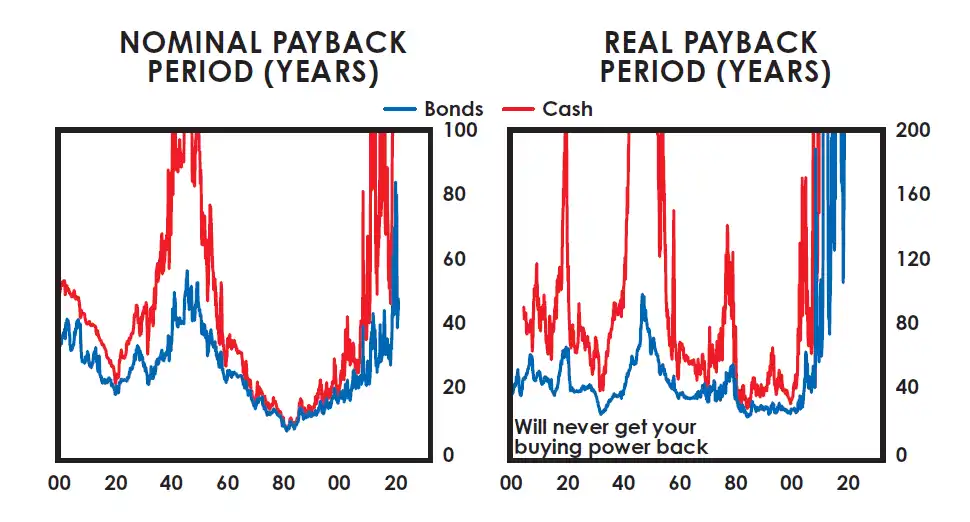
Let's see what this deal looked like at the time of writing this article. If you give $100 today, how many years do you need to wait to get your $100 back, and then start earning a return on the money you gave? In U.S., Japanese, Chinese, and European bonds, you might need to wait about 45 years, 150 years, and 30 years, respectively, to get your money back (likely with low or zero nominal returns), while in Europe, given negative nominal interest rates, you might never get your money back.
However, since you are trying to store purchasing power, you must consider inflation. At the time of writing, in the United States and Europe, you might never recover your purchasing power (in Japan, it would take over 250 years). In fact, in these countries with negative real interest rates, you will almost certainly have much less purchasing power in the future.
Instead of getting returns below inflation, why not buy something—anything—whose value equals or exceeds inflation? I see many investments I expect to significantly outperform inflation. The chart below shows the payback period for holding cash and bonds in the United States, in nominal and real terms. As shown, this is the longest ever, clearly an absurdly long time.
Conclusion
What I have shown you here is the big cycle from an investor's perspective since 1900. In reviewing 500 years of global history, and looking back at 1,400 years of Chinese history, I see basically the same cycles happening repeatedly for basically the same reasons.
As discussed earlier in the book, the terrible years before the new world order was established in 1945 were typical late features of the big cycle transition phase, when revolutionary changes and restructuring were taking place. Although they were terrible, they were much worse than the amazing upward phase that emerged after the painful transition from the old order to the new order was completed. Because these things have happened many times before, and I cannot be sure what will happen in the future, I cannot invest without protections against these things happening and against my misjudgments.
Footnotes
[1] The discount rate is the interest rate used to evaluate the value today of a future sum of money. It is calculated by comparing how much money invested today at that interest rate (i.e., the discount rate) would equal a specific amount at a specific future time.
[2] If the government and its systems collapse, non-government-led forces take over, which is another story I will not delve into now.
[3] You can see this alchemy at work in the form of digital currency today.
[4] When compounded over a decade, gains are greater than losses because you keep accumulating on the basis of gains; and when you experience losses and approach zero, future percentage losses have less and less impact in terms of dollars. The comparison of gains and losses annualized represents the compounding from an average 10% annual gain and -5% annual loss. With more extreme changes, the multiplier changes from there.
[5] For China and Russia, pre-1950 bond data are modeled based on hard currency bond returns, as if hedged back to domestic currency by domestic investors; stocks and bonds are modeled as completely defaulted at the time of revolution. Annualized returns assume a full 10-year period, even if the market was closed during that decade.
[6] Poor asset return cases for smaller countries such as Belgium, Greece, New Zealand, Norway, Sweden, Switzerland, and emerging markets are not in this table. Note that for brevity, the worst 20-year window for each country/period is shown (i.e., including Germany 1903-23 would exclude Germany 1915-35). For our 60/40 portfolio, we assume monthly rebalancing within the 20-year window.
[7] Although this chart is not exhaustive, I list instances where I found clear evidence of each event occurring within a 20-year period. In this analysis, wealth confiscation is defined as large-scale confiscation of private assets, including large-scale forced non-economic sales by the government (or revolutionaries in the case of revolution). Relevant capital controls are defined as meaningful restrictions on investors moving funds into or out of other countries and assets (although this does not include targeted measures against a single country only, such as sanctions).
[8] The tax impact of the 401(k) method is calculated at the end of each 20-year investment period (i.e., tax-free investment growth) at a 26% income tax rate (from the Congressional Budget Office's 2017 average effective federal tax rate for the top fifth). The brokerage account method separately taxes dividends (at the same 26% income tax rate) and capital gains, taxing all capital gains on the principal and reinvested dividends at the end of each 20-year investment period (at a 20% rate), and offsetting any gains with losses.
[9] Based on the 30-year nominal bond yield level as of August 2021 (treated as a perpetuity).