The History of U.S. Stocks is, Behind It, a History of American Wars

marsbitXuất bản vào 2026-05-08Cập nhật gần nhất vào 2026-05-08

Tóm tắt

The article argues that the history of the U.S. stock market is deeply intertwined with American military conflicts. While current Middle East tensions raise economic concerns, major indices like the S&P 500 and Nasdaq continue hitting new highs. Historical analysis shows U.S. wars, from the Spanish-American War to recent conflicts in the Middle East, have often coincided with market gains, as seen in the Dow Jones's performance during these periods. The U.S. transitioned from a war participant to an initiator, with most conflicts post-Vietnam being short, focused on oil, and achieving strategic goals. The market's reaction to war has evolved. Pre-1950s, investor sentiment directly drove swings based on battle outcomes. From the Korean War onward, the focus shifted to economic channels like inflation, oil prices, and fiscal policy. For instance, during the Gulf War, stock movements inversely correlated with oil price swings. The primary beneficiary industries have also changed: coal dominated WWII, oil surged during Korea and Vietnam, but by the Gulf War, the indirect economic impact made consumer staples outperform. Overall, as the U.S. economy grew, the direct market impact of individual wars diminished, giving way to broader macroeconomic factors like interest rates and deficits as the key drivers.

Written by: Li Jia

Source: Wall Street News

When cannons roar, gold pours in. Just as the market is hotly debating whether Middle East conflicts will drag down the global economy, the S&P 500 and Nasdaq indices have both hit new record highs. What exactly does war mean for U.S. stocks?

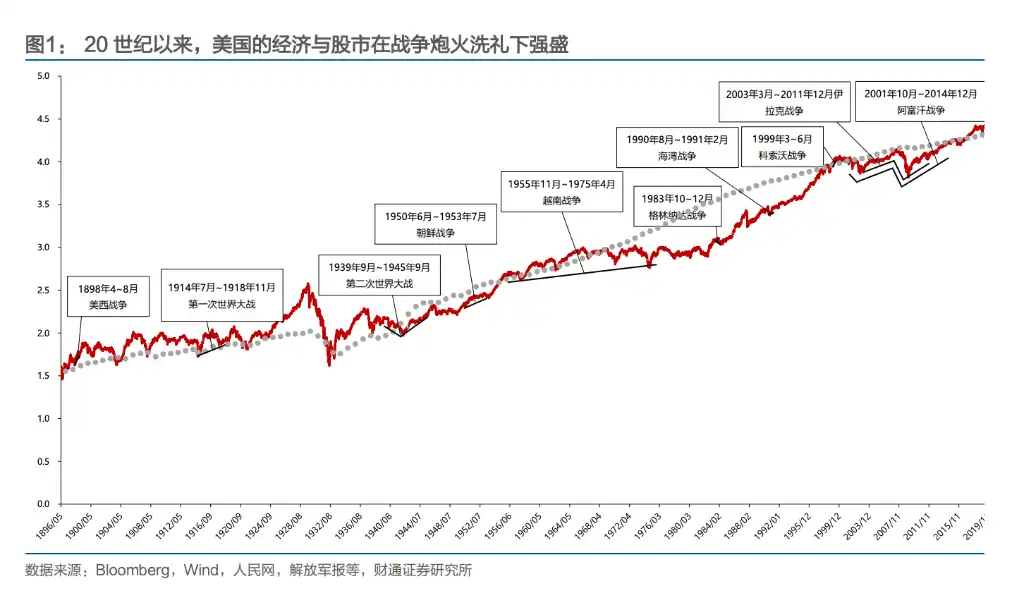
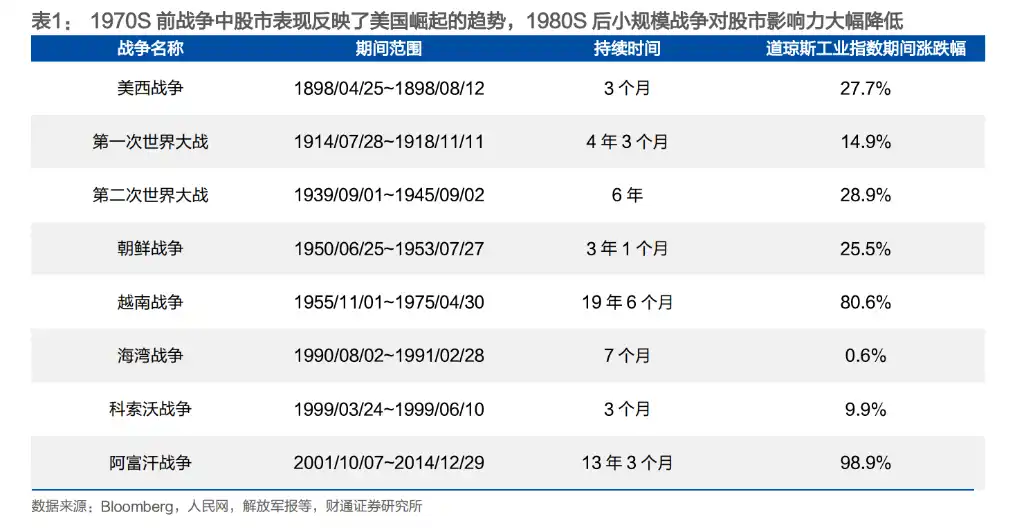
A report from Caitong Securities provides a straightforward answer: War and the long-term bull market in U.S. stocks are not opposites but rather symbiotic. The historical performance of the Dow Jones Industrial Average confirms this—it rose 28% during the Spanish-American War, 26% during the Korean War, and still gained over 80% during the 19-year Vietnam War, while nearly doubling during the Afghanistan War, which spanned the period around the 2008 financial crisis.

Since becoming the world's largest economy at the end of the 19th century, the U.S. has gained substantial benefits from most wars it fought, except for the Vietnam War. From seizing Spanish colonies in the Spanish-American War to profiting handsomely from the two World Wars, and further to the Gulf War and subsequent smaller-scale conflicts centered around oil resources, the U.S. completed its transformation from a 'war participant' to a 'war initiator.'

The reaction path of U.S. stocks amid the sound of gunfire is also clear: During WWII and earlier wars, the market was primarily impacted through sentiment shocks. Starting with the Korean War, this direct effect gradually weakened, and wars increasingly transmitted their impact to the stock market through economic channels like inflation, oil prices, and fiscal deficits.

The Vietnam War was the only war where the U.S. suffered a 'loss,' and it profoundly rewrote its war logic. Since then, almost every conflict initiated by the U.S. has shared three characteristics: short duration, limited geographic scope, and a focus on oil—with all ultimately achieving their objectives.
From 'Taking Advantage of a Fire' to Initiating Trouble: The Three Shifts in American War Strategy

The 1898 Spanish-American War was the first major war actively initiated by the U.S. At that time, domestic monopoly conglomerates urgently needed new markets, investment venues, and sources of raw materials, and Spain's crumbling colonial empire became the ideal target. After the war, the U.S. gained control over Cuba and acquired the Philippine Islands, Guam, and Puerto Rico. The Dow Jones Industrial Average rose 28% during the three-month war, in sync with victories on the main battlefields.

When World War I broke out, the U.S. initially remained neutral. During the market closure in July 1914, investors realized America would become the biggest beneficiary of the European conflict—its homeland, far from the battlefield, could continue production and export arms to Europe. By 1917, American banks, including J.P. Morgan, had provided $10 billion in loans to the British and French governments for purchasing weapons. Although the index fell nearly 10% after the official entry into the war in April 1917, the industrial index had already risen approximately 107% from its low in 1914 to March 1917.

World War II was the crucial conflict that established the U.S. as a global hegemon. At the outbreak in September 1939, U.S. stocks initially fell due to suppressed corporate earnings expectations from the 'excess profits tax'—Congress imposed a tiered tax of up to 95% on profits exceeding $5,000, severely dampening the numerator in the Dividend Discount Model (DDM). It wasn't until the Battle of the Coral Sea and the Battle of Midway in May 1942 turned the tide of war that investors keenly sensed the war's direction, leading U.S. stocks to bottom out and rebound ahead of time. The industrial index rose 82% in the latter half of the war, the transportation index rose 127%, and the utilities index surged 203%.

The Korean War was the first war the U.S. 'did not win.' Although military demand stimulated the post-WWII sluggish economy, the U.S. military failed to achieve its stated objectives. Nonetheless, the Dow Jones Industrial Average still rose 26% throughout the entire period, with the transportation index soaring 86%.

The Vietnam War became a watershed; it was the only war where the U.S. was defeated and gained no benefits.

The U.S. defense budget skyrocketed from $49.6 billion in 1961 to $81.9 billion in 1968 (43.3% of the federal budget), the fiscal deficit ballooned from $3.7 billion to $25 billion, and inflation rose from 1.5% to 4.7%. The U.S. share of the world's total GDP fell from 34% to less than 30%. Post-war, U.S. war strategy shifted completely: it abandoned large-scale ground wars in favor of short-duration, low-casualty, air-strike-centric 'proxy-style' conflicts.

Subsequent wars—the Gulf War, Kosovo War, Afghanistan War, and Iraq War—were all without exception initiated by the U.S., leveraging local conflicts or black swan events. The war zones were mainly concentrated in the Middle East and the Balkans, with the core objectives revolving around oil resource control and military demand.
The Transmission of War to the Stock Market Has Changed: From Sentiment-Driven to Economy-Driven

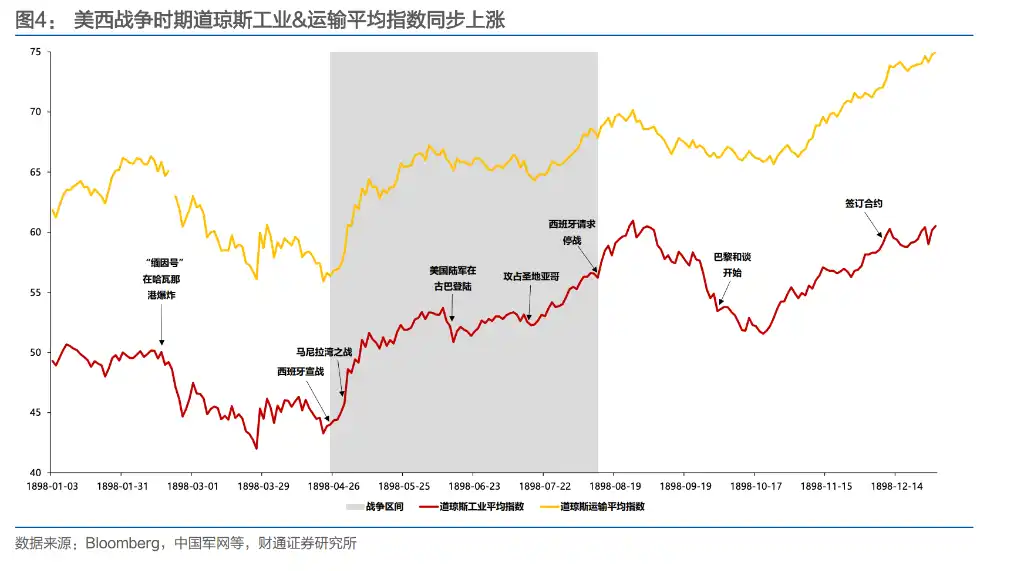
During WWII and earlier, war events often directly impacted investor sentiment. During the Spanish-American War, victories at the Battle of Manila Bay and the Battle of Santiago de Cuba each drove the index up by about 10% within ten days. In contrast, news of the U.S. entering the two World Wars often triggered panic selling.
But starting with the Korean War, this direct impact gradually faded. From November 1950 to February 1951, despite successive retreats by UN and U.S. forces, the U.S. stock market continued to rise—the reason being that the post-WWII stagnant economy restarted during the Korean War: U.S. real GDP grew about 8.7% in 1950 and remained above 8% in 1951. The fiscal expansion brought by the war, in turn, became a catalyst for economic recovery.

This shift became even more pronounced during the Vietnam War. The Battle of Ia Drang in November 1965 (the first large-scale battle for U.S. troops in Vietnam) did not cause a significant market shock; the 'Tet Offensive' launched by North Vietnam in early 1968 also failed to stop U.S. stocks from reaching new highs. What truly drove the market was instead the Federal Reserve tightening credit conditions in 1966 in response to Vietnam War expenditures, along with the two economic recessions of 1969-1970 and 1973-1975. War sentiment had given way to macroeconomic policy and corporate earnings.

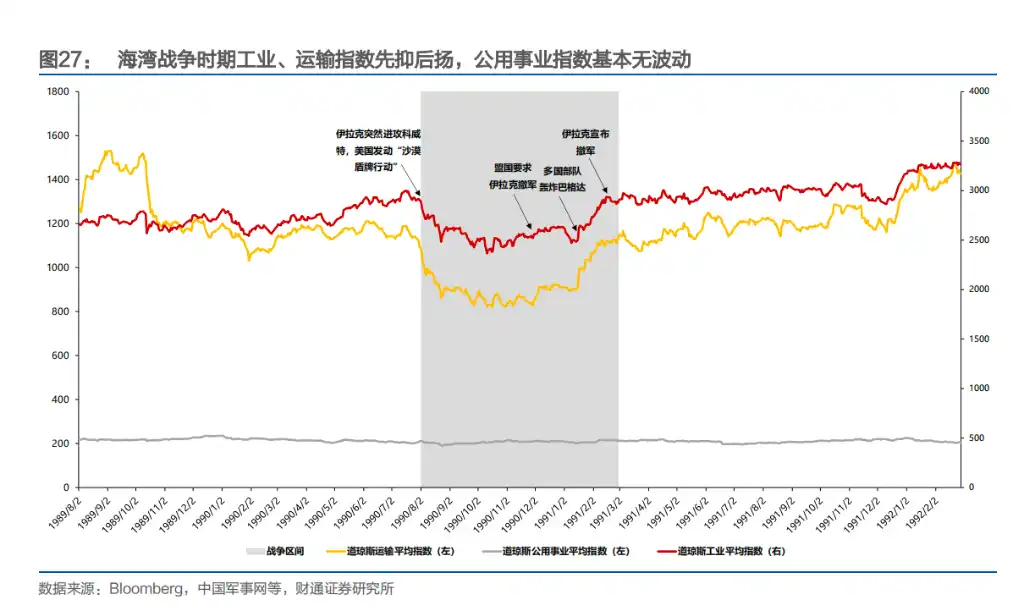
The Gulf War provides the clearest case of 'economic transmission.' After Iraq's invasion of Kuwait in August 1990, oil prices surged, and the market anticipated a U.S. economic recession, pushing S&P 500 valuations to a bottom. When coalition forces bombed Baghdad in January 1991, oil prices fell back to pre-war levels, and the stock market rebounded in sync. During the war, the Dow and crude oil prices moved almost perfectly inversely—the market was trading the trade-off between inflation and growth.

The 2001 Afghanistan War and the 2003 Iraq War further validated this pattern. The most symbolic moment was perhaps the killing of Osama bin Laden in May 2011—arguably the most breakthrough moment in the Afghanistan War. The next day, the Dow fell a mere 0.02%, and the S&P 500 declined 0.18%. The market almost completely ignored the news.

In summary, the reaction of U.S. stocks to war has undergone a clear evolution path: shifting from 'sentiment dominance' to 'economic transmission.' Early wars directly shook the market through news of victories and defeats, but since the Korean War, the stock market has increasingly focused on real economic variables like fiscal expansion, inflation expectations, oil price volatility, and monetary policy.

War itself is no longer the reason for rises or falls; how war affects growth and costs is what the market truly prices.

Which Industry Profits from War? The Answer is Changing

During WWII, coal was the lifeblood of war. Bituminous coal's share rose from 43.8% pre-war to 48.9%, and the industry cumulatively rose 415%.

During the Korean War, oil took over as the new protagonist. Crude oil extraction and refining took the top two spots for gains, with profits climbing continuously from mid-1950 to the first half of 1952. During the Vietnam War, the collapse of the Bretton Woods system forced the U.S. dollar to depreciate, and OPEC was allowed to raise prices to compensate for losses. The oil extraction industry exploded during the dollar crisis from late 1970 to early 1973, surging a staggering 1378% throughout the war.

The Kosovo War continued this pattern, with raw materials and energy industries performing best.

The Gulf War is the only exception—the transmission path shifted to the indirect mode of 'oil price → economic expectations,' making consumer staples and health industries advantageous in the short term, while energy, raw materials, industrials, and other heavy-asset sectors performed the worst.

A notable trend is: As the U.S. economy's size has expanded, the defense industry has transformed from a growth engine into a fundamental part of the economy. The marginal contribution of any single war to the overall economy has been declining, and the driving force for the stock market has increasingly shifted to macroeconomic variables like inflation, interest rates, and fiscal deficits.

Câu hỏi Liên quan

QAccording to the article, how has the relationship between war and the U.S. stock market evolved over time?

AThe relationship has evolved from one where war directly impacted the market through sentiment (e.g., WWII and earlier), to one where its influence is transmitted indirectly through economic channels like inflation, oil prices, and fiscal deficits (e.g., from the Korean War onwards). The market now prices how war affects growth and costs, not the war events themselves.

QWhat was the turning point in U.S. war strategy according to the analysis, and what were its key features?

AThe Vietnam War was the turning point. It was the only war the U.S. lost and gained no benefit from. Post-Vietnam, U.S. strategy shifted to conflicts characterized by being short in duration, small in scale, and centered around oil resources, often fought through proxies or with air power dominance.

QWhich sector benefited the most during World War II, and how did the leading sector change in subsequent major conflicts?

ADuring World War II, the coal industry benefited the most, with its share of production rising significantly. In subsequent conflicts, the leading sector shifted: petroleum took the lead during the Korean and Vietnam Wars. However, the Gulf War was an exception, where consumer staples and healthcare performed better due to the indirect economic transmission via oil prices.

QHow did the U.S. stock market react to key battlefield victories in early wars versus significant events in modern wars, such as the killing of Osama bin Laden?

AIn early wars like the Spanish-American War, key battlefield victories (e.g., Manila Bay) caused immediate and significant stock market rallies (~10% in 10 days). In contrast, modern wars show a muted direct reaction. For example, the killing of Osama bin Laden in 2011 resulted in only minor daily movements in major indices, indicating the market had become largely indifferent to such event-driven war news.

QWhat role did World War I and World War II play in America's rise to global economic dominance, according to the article?

AWorld War I allowed the initially neutral U.S. to profit massively by producing and exporting arms and supplies to European allies, with banks providing huge loans. World War II was the key conflict that cemented America's global霸主 (hegemony) status. Although initial war taxes suppressed corporate profits, the market rebounded strongly after pivotal battles turned the tide, and the war effort ultimately solidified the U.S. as the world's leading economic and military power.

Nội dung Liên quan

Tại sao cựu chiến lược gia Ngân hàng Mỹ nhận thấy 'đáy chiến thuật' của Ethereum

Cựu chiến lược gia Ngân hàng Mỹ Stephen Suttmeier nhận định Ethereum (ETH) có thể đang hình thành một "đáy chiến thuật". Ông lập luận rằng nếu giá duy trì trên mức 1.690-1.700 USD, nó sẽ củng cố luận điểm về một mức đáy chiến thuật hình thành trên đáy tháng 6. Việc khôi phục mức 1.800 USD sẽ là một xác nhận khác. Phân tích kỹ thuật của ông chỉ ra rằng nếu ETH vượt lên và giữ vững trên đường trung bình động 50 ngày (khoảng 1.800 USD), mục tiêu tăng tiếp theo có thể là đường trung bình động 200 ngày ở mức 2.200 USD, hàm ý tiềm năng tăng 25% nếu vượt qua được ngưỡng 2.100 USD. Biểu đồ hàng ngày cũng cho thấy mô hình đáy đôi, ủng hộ khả năng đảo chiều tăng. Tuy nhiên, một số chỉ số on-chain lại không quá lạc quan. Áp lực bán trên các sàn giao dịch đã tăng 6% trong vài ngày gần đây, với hơn 220k ETH được chuyển lên sàn, làm chậm đà phục hồi. Các cá voi cũng đang giảm mức tiếp xúc với ETH. Ngoài ra, dòng tiền vào các ETF spot của Mỹ, vốn hỗ trợ đà tăng hồi đầu tháng 7, đã chuyển sang âm với dòng ròng rút ra 52 triệu USD vào thứ Năm, chủ yếu do leo thang căng thẳng giữa Mỹ-Iran và những lo ngại từ thị trường trái phiếu. Tóm lại, ETH có tiềm năng tăng 25% lên mức 2.100 USD nếu giữ vững trên 1.800 USD, nhưng áp lực bán từ cá voi, dòng ETF âm và các rủi ro vĩ mô, địa chính trị có thể làm mất hiệu lực triển vọng tăng này.

ambcrypto7 phút trước

Tại sao cựu chiến lược gia Ngân hàng Mỹ nhận thấy 'đáy chiến thuật' của Ethereum

ambcrypto7 phút trước

Gói phần mềm Injective bị tấn công chuỗi cung ứng độc hại – Chi tiết

Gói phần mềm Injective SDK đã trở thành mục tiêu của một cuộc tấn công chuỗi cung ứng độc hại. Kẻ tấn công đã chiếm quyền truy cập tài khoản GitHub của một cộng tác viên hợp pháp của Injective Labs, sau đó tải lên npm một phiên bản độc hại của gói TypeScript SDK, @injectivelabs/sdk-ts v1.20.21. Mã độc được ngụy trang dưới vỏ bọc tính năng đo lường, nhưng thực chất nó chỉ kích hoạt khi các nhà phát triển sử dụng các hàm tạo ví như `fromMnemonic` hoặc `fromHex` để đánh cắp khóa riêng tư và cụm từ hạt giống. Điều này cho phép kẻ tấn công tái tạo và chiếm đoạt ví tiền mã hóa của nạn nhân. Cuộc tấn công còn lan rộng thông qua các phụ thuộc chuyển tiếp trong 17 gói Injective bổ sung phụ thuộc vào SDK này, với khoảng 50.000 lượt tải xuống mỗi tuần. Mặc dù một phiên bản sạch (v1.20.23) đã được phát hành sau đó, phiên bản bị xâm phạm vẫn có sẵn trên npm dưới dạng gói không còn được khuyến nghị. Để bảo vệ bản thân, người dùng được khuyến cáo nên xoay vòng tất cả thông tin xác thực bị ảnh hưởng, tạo ví mới và chuyển tiền của họ. Sự cố này xảy ra cùng thời điểm với vụ việc BonkDAO thất thoát 20 triệu USD do một "đề xuất quản trị độc hại".

ambcrypto3 giờ trước

Gói phần mềm Injective bị tấn công chuỗi cung ứng độc hại – Chi tiết

ambcrypto3 giờ trước

Sau khi Aave rời đi và TVL biến động mạnh, điểm neo định giá của MegaETH nằm ở đâu?

Dựa trên dữ liệu từ DefiLlama, MegaETH đã trải qua biến động mạnh về TVL toàn chuỗi từ ngày 9-10/7, giảm gần 60% trong 24 giờ và giảm khoảng 70% so với đỉnh tháng 5. Giao thức hàng đầu Aave V3 đã rút khoảng 80% thanh khoản. Giá MEGA giảm xuống khoảng $0.048, vốn hóa thị trường chỉ còn khoảng 54 triệu USD với FDV khoảng 4.8 tỷ USD. Bài viết chỉ ra rằng TVL của MegaETH phụ thuộc cao vào một giao thức duy nhất (Aave chiếm tới 90% TVL đỉnh) và các chiến lược vòng lặp ổn định币, chủ yếu dựa vào chênh lệch lợi suất. Khi lợi nhuận từ các chiến lược này biến mất, dòng tiền nhanh chóng rút đi, để lại câu hỏi về giá trị cơ bản thực sự của chuỗi. Có ba sự không phù hợp chính được nêu bật: 1. **Định giá so với mức độ sử dụng thực tế:** FDV ~4.7 tỷ USD tương phản với doanh thu giao thức thực tế hàng năm chỉ khoảng 10 triệu USD và số địa chỉ hoạt động hàng ngày thấp. 2. **Truyện thuyết token so với chất lượng hệ sinh thái:** Phần lớn doanh thu thực tế đến từ một trò chơi thẻ bài (Monster), không phải từ các giao thức DeFi như kỳ vọng. Stablecoin gốc USDm có khối lượng giao dịch thấp. 3. **Kỳ vọng ngắn hạn so với khả năng thực hiện dài hạn:** Các dự án lớn như Uniswap và Aave có TVL sụt giảm nghiêm trọng, cho thấy dòng tiền chủ yếu là đầu cơ chứ không ổn định. Tình trạng tương tự cũng được quan sát thấy ở các chuỗi công khai mới nổi khác như Monad, cho thấy thị trường đang giảm bớt sự định giá cao dựa trên TVL và truyện thuyết, thay vào đó yêu cầu các hoạt động kinh tế thực tế rõ ràng hơn. Kết luận, khi sự thịnh vượng trên sổ sách do dòng tiền khuyến khích và đầu cơ biến mất, MegaETH thiếu một điểm tựa giá trị vững chắc. Mọi sự phục hồi trong tương lai có khả năng đến từ việc sửa chữa tâm lý thị trường ngắn hạn hơn là sự cải thiện cơ bản, trừ khi đội ngũ có thể chuyển đổi thanh khoản thành việc sử dụng thực tế và xây dựng hệ sinh thái bền vững.

链捕手3 giờ trước

Sau khi Aave rời đi và TVL biến động mạnh, điểm neo định giá của MegaETH nằm ở đâu?

链捕手3 giờ trước

Báo cáo chuyên sâu của Goldman Sachs: Ai sẽ là người chiến thắng dài hạn trong ngành công nghiệp mô hình AI lớn của Trung Quốc?

Trung Quốc đang ở bước ngoặt lịch sử trong lĩnh vực mô hình AI lớn, với hiệu suất của các mô hình mã nguồn mở/mở quyền tiếp cận mô hình độc quyền hàng đầu toàn cầu. Báo cáo của Goldman Sachs nhấn mạnh sự đột phá về hiệu quả chi phí và kiến trúc, cho phép các mô hình Trung Quốc (DeepSeek, GLM5.2 của Zhipu, M3 của MiniMax) đạt hiệu năng tương đương với quy mô tham số chỉ bằng 2-10%. Thị trường đang hình thành cấu trúc hai tầng: tầng cao cấp (ví dụ: GLM5.2, Qwen3.7 Max) định giá khoảng 1 USD/triệu token, và tầng giá rẻ phục vụ doanh nghiệp vừa và nhỏ toàn cầu. Doanh thu API/dịch vụ thuê bao dự kiến tăng mạnh từ 350 tỷ NDT (2026) lên 8.790 tỷ NDT (2030). Chiến lược mã nguồn mở giúp mở rộng nhanh nhưng hạn chế khả năng hiện thực hóa doanh thu. Xu hướng có thể chuyển sang mô hình "mở quyền + giấy phép cộng đồng" với chia sẻ doanh thu. Goldman Sachs xác định các công ty có vị thế cạnh tranh mạnh nhất dựa trên khung đánh giá 3 chiều: Khả năng định giá, Lợi thế chi phí và Năng lực tài chính. - **Mô hình văn bản cơ bản:** Zhipu AI và DeepSeek có vị thế mạnh nhất. - **Đa phương thức/Tạo video:** ByteDance (Seed) dẫn đầu, tiếp theo là Kuaishou (Kling) và MiniMax (Hailuo/H3). Báo cáo duy trì xếp hạng Mua cho MiniMax và Kuaishou.

marsbit3 giờ trước

Báo cáo chuyên sâu của Goldman Sachs: Ai sẽ là người chiến thắng dài hạn trong ngành công nghiệp mô hình AI lớn của Trung Quốc?

marsbit3 giờ trước

Báo cáo chuyên sâu của Goldman Sachs: Ai sẽ trở thành người chiến thắng lâu dài trong ngành mô hình AI lớn của Trung Quốc?

Báo cáo chuyên sâu của Goldman Sachs phân tích ngành mô hình AI lớn Trung Quốc tại thời điểm chuyển đổi lịch sử, cho rằng hiệu suất của các mô hình mã nguồn mở/mở quyền Trung Quốc đang tiệm cận các mô hình độc quyền hàng đầu thế giới nhờ đột phá về kiến trúc và hiệu quả tham số, giúp đạt hiệu năng tương đương với chi phí thấp hơn đáng kể. Báo cáo nêu bật cấu trúc thị trường hai tầng: phân khúc cao cấp (GLM5.2, Qwen3.7 Max) định giá ~1 USD/triệu token và phân khúc giá rẻ (~0.06-0.2 USD/triệu token) để mở rộng toàn cầu. Chiến lược mã nguồn mở thúc đẩy việc áp dụng rộng rãi nhưng hạn chế khả năng monetize. Ngành dự kiến chuyển sang mô hình "mở quyền + giấy phép cộng đồng" để chia sẻ doanh thu. Thị trường mục tiêu chính là mở rộng quốc tế, đặc biệt bên ngoài Mỹ, nơi các mô hình Trung Quốc được kỳ vọng tăng thị phần nhờ giá cả cạnh tranh và xu hướng doanh nghiệp chuyển trọng tâm từ tối đa hóa token sang ưu tiên ROI. Sử dụng khung đánh giá dựa trên khả năng định giá, lợi thế chi phí và sức mạnh tài chính, Goldman Sachs xác định Zhipu AI và DeepSeek là những công ty có vị thế mạnh nhất trong lĩnh vực mô hình văn bản cơ bản, trong khi ByteDance (với Seed) dẫn đầu về đa phương thức/tạo video. Báo cáo duy trì xếp hạng Mua cho MiniMax và Kuaishou. Doanh thu API/dịch vụ thuê bao từ các mô hình AI Trung Quốc dự báo tăng mạnh từ ước tính 35 tỷ NDT năm 2026 lên 879 tỷ NDT vào năm 2030.

链捕手3 giờ trước

Báo cáo chuyên sâu của Goldman Sachs: Ai sẽ trở thành người chiến thắng lâu dài trong ngành mô hình AI lớn của Trung Quốc?

链捕手3 giờ trước

Giao dịch

Giao ngay
活动图片