Is the Fastest and Deepest Tech Stock Sell-off in History Nearing Its End?

marsbitPublished on 2026-07-19Last updated on 2026-07-19

Abstract

The article discusses whether the historically rapid and severe sell-off in tech momentum stocks is nearing its end. Citing analysis from Goldman Sachs and Morgan Stanley, it notes that the TMT momentum factor has plunged 40% from its peak in just 17 trading days, marking the fastest and deepest such decline on record. Key experts, including Goldman's Mark Wilson, attribute the crash primarily to extreme crowding, high leverage, and structural factors rather than a fundamental deterioration in the economy or corporate earnings. They point to strong underlying data, such as robust bank lending and raised guidance from companies like TSMC, which contrast sharply with the market's price action. While Wilson suggests the momentum unwinding process is likely "approaching its end," he cautions that immediate catalysts for a sharp reversal are lacking. The report highlights extreme internal market stress, with single-stock volatility far exceeding index volatility, and warns that despite the sell-off, positioning in momentum factors remains elevated. It concludes that the core market矛盾 (contradiction) lies in this disconnect between solid fundamentals and violent price corrections driven by positioning and leverage.

Source: Wall Street Insights

Tech momentum trading is experiencing its most severe unwinding in history. In just 17 trading days, the U.S. stock technology momentum factor (TMT MoMo) has plunged 40% from its peak, setting a record for the fastest and deepest drawdown on record, with contagion spreading comprehensively from semiconductors to hedge funds and credit markets.

Mark Wilson, partner and head of EMEA hedge fund business at Goldman Sachs, provided a systematic review of this "brutal rotation" this week. He noted that this sell-off is historically rare in both speed and depth, but its root cause stems more from non-fundamental factors such as crowded positioning and concentrated leverage, rather than a substantial deterioration in the economy or corporate earnings. He stated that the unwinding process for the momentum factor is "nearing its end," but lacks an immediate catalyst for reversal in the short term.

It is noteworthy that this momentum breakdown occurred against a backdrop of overall robust macro and corporate fundamentals—U.S. banks reported a 17% year-on-year increase in corporate lending, TSMC raised its 2026 revenue growth guidance to over 40%, and inflation data also came in moderately below expectations. This divergence between fundamentals and market price action is the core contradiction in the current market.

Tech Momentum Factor Suffers Historic Sell-off, Drawdown Speed and Depth Exceed Historical Median

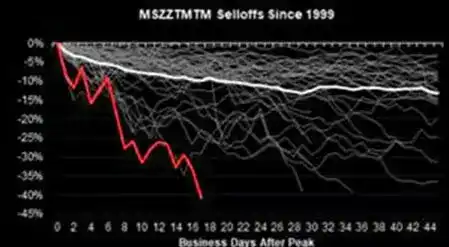
According to data from Morgan Stanley's Quantitative and Derivatives Strategy team (MS QDS), this momentum factor drawdown has lasted 17 trading days, with a peak-to-trough decline of 28%. In comparison, the median momentum factor drawdown since 1999 has been 22%, lasting an average of 33 trading days.

This means the current decline has exceeded the historical median in both speed and depth, marking the most severe episode since the 29% drawdown from December 2022 to February 2023.

The situation is even more extreme in the tech sector. The TMT momentum factor (TMT MoMo) has fallen 40% from its peak. According to MS QDS data, this represents the fastest and deepest sell-off ever for the tech momentum factor.

Looking across various subsectors, South Korea's Kospi index is down 27% from its peak, U.S. AI tech beneficiaries are down 25%, global memory chip stocks are down 36%, and European semiconductors are down 23%. Among these, memory chip stocks account for about two-thirds of the overall decline, while the broader AI beneficiaries are down about 24% from their highs.
Low Surface Volatility Masks High Internal Intensity, Market Risk Structure is Unraveling

Price declines are only the surface manifestation of this turmoil; changes in the market's internal risk structure are equally noteworthy.

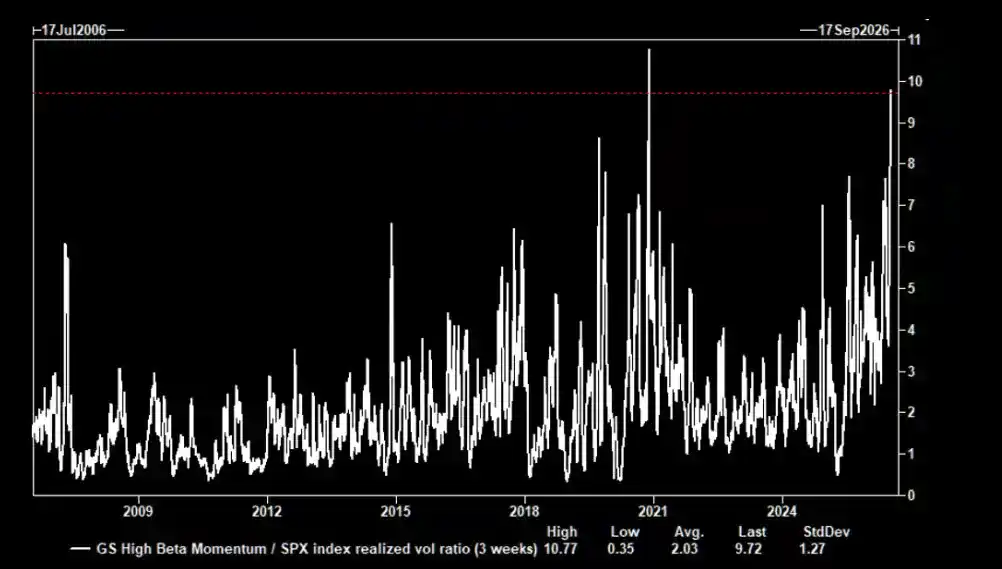
According to Goldman Sachs' volatility trading desk data, the current volatility of Goldman Sachs' High Beta Momentum portfolio (GSPRHIMO) is approximately 10 times that of the S&P 500's volatility. In the historical backtest over the past 20 years, such a stark volatility ratio has only been comparable to the situation during the pandemic shock in November 2020.
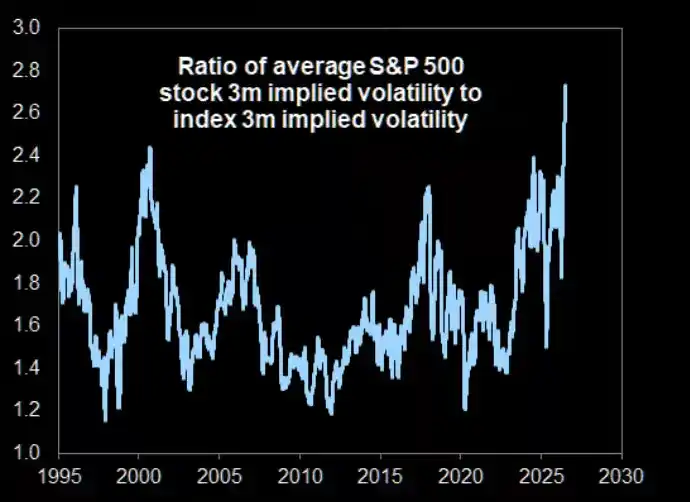
Simultaneously, the gap between single-stock volatility and index volatility has widened to historical extremes. Goldman Sachs data shows that the three-month average implied correlation among S&P 500 constituents fell to a record low of 0.14 this week, causing the S&P 500 index volatility to remain low, while the average implied volatility for single stocks is as high as 40%, 2.8 times that of the index's implied volatility, also setting a historical record.
Positions Remain Crowded, Risks Not Yet Cleared

Despite the recent historic drawdown in the momentum factor, hedge funds' net exposure to it remains high from a long-term perspective. J.P. Morgan data indicates that the combination of current positioning levels and the magnitude of the drawdown continues to make the momentum factor one of the core risks most deserving of caution in the market.

Meanwhile, the Goldman Sachs High Beta Momentum factor has fallen 33% since its June high, with its year-to-date gain plummeting from 60% to just 12%, a development also noted by Mark Wilson.

He cited signs of deleveraging in the Korean market as evidence: reports indicate that approximately one in every 30 South Korean adults had their stock margin accounts forcibly liquidated this week, showing that the deleveraging process has unfolded to a considerable extent.

Fundamentals Remain Sound, Risks Lie in Positioning and Structure

The peculiar aspect of this momentum breakdown is that it occurred against a backdrop of generally positive corporate fundamentals and macroeconomic data.

Mark Wilson pointed out that U.S. bank earnings this week presented an "unmistakably positive reading" of economic conditions: corporate lending grew 17% year-on-year, a record high, covering all economic sectors; U.S. consumer spending tracker growth is in the mid-single digits, with credit card spending up 6%; investment banking-related business lines collectively grew over 40%; large banks' tangible common equity return reached 19%, a post-financial crisis high.

On the tech capital expenditure front, TSMC raised its 2026 revenue growth guidance to over 40% (based on a revenue base exceeding $150 billion), while ASML's earnings report sparked market expectations for a 15% to 30% upward revision in its EPS over the next one to three years.

However, both companies' share prices fell following their earnings announcements, displaying a classic "sell the news" pattern. In contrast, IBM's stock price suffered its largest single-day drop in over 20 years due to large contract delays and underperformance in its consulting business.

Mark Wilson emphasized that this sell-off is "difficult to pinpoint to a clear signal at the fundamental level," reflecting more the influence of structural factors such as positioning, leverage, crowding, and concentration.

Rotation Nearing End, But Reversal Catalyst Still Awaited

Mark Wilson stated that he is inclined to believe the unwinding process for the momentum factor is nearing its end, but he also noted that there is a lack of immediate summer catalysts to drive a market reversal in the short term.

He also suggested that as efficiency and commercial viability improve, new market leadership will gradually emerge, and market breadth will expand accordingly—the Dow Jones Transportation Average breaking to new highs again this week serves as one example.

However, he also warned that the second derivative of earnings growth (i.e., the slowdown in the growth rate) will become increasingly important as the market digests Q2 earnings and enters the summer, while current valuation metrics across the board indicate that tech sector valuations remain elevated.

Furthermore, abnormal breakdowns in correlations are occurring both between traditional asset classes and within them; for example, the three-month correlation between gold and crude oil has fallen to an extreme inverse level in its 35-year history, further increasing the difficulty of risk management and portfolio construction.


Related Questions

QWhat is the historical context of the current tech momentum factor sell-off in terms of speed and depth?

AAccording to the article, the current tech momentum factor (TMT MoMo) sell-off is the fastest and deepest on record, having fallen 40% from its peak in just 17 trading days. Historically, momentum factor drawdowns have a median decline of 22% over an average of 33 trading days.

QAccording to Mark Wilson of Goldman Sachs, what is the primary cause of this momentum factor sell-off?

AMark Wilson of Goldman Sachs attributes the sell-off primarily to structural factors like crowded positioning, concentrated leverage, and high congestion, rather than a deterioration in economic or corporate earnings fundamentals.

QDespite the market sell-off, what positive signals are mentioned regarding the underlying economic and corporate fundamentals?

AThe article highlights robust fundamentals: U.S. bank corporate loan growth at 17%, TSMC raising its 2026 revenue growth guidance to over 40%, and inflation data coming in softer than expected. Bank earnings also showed strong consumer spending and high returns on tangible equity.

QWhat does the data say about the current volatility and risk structure within the market during this event?

AThe volatility of Goldman Sachs's high-beta momentum basket is about 10 times that of the S&P 500, a disparity only seen during the November 2020 pandemic shock. Additionally, the correlation among S&P 500 stocks is at a record low, causing single-stock implied volatility to be 2.8 times higher than index volatility.

QWhat is Mark Wilson's outlook on the momentum factor sell-off and the potential for a market reversal?

AMark Wilson believes the momentum factor unwinding process is 'nearing its end.' However, he notes a lack of immediate catalysts for a sharp reversal in the near term (summer), and warns that valuations remain elevated and that the second derivative of earnings growth (a slowdown in growth acceleration) will become more important.

Related Reads

Hyperliquid API Wallet Permissions Keep Expanding: Once an AI Agent Is Attacked, It Could Drain the Main Account

As personal AI agents take over everyday financial decisions, Hyperliquid is seen as an ideal decentralized trading foundation thanks to its deep liquidity and composability. However, the API wallets that underpin automated trading have quietly seen their security boundaries erode across network upgrades over the past year. Lacking fine-grained permission policies, a compromised API wallet can even trigger staking slashing, spot locking, and priority fee burning, exposing the main account to total loss. The article traces how API wallets—originally scoped to prevent direct withdrawals or external transfers—have accumulated expanded permissions through successive upgrades, with no cap on margin exposure. A maliciously altered API wallet controlling an account with over ~$40M could buy 500,000 HYPE, stake it, link it to a malicious HIP-3 market, invite slashing, and lock the main account's funds for 183 days. Because API wallets are now the default trading method across the Hyperliquid frontend and third-party apps, and agents must interact with untrusted internet environments, prompt injection or key leakage can let attackers drain funds without ever stealing a private key. Existing fine-grained control via HyperEVM smart contracts introduces too much latency for high-frequency trading, while custodial solutions outsource trust to centralized middleware. The proposed fix is a lightweight bitmap permission field set at API wallet creation, recording which operation types the wallet may trigger—mirroring the mechanism already used in HIP-3 deployer sub-lists. Validating the signer against the main account's bitmap adds negligible overhead, and critically, old API wallets would never auto-inherit new permissions from future L1 upgrades. This would safely unlock staking and transfer interfaces, remove reliance on centralized custody, and pave the way for large-scale personal AI agent adoption on HyperCore.

marsbit22m ago

Hyperliquid API Wallet Permissions Keep Expanding: Once an AI Agent Is Attacked, It Could Drain the Main Account

marsbit22m ago

Upbit and Bithumb Customer Deposits Plunge 31.86%, Falling $1.87 Billion in 2026

Customer deposits in South Korean won at Upbit and Bithumb, South Korea's two largest crypto exchanges, fell 31.86% in the first nine months of 2026, according to regulatory disclosures published November 17. The platforms held about ₩5.36 trillion ($4 billion) in customer cash at end-September, down from ₩7.87 trillion at end-2025—a reduction of roughly ₩2.51 trillion ($1.87 billion). Upbit operator Dunamu saw deposits drop 31.9% from ₩5.83 trillion to ₩3.97 trillion, while Bithumb fell 31.8% from ₩2.04 trillion to ₩1.39 trillion. The figures were disclosed via South Korea's Financial Supervisory Service electronic filing system. Customer crypto holdings also lost value: Upbit's book value fell 10.9% from ₩62.23 trillion to ₩55.46 trillion, and Bithumb declined 13.1% from ₩17.90 trillion to ₩15.56 trillion. However, quantities of several major cryptocurrencies held for customers increased despite lower valuations—Upbit added 13,259 Bitcoin, 337,609 Ether and 1.22 million Solana versus year-end levels, and Bithumb reported higher holdings of Bitcoin, Ether, XRP and Solana. The data indicate the deposit decline does not necessarily mean investors withdrew entirely from the crypto market; disclosures do not explain whether funds went to bank accounts, crypto purchases or elsewhere. The drop comes amid weaker trading activity in South Korea's digital asset market, adding pressure on major exchanges.

TheNewsCrypto53m ago

Upbit and Bithumb Customer Deposits Plunge 31.86%, Falling $1.87 Billion in 2026

TheNewsCrypto53m ago

Trading

Spot
活动图片