Hyperliquid with Trillions in Trading Volume: How to Break the Thin Profit Curse

比推Xuất bản vào 2025-12-18Cập nhật gần nhất vào 2025-12-18

Tóm tắt

Hyperliquid, a decentralized exchange, processes massive trading volumes (annualized $617B in perps) but captures minimal fees—only ~3.9 bps—compared to retail-centric platforms like Coinbase (35.5 bps) and Robinhood (33.5 bps). This reflects a structural divide: Hyperliquid operates at the "market layer" (like Nasdaq), offering low-margin execution, while brokers profit from higher-margin services like custody, lending, and subscriptions. Hyperliquid’s open architecture—via Builder Codes (third-party frontends) and HIP-3 (external product deployment)—fuels growth but risks commoditizing its core exchange, as third parties capture user relationships and routing leverage. Recent strategic shifts aim to defend its position: halting subsidies for external frontends, launching USDH (a native stablecoin) to capture reserve yields, and introducing portfolio margin to earn interest on lending. The protocol is evolving toward a hybrid model—balancing open infrastructure with broker-like revenue streams (e.g., balance-based earnings)—to avoid being trapped in low-margin wholesale execution. The key challenge for 2026 is achieving this shift without undermining its ecosystem-friendly approach.

Source: BlockRearch

Original Title: Hyperliquid crossroads: Robinhood or Nasdaq economics

Compiled and Edited by: BitpushNews


Hyperliquid is currently in the phase of clearing Nasdaq-level perpetual contract (Perp) trading volume, but earning only thin profits. Over the past 30 days, it cleared $205.6 billion in notional value of perpetual contracts (annualized quarterly rate of $617 billion), yet generated only $80.3 million in fees, with a monetization rate of just about 3.9 basis points.

Its monetization model resembles more of a wholesale execution venue.
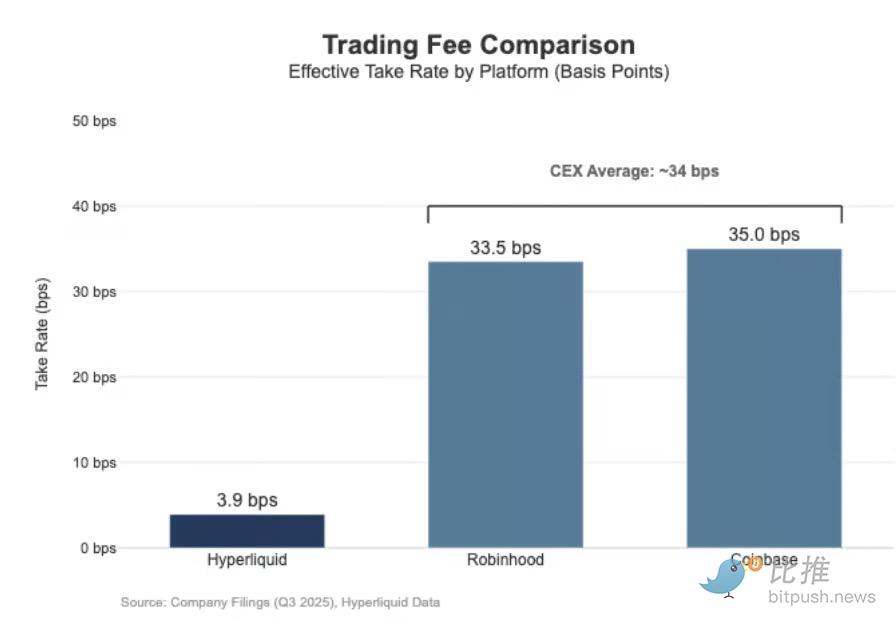
In comparison, Coinbase reported its Q3 2025 trading volume as $295 billion, with trading revenue of $1.046 billion, implying a Take Rate of 35.5 basis points.

Robinhood exhibits similar retail monetization characteristics in the cryptocurrency space: its $80 billion in cryptocurrency notional trading volume brought in $268 million in trading revenue, implying a monetization rate of 33.5 basis points; meanwhile, its stock trading notional value for Q3 2025 was $647 billion.

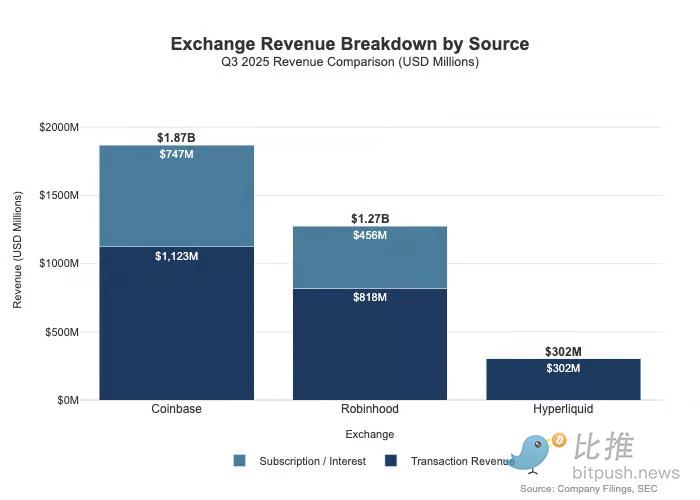
The gap is even larger than what the fee rates suggest, as retail platforms possess multi-dimensional monetization paths. In Q3 2025, Robinhood generated $730 million in transaction-based revenue, plus $456 million in net interest income and $88 million in other revenue (primarily driven by Gold subscription services).

In contrast, Hyperliquid currently relies heavily on trading fees, and these fees are structurally constrained at the protocol level to single-digit basis points.
The Difference in Positioning: Distributor vs. Market Layer

This difference is best explained by positioning: Coinbase and Robinhood belong to the broker/distribution business, monetizing through balance sheets and subscription services; whereas Hyperliquid is closer to the exchange layer (market layer). In traditional market structure, the profit pool is divided between these two layers.

The core divide in traditional finance (TradFi) is "Distribution" vs. "Market":

  • Distribution Layer (e.g., Robinhood and Coinbase): They own the customer relationship and occupy the high-margin环节.

  • Market Layer (e.g., Nasdaq): They exist as exchanges, with pricing power structurally constrained, and execution businesses tend towards "commoditized" economics due to competition.

1. Broker-Dealer = Distribution + Customer Balance Sheet

Brokers own the customer relationship. Most users do not access Nasdaq directly but enter the market through brokers. Brokers handle deposits, custody, margin/risk management, customer service, and tax documents, then route orders to various trading venues. This ownership of the relationship creates monetization capabilities beyond trading:

  • Balances: Cash sweep spreads, margin lending, securities lending.

  • Packaging: Subscription services, bundles, co-branded cards/advisory services.

  • Routing Economics: Brokers control the flow and can embed payments or revenue-sharing mechanisms in the routing chain.

    This is why brokers' profitability often surpasses that of trading venues: the profit pool is concentrated where distribution and balances reside.

2. Exchange = Matching + Rulebook + Infrastructure (Constrained Take Rate)

Exchanges operate the venue: matching, setting market rules, deterministic execution, and connectivity. Their monetization methods include:

  • Trading Fees: Compressed by competition in high-liquidity products.

  • Rebates/Liquidity Programs: Often forced to return most nominal fees to makers to attract liquidity.

  • Market Data, Connectivity/Co-location Services.

  • Listing Fees and Index Licensing.

Robinhood's routing logic clearly demonstrates this architecture: the broker (Robinhood Securities) owns the users and routes orders to third-party market centers, with routing revenue shared throughout the chain. Distribution is the high-margin layer: it controls customer acquisition and the monetization domains around execution (payment for order flow, margin, securities lending, subscriptions).

Nasdaq is the thin-margin layer. Its product is commoditized execution capability and queue access, and its pricing power is mechanically suppressed because venues need to pay maker rebates to win liquidity, regulation caps access fees, and routing is extremely flexible. In Nasdaq's disclosures, this is reflected in net cash equity capture per share of just fractions of a cent.
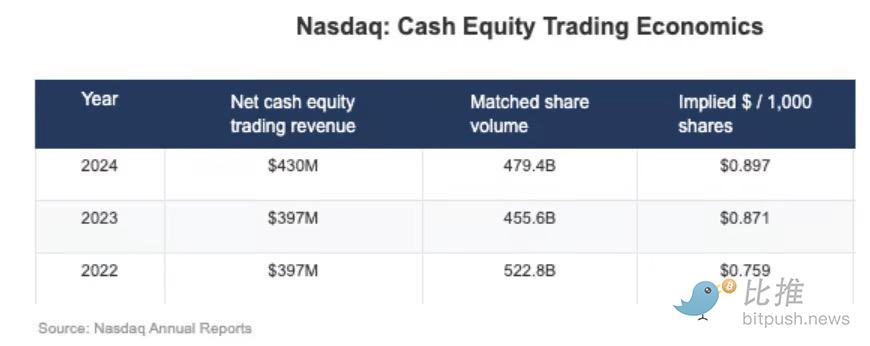
The strategic consequence of these low margins is evident in Nasdaq's revenue mix. In 2024, its Market Services revenue was $1.02 billion, accounting for only 22% of total revenue of $4.649 billion; this proportion was 39.4% in 2014 and 35% in 2019. This aligns with its strategy of shifting from market-sensitive execution business to more sustainable software/data businesses.

Hyperliquid's "Nasdaq Path"

Hyperliquid's effective take rate of about 4 basis points aligns with its deep focus on the "market layer." It is building an on-chain Nasdaq simulator: an architecture with high throughput, margin management, and a clearing stack (HyperCore), employing maker/taker pricing and maker rebates, aimed at optimizing execution quality and shared liquidity, rather than单纯的 retail monetization.

This is reflected in two design separations, similar to TradFi, that most crypto venues lack:
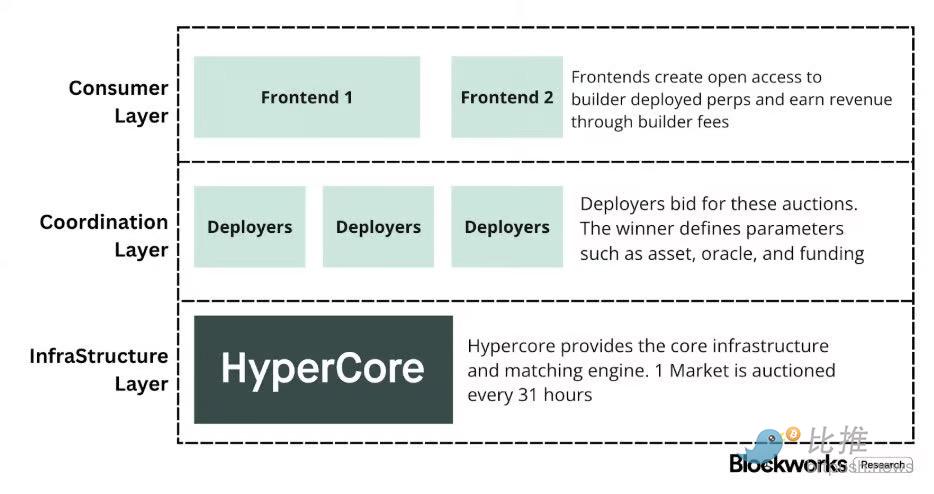
A) Permissioned Distribution/Layer (Builder Codes)

"Builder Codes" allow third-party interfaces to be deployed on top of the core trading venue and charge their own economic fees. Builder fees are capped at 0.1% (10 bps) for perps and 1% for spot, and can be set per order. This creates a competitive market for distribution, rather than a single-app monopoly.

B) Permissioned Listing/Product Layer (HIP-3)

In TradFi, exchanges control listings and product creation. The HIP-3 protocol externalizes this function: builders can deploy perpetual contracts that inherit the HyperCore stack and API, with the deployer responsible for defining and operating the market. Economically, HIP-3 formalizes revenue sharing between the venue and the product: spot and HIP-3 perp deployers can retain up to 50% of the trading fees from the deployed assets.

Builder Codes have already won on distribution; by mid-December, about one-third of users were trading through third-party frontends rather than the native UI.

Structural Pressure and Defense
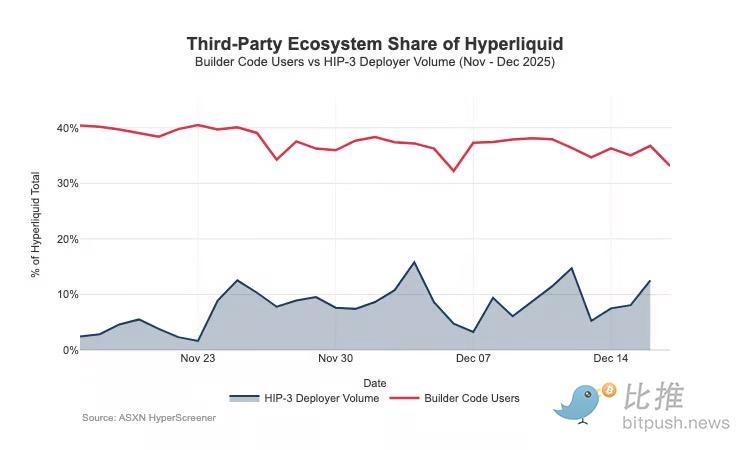
The problem is: this structure that fosters distribution growth will also predictably depress the venue's earnings:

  • Price Compression: Multiple frontends selling the same backend liquidity will push competition towards the lowest total cost; Builder fees can be adjusted per order, pushing pricing towards the bottom line.

  • Monetization Domain Drain: Frontends own deposits, bundling, subscriptions, and workflows; they capture the broker-layer profits, while Hyperliquid can only retain the thin venue earnings.

  • Strategic Routing Risk: If frontends become true cross-platform routers, Hyperliquid will be forced into a race for wholesale execution, retaining流量 only by cutting fees or increasing rebates.

Hyperliquid deliberately chose the thin-margin market layer (via HIP-3 and Builder Codes), while allowing a thick-margin broker layer to emerge on top of it. If third-party frontends continue to expand, they will increasingly dictate user-facing economics, control retention domains, and gain routing leverage, thereby structurally depressing Hyperliquid's take rate in the long term.

Commoditization is clearly the biggest risk. If third-party frontends can consistently underprice the native UI and eventually achieve cross-platform routing, Hyperliquid could be reduced to an extremely thin-margin wholesale clearing channel.

Strategic Pivot: Defending Distribution & Broadening Revenue

Recent design choices indicate that Hyperliquid is attempting to prevent the above outcome while broadening its revenue sources.
  1. Distribution Defense: Maintaining Native UI Economic Competitiveness

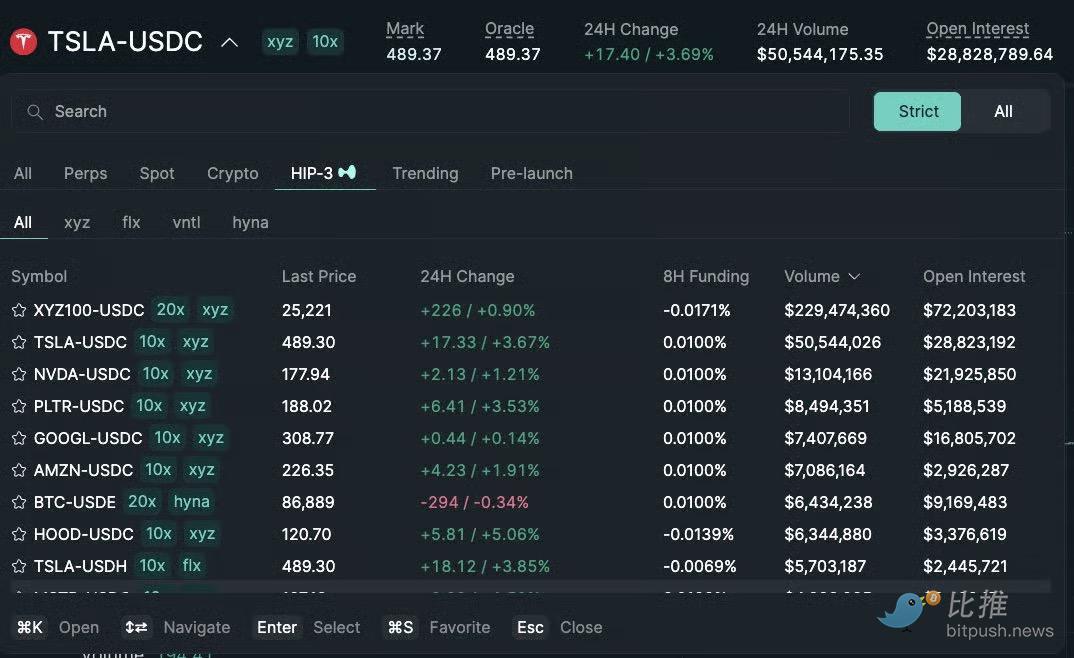
    A previously proposed staking discount would have allowed builders to receive up to a 40% discount by staking HYPE, which would have made third-party frontends structurally cheaper than Hyperliquid's own interface. Withdrawing this proposal removed direct price subsidies for external frontends. Meanwhile, HIP-3 markets, initially positioned for distribution by builders, are now being included in Hyperliquid's native frontend's "strict list." The signal is clear: Hyperliquid remains open at the builder level but is unwilling to compromise on core distribution rights.

  2. USDH: Shifting from Trading Monetization to Float Monetization

    The launch of USDH aims to recapture stablecoin reserve收益 that would otherwise flow externally. Its structure is a 50/50 split of reserve收益: 50% to Hyperliquid, 50% for USDH ecosystem growth. Fee discounts for USDH trading pairs further confirm this: Hyperliquid is willing to compress per-trade收益 for a larger, stickier profit pool from asset balances. Effectively, it adds an annuity-like revenue stream that scales with the monetary base (not just trading volume).

  3. Portfolio Margin: Introducing Prime Broker-like Financing Economics

    Portfolio margin unifies spot and perp margin, allowing risk offsetting, and introduces native borrowing loops. Hyperliquid retains 10% of the interest paid by borrowers. This makes the protocol's economics increasingly dependent on leverage utilization and interest rates, moving closer to a broker/prime broker economic model rather than a pure exchange model.

Conclusion: Moving into 2026

Hyperliquid has reached top-tier venue levels in terms of throughput scale, but its monetization still resembles a market layer: massive trading value paired with single-digit basis point effective take rates. Its gap with Coinbase or Robinhood is structural. Retail platforms occupy the broker layer, own user relationships and asset balances, and profit from multiple profit pools (financing, idle cash, subscriptions). Pure trading venues sell "execution," and execution is inherently commoditized due to liquidity and routing competition. Nasdaq is the epitome of this constraint in TradFi.

Hyperliquid initially leaned towards the "pure trading venue" prototype. By separating distribution and product creation, it accelerated ecosystem growth. The cost is that this architecture can lead to profit spillover.

However, recent moves can be interpreted as a deliberate pivot to defend distribution and enrich the revenue mix beyond trading fees. The protocol has become less willing to subsidize external frontends to be cheaper than the native UI, has started showcasing HIP-3 more natively, and has added balance-sheet-driven profit pools. USDH is a prime example of pulling back reserve收益, and portfolio margin introduces financing economics through a 10% cut of borrowing interest.

Hyperliquid is evolving towards a hybrid model: an execution轨道 as the underlying layer, overlaid with distribution defense and balance-driven profit pools. This reduces the risk of being trapped in the thin-margin wholesale环节, allowing it to move closer to a broker-like revenue组合 without abandoning its core advantages of unified execution and clearing.

Looking ahead to 2026, the core suspense is: Can Hyperliquid successfully pivot towards a broker-like profit model without破坏 its "outsourcing-friendly" model?

USDH (Hyperliquid's native stablecoin) is the clearest litmus test: the current supply of about $100 million indicates that the growth rate of this outsourced issuance is slow when a protocol does not directly control the distribution channels. An obvious alternative could have been setting defaults at the UI level, for example, automatically converting the protocol's ~$4 billion in USDC reserves into the native stablecoin (similar to Binance's当年 auto-conversion of user assets to BUSD).

If Hyperliquid wants to access broker-level profit pools, it might have to act more like a broker: stronger control, tighter native product integration, and drawing clearer boundaries with ecosystem teams that compete at the same distribution and asset balance layer.


Twitter:https://twitter.com/BitpushNewsCN

Bitpush TG Discussion Group:https://t.me/BitPushCommunity

Bitpush TG Subscription: https://t.me/bitpush

Original article link:https://www.bitpush.news/articles/7596866

Câu hỏi Liên quan

QWhat is Hyperliquid's current effective take rate on its massive perp trading volume, and how does it compare to retail platforms like Coinbase and Robinhood?

AHyperliquid's effective take rate is approximately 3.9 basis points (0.039%) on its perp trading volume. This is significantly lower than retail platforms; Coinbase reported a take rate of 35.5 basis points, while Robinhood Crypto's implied take rate was 33.5 basis points.

QAccording to the article, what is the fundamental structural difference in profit pools between the 'distribution layer' (like brokers) and the 'market layer' (like exchanges)?

AThe distribution layer (brokers like Robinhood and Coinbase) owns the customer relationship, which allows for high-margin monetization through multiple avenues beyond trading fees, such as balance sheet activities (cash sweep spreads, margin lending), subscriptions, and routing economics. The market layer (exchanges like Nasdaq) provides execution and infrastructure, but its pricing power is structurally constrained by competition, leading to commoditized, low-margin economics primarily from transaction fees, rebates, and data services.

QWhat two TradFi-like separation designs does Hyperliquid employ that most crypto venues do not?

AHyperliquid employs two key separation designs: 1) A permissioned distribution layer via Builder Codes, which allow third-party frontends to deploy on top of the core exchange and charge their own fees. 2) A permissioned listing/product layer via HIP-3, which externalizes market deployment and allows deployers to share up to 50% of the trading fees from their deployed assets.

QWhat are the three recent strategic shifts Hyperliquid has made to defend its economics and broaden its revenue, as mentioned in the article?

AThe three recent shifts are: 1) Distributive Defense: Withdrawing a proposed staking discount that would have made third-party frontends cheaper than its native UI and more natively featuring HIP-3 markets. 2) USDH: Launching a native stablecoin to recapture reserve yields that would otherwise flow externally, sharing the收益 50/50 between the protocol and ecosystem growth. 3) Portfolio Margin: Introducing a unified margin system that allows for risk netting and includes a native borrowing loop, with the protocol taking a 10% cut of the interest paid by borrowers.

QWhat does the article identify as the core悬念 (suspense) for Hyperliquid heading into 2026 regarding its business model evolution?

AThe core suspense is whether Hyperliquid can successfully shift towards a broker-like profit model with higher margins without破坏 (disrupting) its 'outsourcing-friendly' architecture that relies on third-party frontends and product deployers. The success of its native stablecoin, USDH, is cited as a key test case for this challenge.

Nội dung Liên quan

Gói phần mềm Injective bị tấn công chuỗi cung ứng độc hại – Chi tiết

Gói phần mềm Injective SDK đã trở thành mục tiêu của một cuộc tấn công chuỗi cung ứng độc hại. Kẻ tấn công đã chiếm quyền truy cập tài khoản GitHub của một cộng tác viên hợp pháp của Injective Labs, sau đó tải lên npm một phiên bản độc hại của gói TypeScript SDK, @injectivelabs/sdk-ts v1.20.21. Mã độc được ngụy trang dưới vỏ bọc tính năng đo lường, nhưng thực chất nó chỉ kích hoạt khi các nhà phát triển sử dụng các hàm tạo ví như `fromMnemonic` hoặc `fromHex` để đánh cắp khóa riêng tư và cụm từ hạt giống. Điều này cho phép kẻ tấn công tái tạo và chiếm đoạt ví tiền mã hóa của nạn nhân. Cuộc tấn công còn lan rộng thông qua các phụ thuộc chuyển tiếp trong 17 gói Injective bổ sung phụ thuộc vào SDK này, với khoảng 50.000 lượt tải xuống mỗi tuần. Mặc dù một phiên bản sạch (v1.20.23) đã được phát hành sau đó, phiên bản bị xâm phạm vẫn có sẵn trên npm dưới dạng gói không còn được khuyến nghị. Để bảo vệ bản thân, người dùng được khuyến cáo nên xoay vòng tất cả thông tin xác thực bị ảnh hưởng, tạo ví mới và chuyển tiền của họ. Sự cố này xảy ra cùng thời điểm với vụ việc BonkDAO thất thoát 20 triệu USD do một "đề xuất quản trị độc hại".

ambcrypto1 giờ trước

Gói phần mềm Injective bị tấn công chuỗi cung ứng độc hại – Chi tiết

ambcrypto1 giờ trước

Sau khi Aave rời đi và TVL biến động mạnh, điểm neo định giá của MegaETH nằm ở đâu?

Dựa trên dữ liệu từ DefiLlama, MegaETH đã trải qua biến động mạnh về TVL toàn chuỗi từ ngày 9-10/7, giảm gần 60% trong 24 giờ và giảm khoảng 70% so với đỉnh tháng 5. Giao thức hàng đầu Aave V3 đã rút khoảng 80% thanh khoản. Giá MEGA giảm xuống khoảng $0.048, vốn hóa thị trường chỉ còn khoảng 54 triệu USD với FDV khoảng 4.8 tỷ USD. Bài viết chỉ ra rằng TVL của MegaETH phụ thuộc cao vào một giao thức duy nhất (Aave chiếm tới 90% TVL đỉnh) và các chiến lược vòng lặp ổn định币, chủ yếu dựa vào chênh lệch lợi suất. Khi lợi nhuận từ các chiến lược này biến mất, dòng tiền nhanh chóng rút đi, để lại câu hỏi về giá trị cơ bản thực sự của chuỗi. Có ba sự không phù hợp chính được nêu bật: 1. **Định giá so với mức độ sử dụng thực tế:** FDV ~4.7 tỷ USD tương phản với doanh thu giao thức thực tế hàng năm chỉ khoảng 10 triệu USD và số địa chỉ hoạt động hàng ngày thấp. 2. **Truyện thuyết token so với chất lượng hệ sinh thái:** Phần lớn doanh thu thực tế đến từ một trò chơi thẻ bài (Monster), không phải từ các giao thức DeFi như kỳ vọng. Stablecoin gốc USDm có khối lượng giao dịch thấp. 3. **Kỳ vọng ngắn hạn so với khả năng thực hiện dài hạn:** Các dự án lớn như Uniswap và Aave có TVL sụt giảm nghiêm trọng, cho thấy dòng tiền chủ yếu là đầu cơ chứ không ổn định. Tình trạng tương tự cũng được quan sát thấy ở các chuỗi công khai mới nổi khác như Monad, cho thấy thị trường đang giảm bớt sự định giá cao dựa trên TVL và truyện thuyết, thay vào đó yêu cầu các hoạt động kinh tế thực tế rõ ràng hơn. Kết luận, khi sự thịnh vượng trên sổ sách do dòng tiền khuyến khích và đầu cơ biến mất, MegaETH thiếu một điểm tựa giá trị vững chắc. Mọi sự phục hồi trong tương lai có khả năng đến từ việc sửa chữa tâm lý thị trường ngắn hạn hơn là sự cải thiện cơ bản, trừ khi đội ngũ có thể chuyển đổi thanh khoản thành việc sử dụng thực tế và xây dựng hệ sinh thái bền vững.

链捕手1 giờ trước

Sau khi Aave rời đi và TVL biến động mạnh, điểm neo định giá của MegaETH nằm ở đâu?

链捕手1 giờ trước

Báo cáo chuyên sâu của Goldman Sachs: Ai sẽ là người chiến thắng dài hạn trong ngành công nghiệp mô hình AI lớn của Trung Quốc?

Trung Quốc đang ở bước ngoặt lịch sử trong lĩnh vực mô hình AI lớn, với hiệu suất của các mô hình mã nguồn mở/mở quyền tiếp cận mô hình độc quyền hàng đầu toàn cầu. Báo cáo của Goldman Sachs nhấn mạnh sự đột phá về hiệu quả chi phí và kiến trúc, cho phép các mô hình Trung Quốc (DeepSeek, GLM5.2 của Zhipu, M3 của MiniMax) đạt hiệu năng tương đương với quy mô tham số chỉ bằng 2-10%. Thị trường đang hình thành cấu trúc hai tầng: tầng cao cấp (ví dụ: GLM5.2, Qwen3.7 Max) định giá khoảng 1 USD/triệu token, và tầng giá rẻ phục vụ doanh nghiệp vừa và nhỏ toàn cầu. Doanh thu API/dịch vụ thuê bao dự kiến tăng mạnh từ 350 tỷ NDT (2026) lên 8.790 tỷ NDT (2030). Chiến lược mã nguồn mở giúp mở rộng nhanh nhưng hạn chế khả năng hiện thực hóa doanh thu. Xu hướng có thể chuyển sang mô hình "mở quyền + giấy phép cộng đồng" với chia sẻ doanh thu. Goldman Sachs xác định các công ty có vị thế cạnh tranh mạnh nhất dựa trên khung đánh giá 3 chiều: Khả năng định giá, Lợi thế chi phí và Năng lực tài chính. - **Mô hình văn bản cơ bản:** Zhipu AI và DeepSeek có vị thế mạnh nhất. - **Đa phương thức/Tạo video:** ByteDance (Seed) dẫn đầu, tiếp theo là Kuaishou (Kling) và MiniMax (Hailuo/H3). Báo cáo duy trì xếp hạng Mua cho MiniMax và Kuaishou.

marsbit1 giờ trước

Báo cáo chuyên sâu của Goldman Sachs: Ai sẽ là người chiến thắng dài hạn trong ngành công nghiệp mô hình AI lớn của Trung Quốc?

marsbit1 giờ trước

Báo cáo chuyên sâu của Goldman Sachs: Ai sẽ trở thành người chiến thắng lâu dài trong ngành mô hình AI lớn của Trung Quốc?

Báo cáo chuyên sâu của Goldman Sachs phân tích ngành mô hình AI lớn Trung Quốc tại thời điểm chuyển đổi lịch sử, cho rằng hiệu suất của các mô hình mã nguồn mở/mở quyền Trung Quốc đang tiệm cận các mô hình độc quyền hàng đầu thế giới nhờ đột phá về kiến trúc và hiệu quả tham số, giúp đạt hiệu năng tương đương với chi phí thấp hơn đáng kể. Báo cáo nêu bật cấu trúc thị trường hai tầng: phân khúc cao cấp (GLM5.2, Qwen3.7 Max) định giá ~1 USD/triệu token và phân khúc giá rẻ (~0.06-0.2 USD/triệu token) để mở rộng toàn cầu. Chiến lược mã nguồn mở thúc đẩy việc áp dụng rộng rãi nhưng hạn chế khả năng monetize. Ngành dự kiến chuyển sang mô hình "mở quyền + giấy phép cộng đồng" để chia sẻ doanh thu. Thị trường mục tiêu chính là mở rộng quốc tế, đặc biệt bên ngoài Mỹ, nơi các mô hình Trung Quốc được kỳ vọng tăng thị phần nhờ giá cả cạnh tranh và xu hướng doanh nghiệp chuyển trọng tâm từ tối đa hóa token sang ưu tiên ROI. Sử dụng khung đánh giá dựa trên khả năng định giá, lợi thế chi phí và sức mạnh tài chính, Goldman Sachs xác định Zhipu AI và DeepSeek là những công ty có vị thế mạnh nhất trong lĩnh vực mô hình văn bản cơ bản, trong khi ByteDance (với Seed) dẫn đầu về đa phương thức/tạo video. Báo cáo duy trì xếp hạng Mua cho MiniMax và Kuaishou. Doanh thu API/dịch vụ thuê bao từ các mô hình AI Trung Quốc dự báo tăng mạnh từ ước tính 35 tỷ NDT năm 2026 lên 879 tỷ NDT vào năm 2030.

链捕手1 giờ trước

Báo cáo chuyên sâu của Goldman Sachs: Ai sẽ trở thành người chiến thắng lâu dài trong ngành mô hình AI lớn của Trung Quốc?

链捕手1 giờ trước

Circle nhận được sự chấp thuận cuối cùng của OCC cho ngân hàng ủy thác quốc gia để củng cố cơ sở hạ tầng USDC

Circle đã nhận được sự chấp thuận cuối cùng từ Văn phòng Giám sát Tiền tệ Hoa Kỳ (OCC) để thành lập một ngân hàng ủy thác quốc gia có tên là Circle National Trust. Đây là một cột mốc quan trọng, đưa một phần then chốt trong cơ sở hạ tầng của stablecoin USDC trực tiếp dưới sự giám sát của liên bang. Ngân hàng ủy thác này, ban đầu sẽ cung cấp dịch vụ lưu ký tài sản số được quản lý cho Circle và các công ty liên kết, với lộ trình mở rộng cho một số lượng hạn chế khách hàng thể chế. Giấy phép cũng được thiết kế để hỗ trợ việc quản lý Dự trữ USDC trong tương lai dưới sự giám sát của OCC, nhằm tăng cường tính minh bạch và niềm tin. Circle là một trong những công ty tiên phong trong làn sóng mới nhất của OCC về việc tích hợp các doanh nghiệp tiền mã hóa vào khuôn khổ ngân hàng hiện hành. Sự chấp thuận này phản ánh xu hướng rộng hơn khi các nhà cung cấp hạ tầng crypto tìm kiếm giấy phép ngân hàng ủy thác để mở rộng dịch vụ lưu ký có quy định và củng cố sự tham gia của các tổ chức vào tài sản số.

ambcrypto1 giờ trước

Circle nhận được sự chấp thuận cuối cùng của OCC cho ngân hàng ủy thác quốc gia để củng cố cơ sở hạ tầng USDC

ambcrypto1 giờ trước

Giao dịch

Giao ngay
活动图片