Source: BlockRearch
Original Title: Hyperliquid crossroads: Robinhood or Nasdaq economics
Compiled and Edited by: BitpushNews
Hyperliquid is currently in the phase of clearing Nasdaq-level perpetual contract (Perp) trading volume, but earning only thin profits. Over the past 30 days, it cleared $205.6 billion in notional value of perpetual contracts (annualized quarterly rate of $617 billion), yet generated only $80.3 million in fees, with a monetization rate of just about 3.9 basis points.
Its monetization model resembles more of a wholesale execution venue.
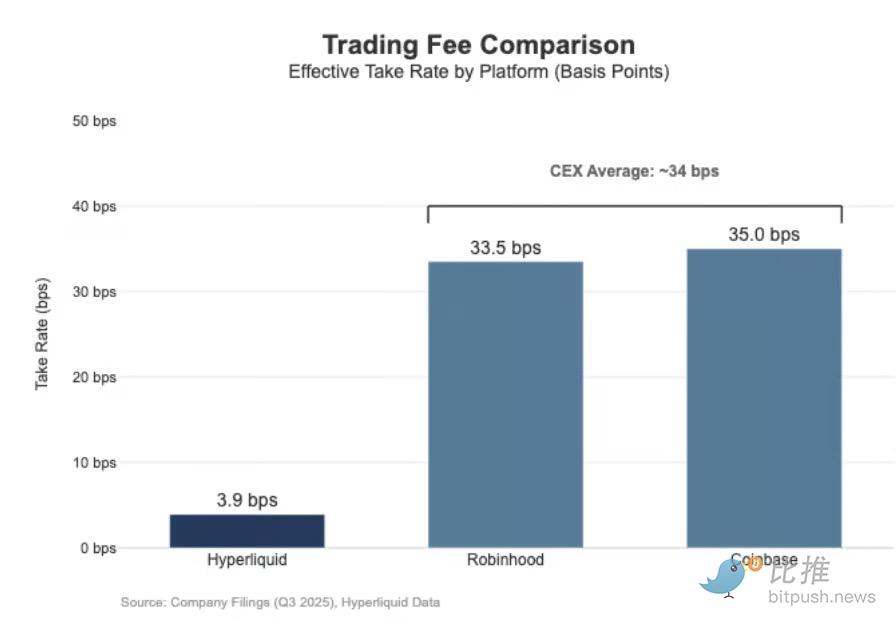
In comparison, Coinbase reported its Q3 2025 trading volume as $295 billion, with trading revenue of $1.046 billion, implying a Take Rate of 35.5 basis points.
Robinhood exhibits similar retail monetization characteristics in the cryptocurrency space: its $80 billion in cryptocurrency notional trading volume brought in $268 million in trading revenue, implying a monetization rate of 33.5 basis points; meanwhile, its stock trading notional value for Q3 2025 was $647 billion.
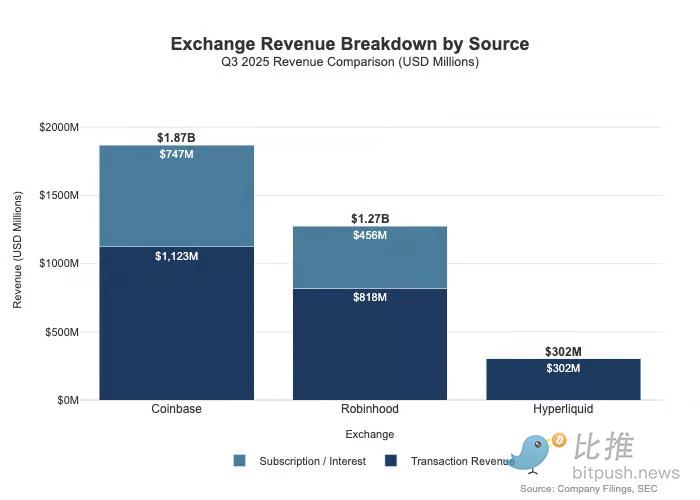
The gap is even larger than what the fee rates suggest, as retail platforms possess multi-dimensional monetization paths. In Q3 2025, Robinhood generated $730 million in transaction-based revenue, plus $456 million in net interest income and $88 million in other revenue (primarily driven by Gold subscription services).
In contrast, Hyperliquid currently relies heavily on trading fees, and these fees are structurally constrained at the protocol level to single-digit basis points.
The Difference in Positioning: Distributor vs. Market Layer
This difference is best explained by positioning: Coinbase and Robinhood belong to the broker/distribution business, monetizing through balance sheets and subscription services; whereas Hyperliquid is closer to the exchange layer (market layer). In traditional market structure, the profit pool is divided between these two layers.
The core divide in traditional finance (TradFi) is "Distribution" vs. "Market":
-
Distribution Layer (e.g., Robinhood and Coinbase): They own the customer relationship and occupy the high-margin环节.
-
Market Layer (e.g., Nasdaq): They exist as exchanges, with pricing power structurally constrained, and execution businesses tend towards "commoditized" economics due to competition.
1. Broker-Dealer = Distribution + Customer Balance Sheet
Brokers own the customer relationship. Most users do not access Nasdaq directly but enter the market through brokers. Brokers handle deposits, custody, margin/risk management, customer service, and tax documents, then route orders to various trading venues. This ownership of the relationship creates monetization capabilities beyond trading:
-
Balances: Cash sweep spreads, margin lending, securities lending.
-
Packaging: Subscription services, bundles, co-branded cards/advisory services.
-
Routing Economics: Brokers control the flow and can embed payments or revenue-sharing mechanisms in the routing chain.
This is why brokers' profitability often surpasses that of trading venues: the profit pool is concentrated where distribution and balances reside.
2. Exchange = Matching + Rulebook + Infrastructure (Constrained Take Rate)
Exchanges operate the venue: matching, setting market rules, deterministic execution, and connectivity. Their monetization methods include:
-
Trading Fees: Compressed by competition in high-liquidity products.
-
Rebates/Liquidity Programs: Often forced to return most nominal fees to makers to attract liquidity.
-
Market Data, Connectivity/Co-location Services.
-
Listing Fees and Index Licensing.
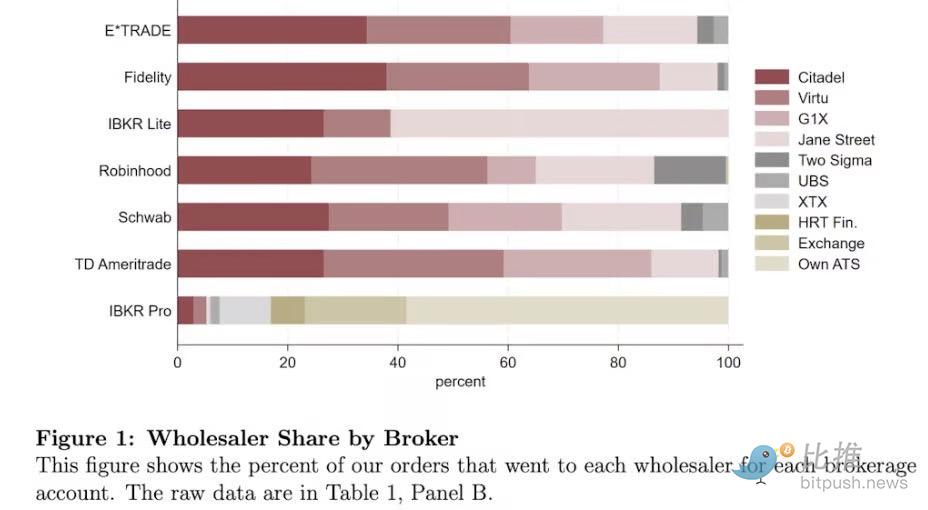
Robinhood's routing logic clearly demonstrates this architecture: the broker (Robinhood Securities) owns the users and routes orders to third-party market centers, with routing revenue shared throughout the chain. Distribution is the high-margin layer: it controls customer acquisition and the monetization domains around execution (payment for order flow, margin, securities lending, subscriptions).
Nasdaq is the thin-margin layer. Its product is commoditized execution capability and queue access, and its pricing power is mechanically suppressed because venues need to pay maker rebates to win liquidity, regulation caps access fees, and routing is extremely flexible. In Nasdaq's disclosures, this is reflected in net cash equity capture per share of just fractions of a cent.
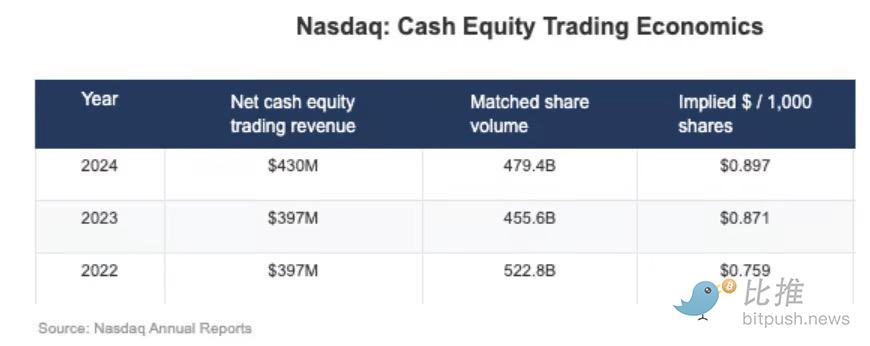
The strategic consequence of these low margins is evident in Nasdaq's revenue mix. In 2024, its Market Services revenue was $1.02 billion, accounting for only 22% of total revenue of $4.649 billion; this proportion was 39.4% in 2014 and 35% in 2019. This aligns with its strategy of shifting from market-sensitive execution business to more sustainable software/data businesses.

Hyperliquid's "Nasdaq Path"
Hyperliquid's effective take rate of about 4 basis points aligns with its deep focus on the "market layer." It is building an on-chain Nasdaq simulator: an architecture with high throughput, margin management, and a clearing stack (HyperCore), employing maker/taker pricing and maker rebates, aimed at optimizing execution quality and shared liquidity, rather than单纯的 retail monetization.
This is reflected in two design separations, similar to TradFi, that most crypto venues lack:
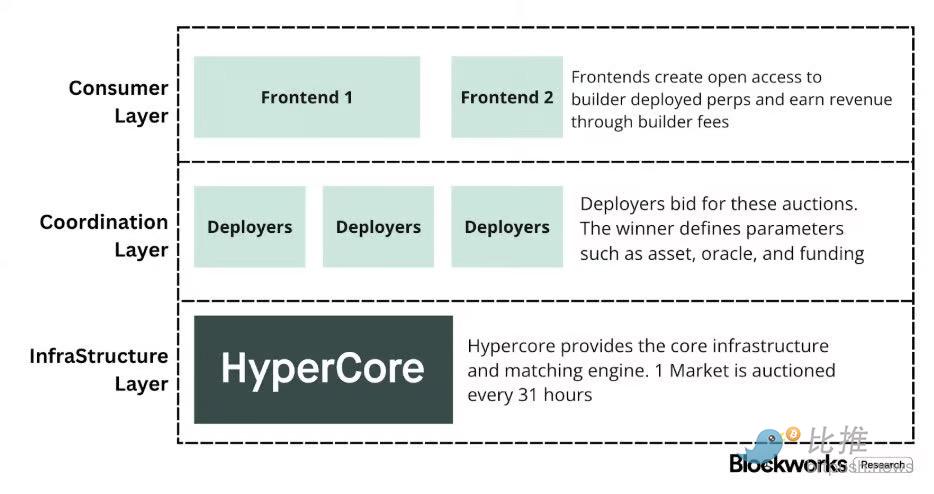
A) Permissioned Distribution/Layer (Builder Codes)
"Builder Codes" allow third-party interfaces to be deployed on top of the core trading venue and charge their own economic fees. Builder fees are capped at 0.1% (10 bps) for perps and 1% for spot, and can be set per order. This creates a competitive market for distribution, rather than a single-app monopoly.
B) Permissioned Listing/Product Layer (HIP-3)
In TradFi, exchanges control listings and product creation. The HIP-3 protocol externalizes this function: builders can deploy perpetual contracts that inherit the HyperCore stack and API, with the deployer responsible for defining and operating the market. Economically, HIP-3 formalizes revenue sharing between the venue and the product: spot and HIP-3 perp deployers can retain up to 50% of the trading fees from the deployed assets.
Builder Codes have already won on distribution; by mid-December, about one-third of users were trading through third-party frontends rather than the native UI.
Structural Pressure and Defense
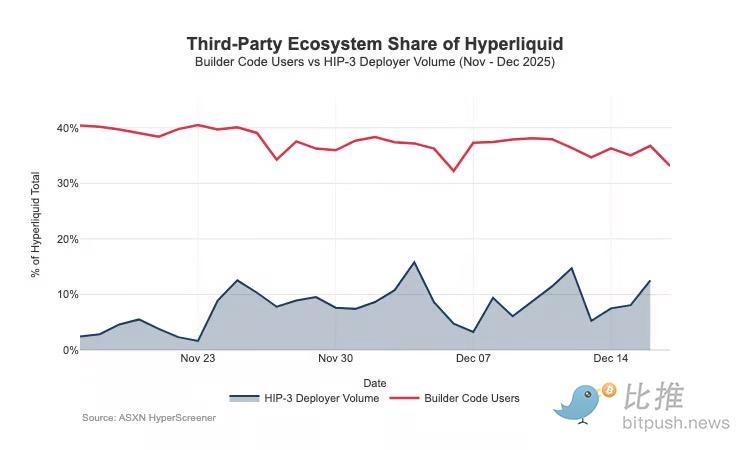
The problem is: this structure that fosters distribution growth will also predictably depress the venue's earnings:
-
Price Compression: Multiple frontends selling the same backend liquidity will push competition towards the lowest total cost; Builder fees can be adjusted per order, pushing pricing towards the bottom line.
-
Monetization Domain Drain: Frontends own deposits, bundling, subscriptions, and workflows; they capture the broker-layer profits, while Hyperliquid can only retain the thin venue earnings.
-
Strategic Routing Risk: If frontends become true cross-platform routers, Hyperliquid will be forced into a race for wholesale execution, retaining流量 only by cutting fees or increasing rebates.
Hyperliquid deliberately chose the thin-margin market layer (via HIP-3 and Builder Codes), while allowing a thick-margin broker layer to emerge on top of it. If third-party frontends continue to expand, they will increasingly dictate user-facing economics, control retention domains, and gain routing leverage, thereby structurally depressing Hyperliquid's take rate in the long term.
Commoditization is clearly the biggest risk. If third-party frontends can consistently underprice the native UI and eventually achieve cross-platform routing, Hyperliquid could be reduced to an extremely thin-margin wholesale clearing channel.
Strategic Pivot: Defending Distribution & Broadening Revenue
Recent design choices indicate that Hyperliquid is attempting to prevent the above outcome while broadening its revenue sources.
-
Distribution Defense: Maintaining Native UI Economic Competitiveness
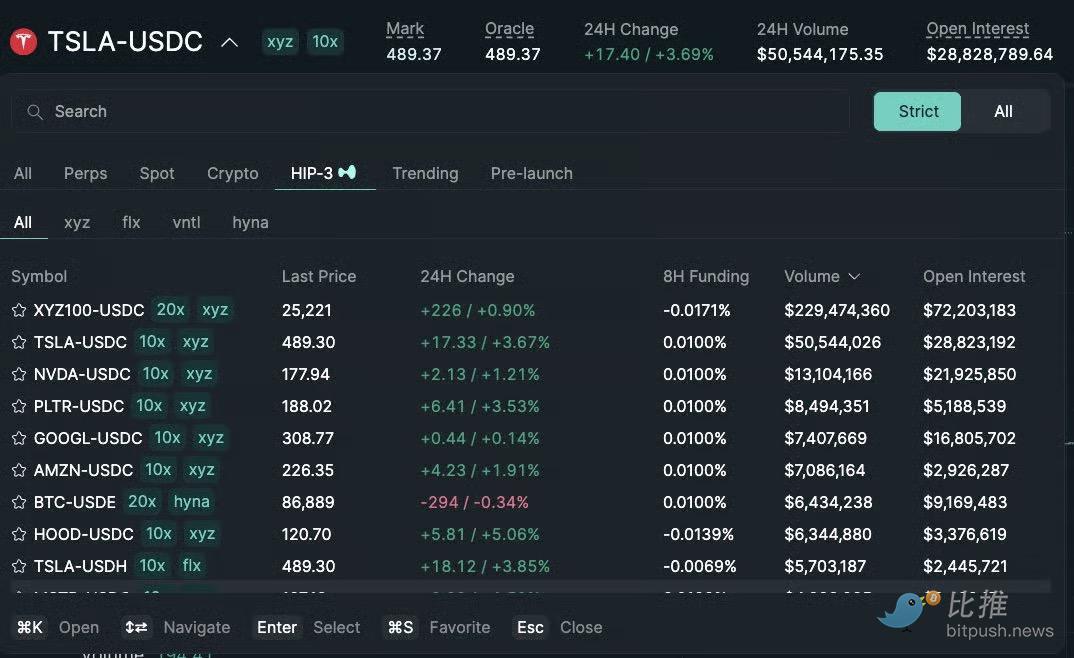
A previously proposed staking discount would have allowed builders to receive up to a 40% discount by staking HYPE, which would have made third-party frontends structurally cheaper than Hyperliquid's own interface. Withdrawing this proposal removed direct price subsidies for external frontends. Meanwhile, HIP-3 markets, initially positioned for distribution by builders, are now being included in Hyperliquid's native frontend's "strict list." The signal is clear: Hyperliquid remains open at the builder level but is unwilling to compromise on core distribution rights.
-
USDH: Shifting from Trading Monetization to Float Monetization
The launch of USDH aims to recapture stablecoin reserve收益 that would otherwise flow externally. Its structure is a 50/50 split of reserve收益: 50% to Hyperliquid, 50% for USDH ecosystem growth. Fee discounts for USDH trading pairs further confirm this: Hyperliquid is willing to compress per-trade收益 for a larger, stickier profit pool from asset balances. Effectively, it adds an annuity-like revenue stream that scales with the monetary base (not just trading volume).
-
Portfolio Margin: Introducing Prime Broker-like Financing Economics
Portfolio margin unifies spot and perp margin, allowing risk offsetting, and introduces native borrowing loops. Hyperliquid retains 10% of the interest paid by borrowers. This makes the protocol's economics increasingly dependent on leverage utilization and interest rates, moving closer to a broker/prime broker economic model rather than a pure exchange model.
Conclusion: Moving into 2026
Hyperliquid has reached top-tier venue levels in terms of throughput scale, but its monetization still resembles a market layer: massive trading value paired with single-digit basis point effective take rates. Its gap with Coinbase or Robinhood is structural. Retail platforms occupy the broker layer, own user relationships and asset balances, and profit from multiple profit pools (financing, idle cash, subscriptions). Pure trading venues sell "execution," and execution is inherently commoditized due to liquidity and routing competition. Nasdaq is the epitome of this constraint in TradFi.
Hyperliquid initially leaned towards the "pure trading venue" prototype. By separating distribution and product creation, it accelerated ecosystem growth. The cost is that this architecture can lead to profit spillover.
However, recent moves can be interpreted as a deliberate pivot to defend distribution and enrich the revenue mix beyond trading fees. The protocol has become less willing to subsidize external frontends to be cheaper than the native UI, has started showcasing HIP-3 more natively, and has added balance-sheet-driven profit pools. USDH is a prime example of pulling back reserve收益, and portfolio margin introduces financing economics through a 10% cut of borrowing interest.
Hyperliquid is evolving towards a hybrid model: an execution轨道 as the underlying layer, overlaid with distribution defense and balance-driven profit pools. This reduces the risk of being trapped in the thin-margin wholesale环节, allowing it to move closer to a broker-like revenue组合 without abandoning its core advantages of unified execution and clearing.
Looking ahead to 2026, the core suspense is: Can Hyperliquid successfully pivot towards a broker-like profit model without破坏 its "outsourcing-friendly" model?
USDH (Hyperliquid's native stablecoin) is the clearest litmus test: the current supply of about $100 million indicates that the growth rate of this outsourced issuance is slow when a protocol does not directly control the distribution channels. An obvious alternative could have been setting defaults at the UI level, for example, automatically converting the protocol's ~$4 billion in USDC reserves into the native stablecoin (similar to Binance's当年 auto-conversion of user assets to BUSD).
If Hyperliquid wants to access broker-level profit pools, it might have to act more like a broker: stronger control, tighter native product integration, and drawing clearer boundaries with ecosystem teams that compete at the same distribution and asset balance layer.
Twitter:https://twitter.com/BitpushNewsCN
Bitpush TG Discussion Group:https://t.me/BitPushCommunity
Bitpush TG Subscription: https://t.me/bitpush