Having experienced this week, it feels like being on a roller coaster.
This week saw a concentrated release of macro pressures - bond market crash, rising rate hike expectations, oil prices breaking $110, BTC falling below $78K, currently hovering in a critical range.
Structurally, I have focused on analyzing two path projections since the February low: Has a new uptrend already started, or is this a B-wave rally within a monthly-level major correction? This judgment is currently inconclusive, but the outcome of the multi/empty battle in the $78,500-$79,500 region is the most important observation window this week.
In terms of trading, for medium-term positions, continue to hold no position and observe. For short-term trading, A/B contingency plans have been prepared around support and resistance levels, with positions controlled within 30%, strictly adhering to stop-loss.
Summary of Core Trading Views for This Week:
• BTC Multi-cycle Price Structure Analysis (Comparison of two subsequent path projections) (Details in Part 1)
• BTC Market Forecast and Medium/Short-term Trading Strategies for This Week (Details in Part 2)
• HYPE Daily Chart Price Structure Analysis (Details in Part 3)
• HYPE Market Forecast and Short-term Trading Strategy for This Week (Details in Part 4)
Market Verification of Last Week's Trading Strategy and Core Views:
• BTC Short-term Trade Performance: Bitcoin completed one short-term long position trade last week (1x leverage), successfully achieving a profit of approximately 2.02%. (Details in Table 1)
• Market Verification of BTC Price Trend Forecast: In last week's article, we pointed out: The probability is high that the market will experience high-level wide-range fluctuations around the $79,500~$80,600 region. The current market movement verifies our previous forecast.
I. First, Let's Look at BTC's Projections
1. Analysis of BTC's Price Structure Since the February Low: Two Key Path Projections and Multi/Empty Battle
In previous weekly review articles, when analyzing Bitcoin's daily chart correction structure since the October 2025 high ($126,200), we proposed three main Elliott Wave structure projections. Currently, due to the D-wave rally cycle in Projection Two (complex five-wave correction structure) significantly exceeding the previous B-wave in terms of duration, excessively extending in the time dimension and disrupting the equilibrium of the wave structure, its probability of occurrence has greatly decreased. Therefore, the core market divergence and future directional choice will focus on the two other projections. This section will provide an in-depth analysis and probability comparison of these two projection paths.
1. Path One: Correction Ended, New Uptrend Has Begun (Bullish Mindset)
Bitcoin _ Daily Chart:
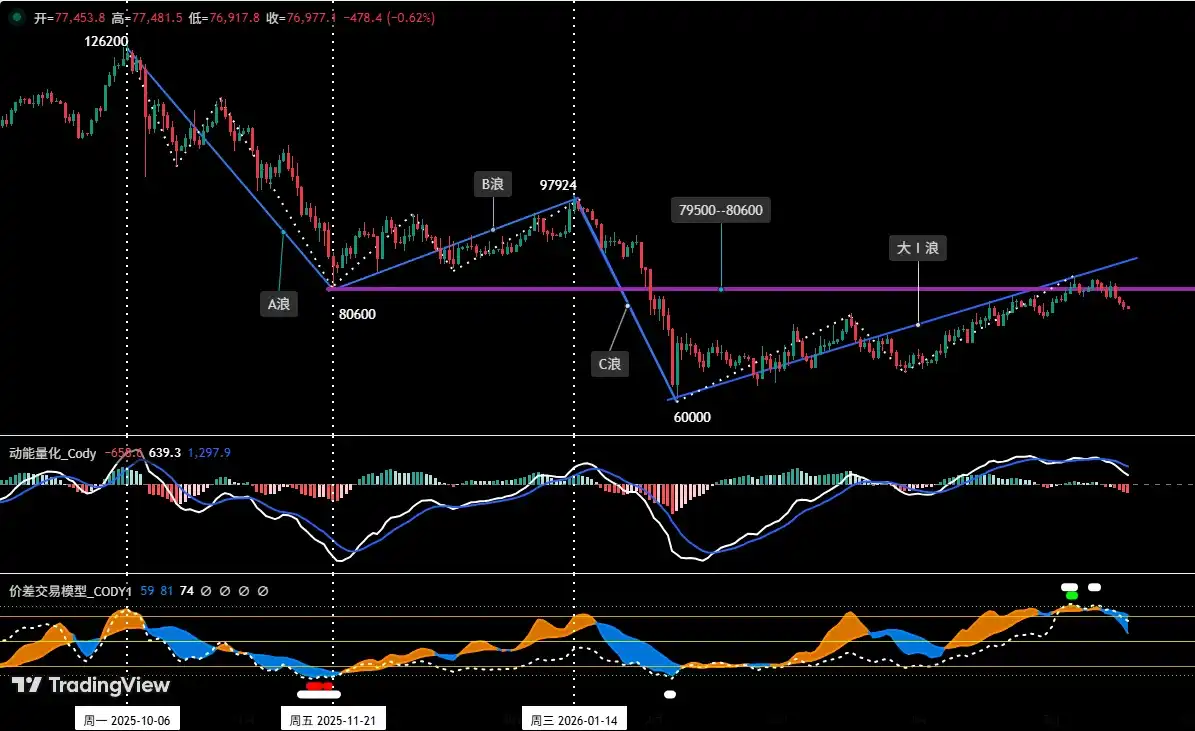
Figure 1
As shown in (Figure 1), this view holds that: The daily-level correction starting from the previous high of $126,200 has completed an A-B-C three-wave structure, where the C-wave ended at $60,000 (low on Feb 6th), and the market has shifted from a downtrend to an uptrend. It is currently running the major Wave I (i.e., the initial rally wave). (This content has been detailed in previous articles and will not be elaborated here)
• Major Wave I (Initial Rally Wave): From $60,000 (2026-02-06) to present, running for about 100 days, with a maximum gain of about 38.1%, and still ongoing.
• Potential Major Wave II (Corrective Wave): The correction wave about to run after the end of Major Wave I's rally, its low point will not break below $60,000.
2. Path Two: Monthly-level Correction Structure, Currently in a B-wave Rally (Bearish Mindset)
Bitcoin _ Monthly Chart:
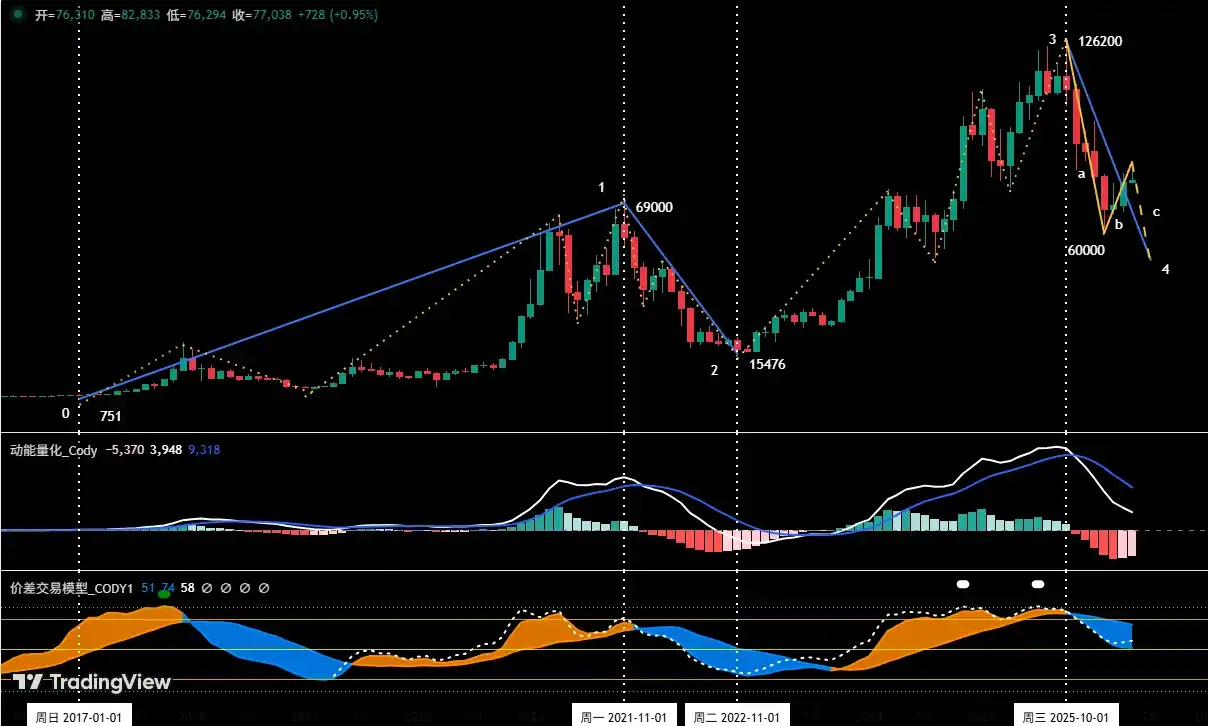
Figure 2
As shown in (Figure 2), this view holds that: The correction starting from the previous high of $126,200 may present a monthly-level a-b-c three-wave correction structure, and it is currently running the b-wave rally.
• a-wave (Decline Wave): From $126,200 (2025-10-06) to $60,000 (2026-02-06), lasting about 4 months (approx. 122 days), with a maximum decline of about 52.5%.
• b-wave (Rally Wave): From $60,000 (2026-02-06) to present, lasting over 3 months (approx. 100 days), with a maximum gain of about 38.1%, and still ongoing.
• Potential c-wave (Decline Wave): The correction wave about to run after the end of the b-wave rally, its low point may break below the $60,000 mark.
3. Assessing the Possibility of "Path Two" from a Monthly Chart Perspective
The Bitcoin monthly chart shows: From January 1, 2017, to present (only this segment of complete trading data is extracted), it can be subdivided into a 4-segment structure;
• Segment 0-1 (Rally Cycle): From $751 (2017-01-01) to $69,000 (2021-11-10), lasting about 59 months (approx. 1774 days).
• Segment 1-2 (Correction Cycle): From $69,000 (2021-11-10) to $15,476 (2022-11-21), lasting about 13 months (approx. 376 days). A deep correction against the previous rally phase (i.e., Segment 0-1), with a maximum decline of about 77.57%.
• Segment 2-3 (Rally Cycle): From $15,476 (2022-11-21) to $126,200 (2025-10-06), lasting about 35 months (1050 days). The main uptrend wave that reached new historical highs, with a maximum gain of about 715.46%.
• Segment 3-4 (Correction Cycle): From $126,200 (2025-10-06) to present, running for about 7 months (approx. 223 days), with a maximum decline of 52.46%, and still ongoing. A correction against the previous main uptrend (i.e., Segment 2-3).
• From a monthly chart perspective, the current market is in the Segment 3-4 correction cycle. If it follows principles of cycle alternation and time symmetry, and there is some proportional relationship in amplitude and duration with "Segment 1-2 (correction)" and "Segment 2-3 (rally)", then the probability of the correction structure described in "Path Two" occurring will increase significantly. This means the current rally since the February 6th low is only part of a large-scale correction.
4. Based on the above analysis of the two path projections, both possess realistic possibilities in the current macro and technical environment. To study their relative probability, the core lies in examining the nature of the rally initiated from the February 6th low; its running duration and spatial amplitude have become key criteria for judgment.
5. Our core view is as follows:
• If this rally becomes exhausted and ends in the near term, the probability of the market choosing "Path Two" will significantly rise.
• Conversely, if the rally continues to extend in time and space, the likelihood of the market choosing "Path One" will increase accordingly.
To this end, we propose an observable quantitative threshold: If this rally can break through the $90,000 to $93,100 region, it may become a crucial factor in confirming whether a fundamental shift in market structure has occurred.
Simultaneously, we believe that, regardless of which path the market chooses, by analyzing historical cycle patterns and macro liquidity expectations, a relatively reliable bottoming structure is more likely to gradually form and be confirmed in the fourth quarter of this year.
2. In-depth Analysis of BTC's Hourly Chart Price Structure: (Using the 4-hour chart as the analysis timeframe)
Bitcoin _ 4-hour Chart
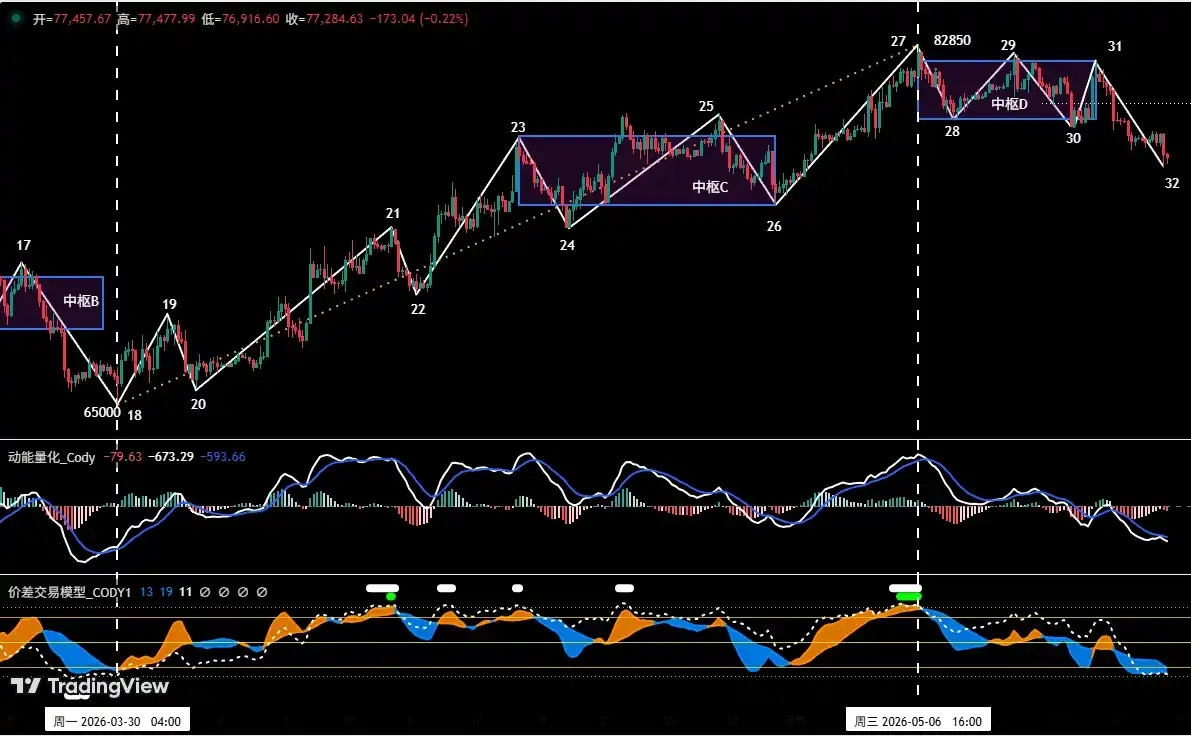
Figure 3
As shown in (Figure 3), since the departure segment from "Central C" (26-27) to present;
• On the 4-hour chart, it can be subdivided into: 26-27, 27-28, 28-29, 29-30, 30-31, 31-32, totaling 6 segments. Among them, because segments 27-28, 28-29, 29-30, and 30-31 overlap, they constitute Central D.
• Currently, the departure segment (31-32) is moving downward and has already broken below the support of the lower boundary of "Central D" ($79,200) and the upper boundary of "Central C" ($78,500). If the price subsequently confirms an effective break below the $78,500~$79,200 region, the daily-level correction structure may initiate.
II. Next, How to Operate
1. BTC Market Trend Forecast for This Week:
Core view for this week: The key lies in observing the outcome of the multi/empty battle over the $78,500~$79,500 region. The gain or loss of this region can serve as an important basis for judging whether the price can maintain high-level fluctuations or turn downward for a correction.
2. Key Resistance Levels:
• First Resistance Zone: $78,500~$79,500 region (around the upper/lower boundaries of the two centers)
• Second Resistance Zone: $83,500~$84,500 region (previous multi/empty concentrated trading area)
3. Key Support Levels:
• First Support Level: $73,500~$75,000 region (previous significant support)
• Second Support Level: $69,500~$70,500 region (previous significant support)
4. Trading Strategy for This Week (excluding impact of sudden news)
1. Medium-term Strategy:
Bitcoin _ Daily Chart: (Position Monitoring Model)
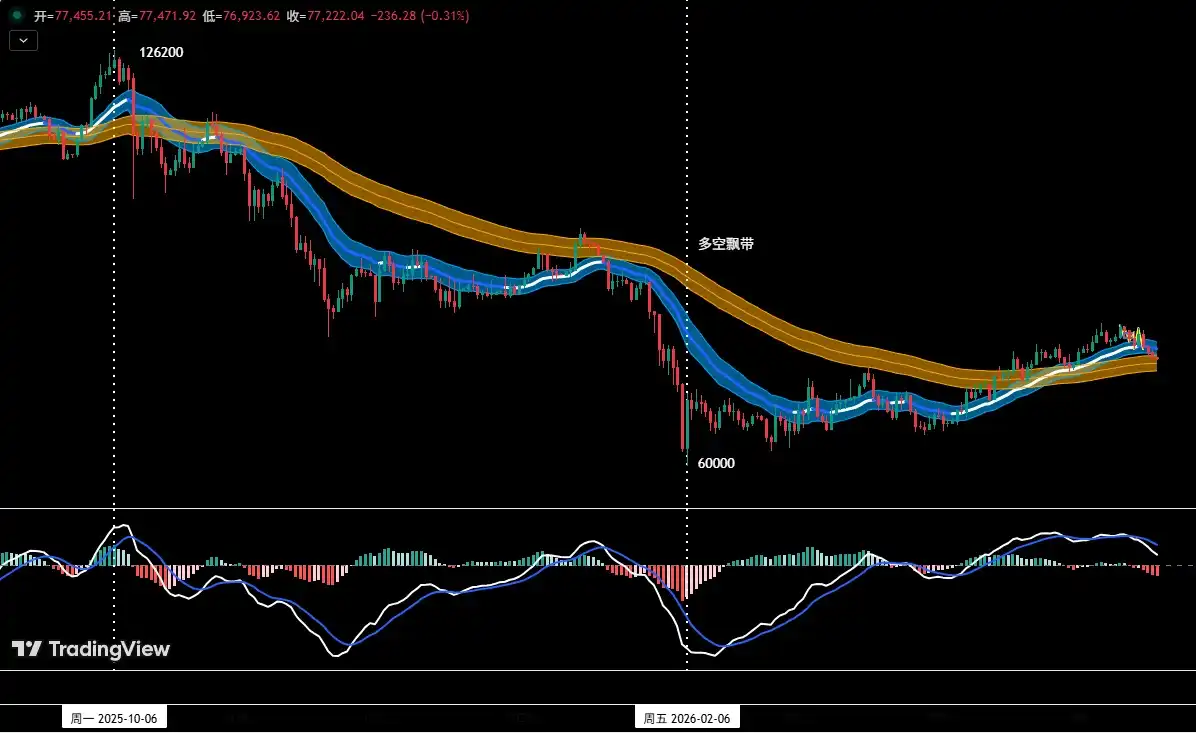
Figure 4
Position Monitoring Model: As shown in (Figure 4), based on trading rules, the medium-term market direction is not yet clear. This week, maintain a no-position observation strategy for medium-term.
2. Short-term Strategy: Use 30% position, set stop-loss points, and look for "price difference" opportunities based on support and resistance levels. (Using 30-minute/60-minute charts as the operation timeframe).
3. In short-term operations, to dynamically cope with the complex evolution of the market, we have pre-formulated A/B two sets of specific operational contingency plans.
• Plan A: Rally meets resistance, go short on highs.
• Entry: When the price rallies to the $78,500~$79,500 region and meets resistance, combined with the quantitative model's topping signal, a short position below 30% can be established.
• Risk Control: Initial stop-loss set above $80,600.
• Exit: When adjusting near important resistance levels and combined with model signals, gradually close positions to take profits.
• Plan B: Effectively breaks support, follow the trend to go short.
• Entry: When the price effectively breaks below the $73,500~$75,000 support region and combines with the model's topping signal, a short position below 30% can be established.
• Risk Control: Initial stop-loss set above $76,500.
• Exit: When falling to important support levels and combined with model signals, gradually close positions to take profits.
III. After Discussing BTC, Let's Look at HYPE
BTC is still in a tug-of-war within the $78K-$82K range, with neither bulls nor bears gaining much advantage. HYPE, on the other hand, has been hitting new highs independently, rising over 10% this week.
HYPE_ Daily Chart
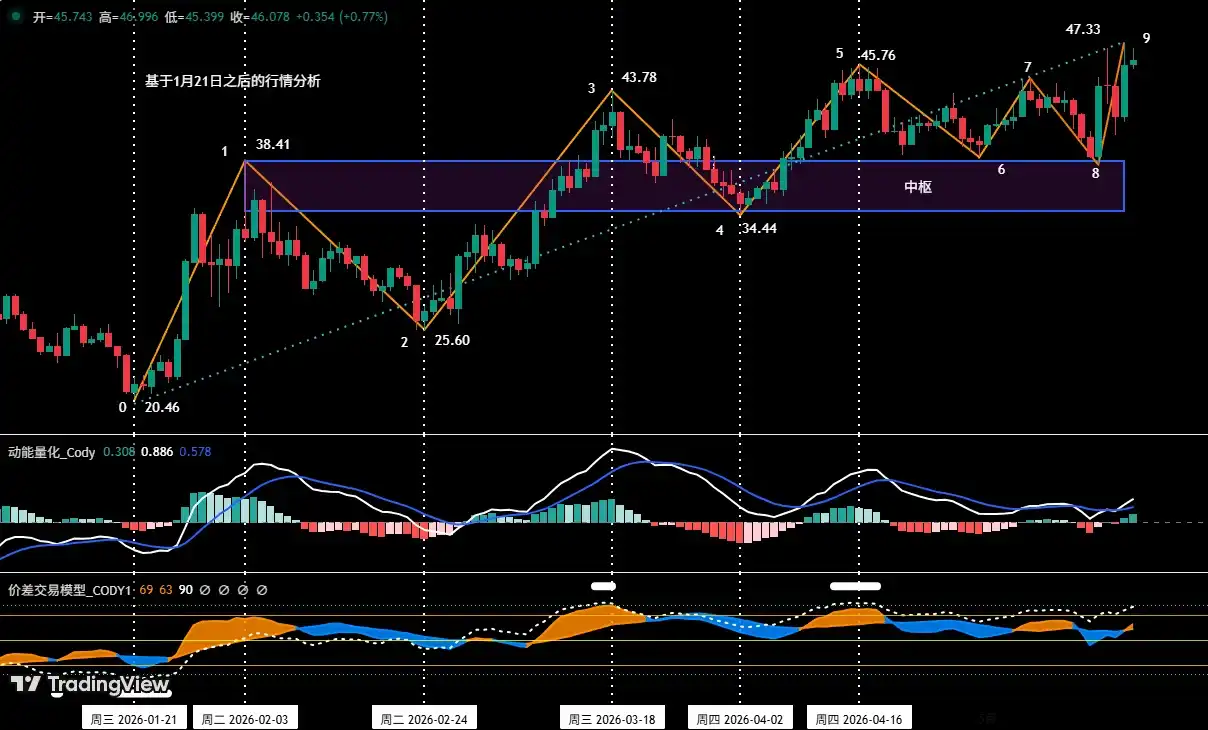
Figure 5
1. As shown in (Figure 5), the rally in HYPE starting from the low of $20.46 on January 21st, on the daily chart, can be divided into segments 0-1, 1-2, 2-3, 3-4, 4-5, 5-6, 6-7, 7-8, 8-9, totaling nine segments. Since the recent price reached a new high of $47.30 (endpoint 9) since the rally from $20.46, the current price structure remains in a daily-level uptrend.
2. As shown in (Figure 5), because segments 1-2, 2-3, and 3-4 overlap, they collectively construct a daily-level "rally central pivot" (or "upward central zone").
3. If the HYPE price can continue to operate above the key point of $38.41 (the upper boundary of the central pivot), the market is expected to maintain a high-level consolidation pattern on the daily chart, to digest previous gains and accumulate directional momentum.
IV. HYPE Trend Judgment and Subsequent Operation Prediction
1. HYPE Market Trend Forecast for This Week:
Core HYPE view for this week: Focus on observing the gain or loss in the multi/empty battle around the central pivot upper boundary ($38.41) and the previous high ($45.76).
2. HYPE Short-term Trading Strategy for This Week:
Combined with the current market structure, the following three sets of short-term operational contingency plans have been optimized and formulated for you, with the core revolving around the battle over the "central pivot upper boundary ($38.41) and the previous high ($45.76)".
• Plan A: Breakout Go Long (Trend Continuation)
If the price effectively breaks through and stabilizes above the $45.76 support, simultaneously combined with bottom signals triggered by the two major models, consider lightly testing a long position. Position must be controlled below 30% and strictly adhere to stop-loss discipline.
• Plan B: Breakdown Turn Short (Trend Reversal)
If the price effectively breaks below the $45.76 support, simultaneously combined with top signals triggered by the two major models, consider lightly testing a short position. Position must be controlled below 30% and strictly adhere to stop-loss discipline.
• Plan C: Support Go Long (Trend Reversal Back Up)
If the price retraces to near $38.41, finds support, shows signs of stabilization, and simultaneously combines with bottom signals triggered by the two major models, consider lightly testing a long position. Position must be controlled below 30% and strictly adhere to stop-loss discipline.
V. Finally, Let's Talk About Results
1. Short-term Operation Review: (See Table 1)
We strictly followed the operational contingency plan. Based on trading signals from our self-constructed Price Difference Trading Model and Momentum Quantitative Model, we completed one short-term (long position) operation last week, achieving a trading profit of 2.02%.
1. Bitcoin Short-term Trade Details Summary: (Leverage*1)
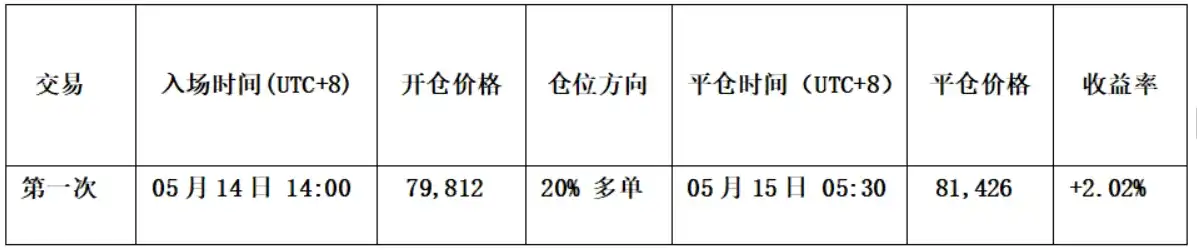
Table 1
2. Short-term Trade Recap: (See Figure 6)
• Entry Strategy:
a. When the price fell near $78,500 and showed signs of stabilization and then broke through the previous consolidation range upper resistance at $79,500;
b. The Price Difference Trading Model triggered a bottom warning signal (white dot + red dot), forming a bottom resonance with the Momentum Quantitative Model.
Therefore, we established a 20% long position at $79,812.
• Exit Strategy:
a. When the price rallied near $82,000 and met resistance, with the K-line forming a top resistance signal;
b. The Price Difference Trading Model triggered a strong top warning signal (green dot + white dot), forming a top selling signal with the Momentum Quantitative Model.
Therefore, we closed all positions near $81,426.
• Summary: This trade successfully profited approximately 2.02%.
HYPE_30-minute Chart: (Momentum Quantitative Model + Price Difference Trading Model)
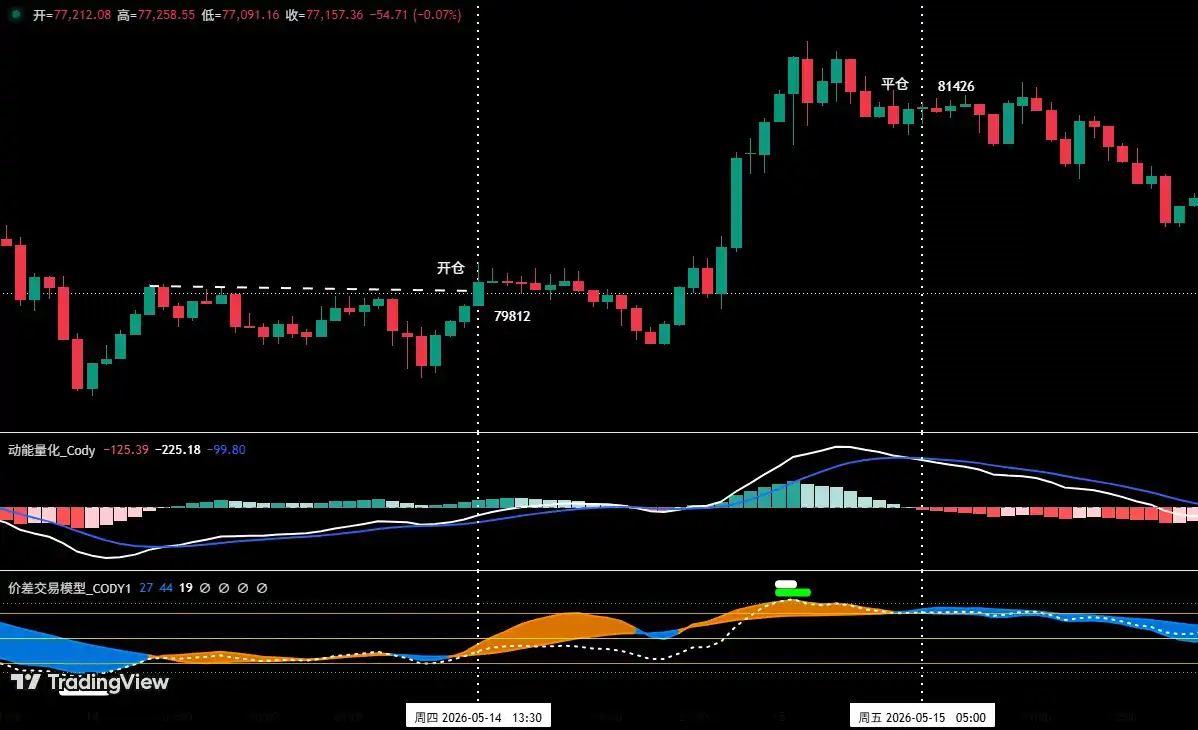
Figure 6 (Short-term Trade Illustration)
VI. Special Notes:
1. When opening a position: Immediately set the initial stop-loss level.
2. When profit reaches 1%: Move the stop-loss to the entry price (breakeven point) to ensure principal safety.
3. When profit reaches 2%: Move the stop-loss to the 1% profit level.
4. Continuous tracking: Thereafter, for every additional 1% profit in price, move the stop-loss level up by 1% accordingly, dynamically protecting and locking in profits.
Financial markets change rapidly. All market analysis and trading strategies require dynamic adjustment. All views, analytical models, and operational strategies involved in this article are derived from personal technical analysis and are for personal trading log purposes only. They do not constitute any investment advice or operational basis. Markets involve risks, investment requires caution. Please do not make decisions based on this.