A Tale of Two Halves – The Great Reset
2022 was The Great Reset for crypto. Overly hyped trends and mass speculation pushed the crypto market far out over its skis by the end of 2021, so this year’s wash out was a necessary reset. Sizable corrections are healthy for long-term secular up trends.The last three years have been a tale of two halves.The plot of act I was the culmination of policy responses to the post-COVID flash recession — massive stimulus programs were the stars of the show.
“The giant backstops put in place by such policies turned markets around almost on a dime, and were a key catalyst in propelling asset prices to new all-time highs. Financial conditions eased, risk appetite returned, and BTC and crypto assets were huge beneficiaries of this environment, which saw global liquidity expand atone of the fastest rates on record.”
– Why Bitcoin is Behaving Like It Should (January 2022)
Act II was the fall of the market’s shining white knight as our story’s hero turned into its biggest villain. All the tailwinds that propelled asset prices to new highs reversed course, and 2022 was the polar opposite of the previous 12 months —something we warned of a year ago:
“Several macro tailwinds that helped propel BTC and crypto assets to new high sover the last 12-18 months have reversed course; the shift away from excess liquidity and accommodative monetary conditions is a structural headwind we’veh ighlighted in recent months, which now appears to be coming to a head.”
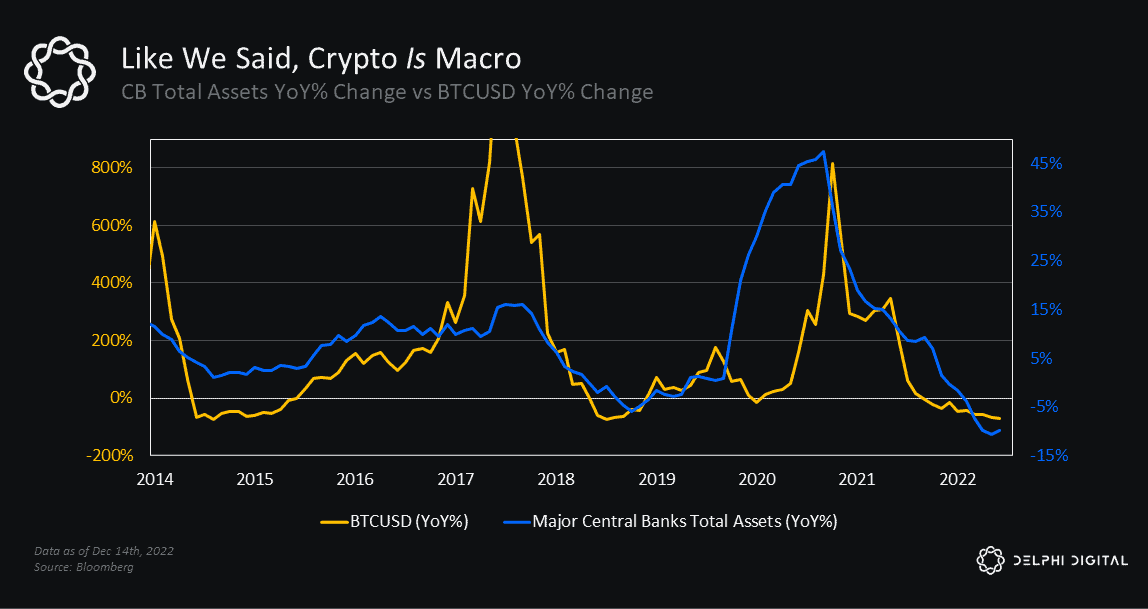
3This leads us to an important theme we’ve been harping on since our earliest days — crypto is macro.
What’s happening in macro has a direct impact on the crypto market, as we’ve seen not just over the last two years, but arguably the better part of the last few price cycles. We’ll get into that shortly, but first let’s get a quick sense of the current state of the crypto market.
State of the Crypto Market
The sharp drawdown in crypto asset prices this year has many wondering whenthe pain will subside. General interest in many of the most prominent cryptothemes of the last few years has died down considerably over the last 6-9months.
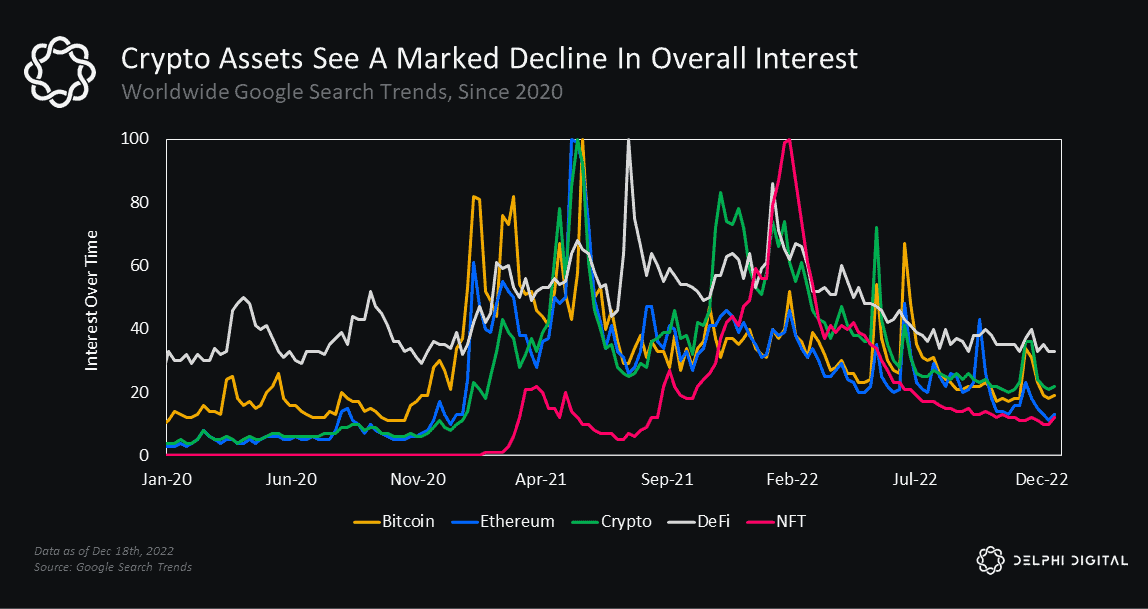
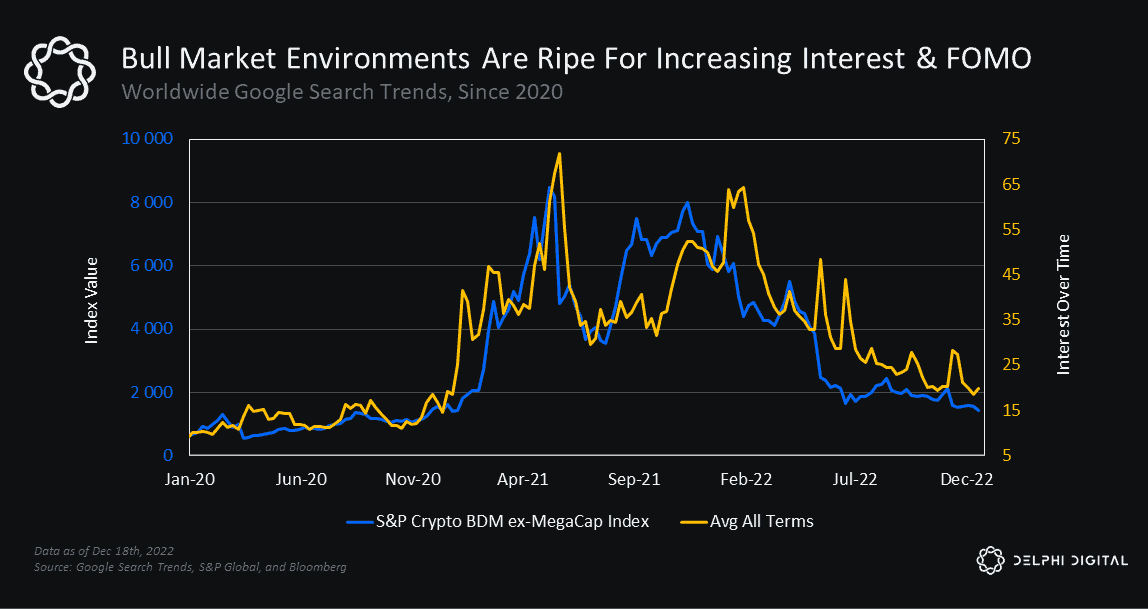
Unsurprisingly, interest tends to pick up during bull markets and wane in bearmarkets.4BTC is trading right in the range of its previous 2017 peak and its summer 2019retest, an area many consider to be a pocket of vulnerability as we head into2023.
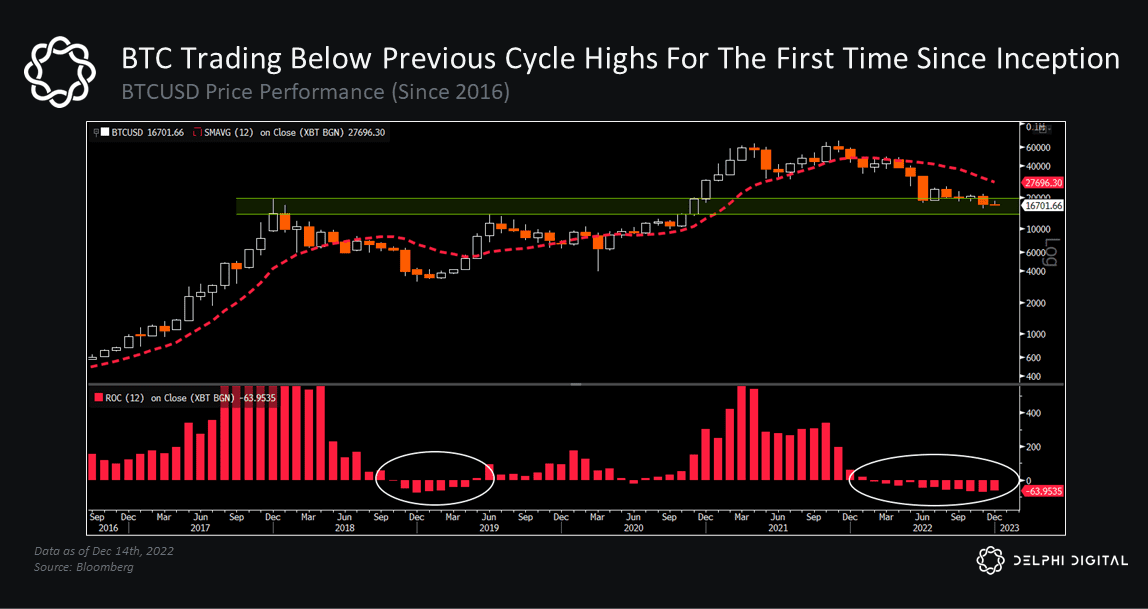
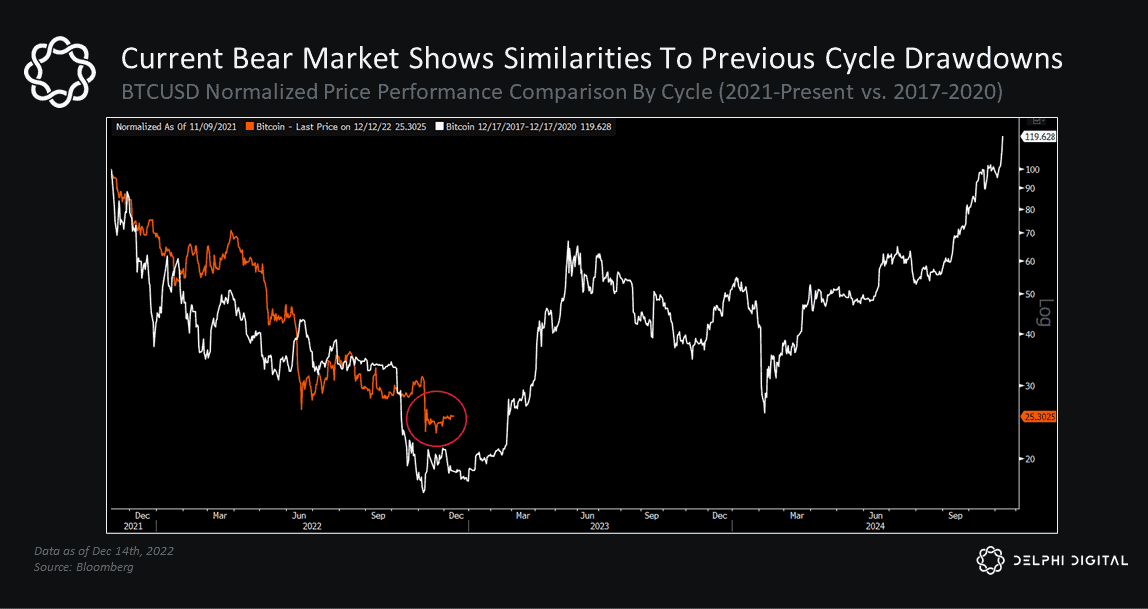
BTC is down ~76% from its prior all-time high. For context, the price of BTC fell~85% from peak-to-trough in each of the last two major bear markets. Historynever repeats itself, but this year’s drawdown mirrors that of 2017-2018 in anyways.
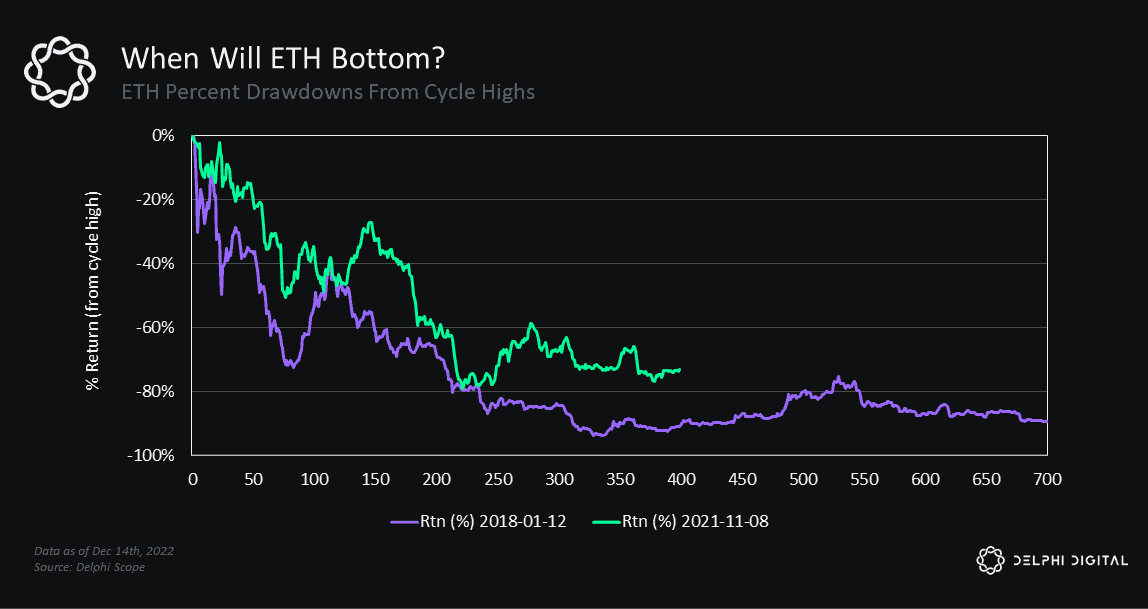
ETH saw an even larger drawdown during the 2017-2018 cycle, falling 93% frompeak-to-trough. ETH’s peak drawdown this year was 82% back in June — it’scurrently trading ~76% off its prior ATH as well.
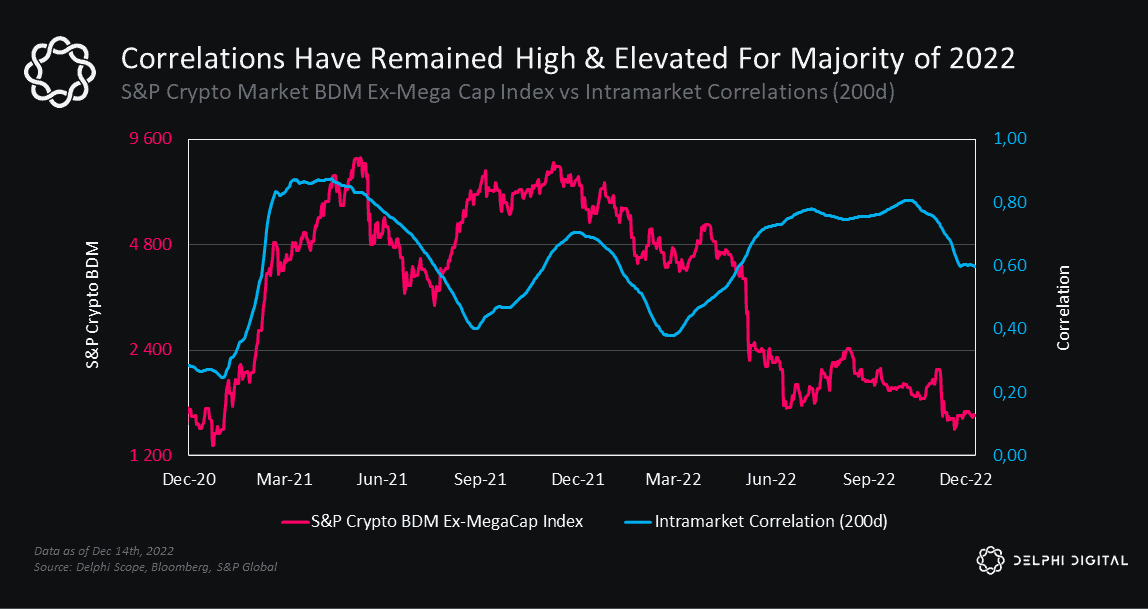
Interestingly, BTC and ETH peaked in November 2021, unlike the rest of the cryptomarket which peaked earlier in the year back in May 2021, as measured by theS&P Crypto BDM Ex-MegaCap Index. The broader crypto market hasexperienced an even sharper ~82% price drawdown from its all-time high.
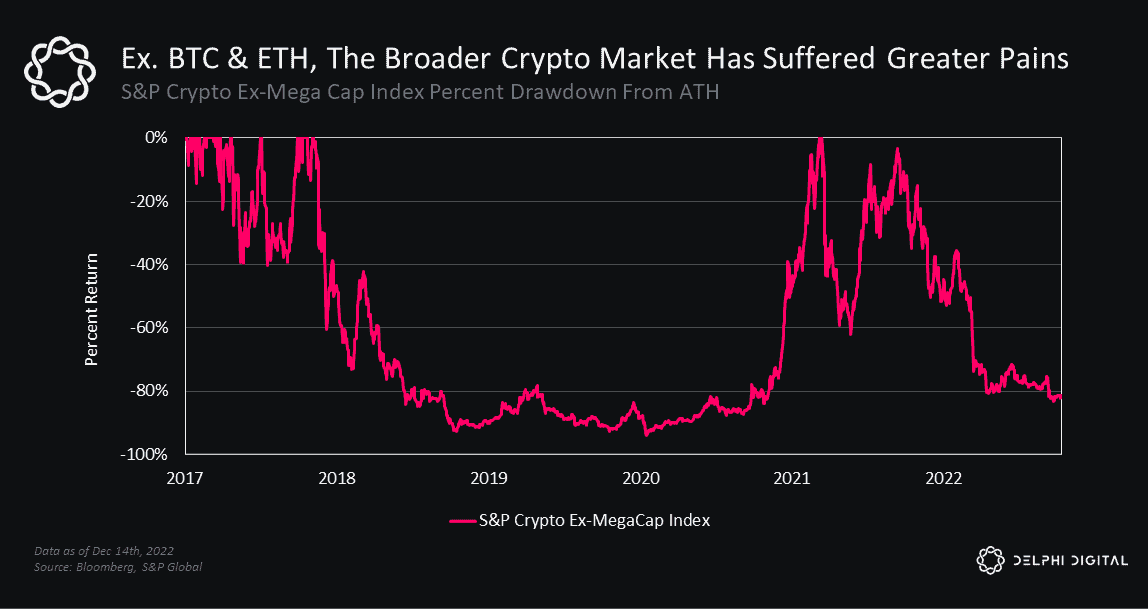
If the market were to mimic the same peak-to-trough drawdown of last cycle(~93%), the total market cap for the broader market would have to fall another~60% from here (though that’s not our base case).
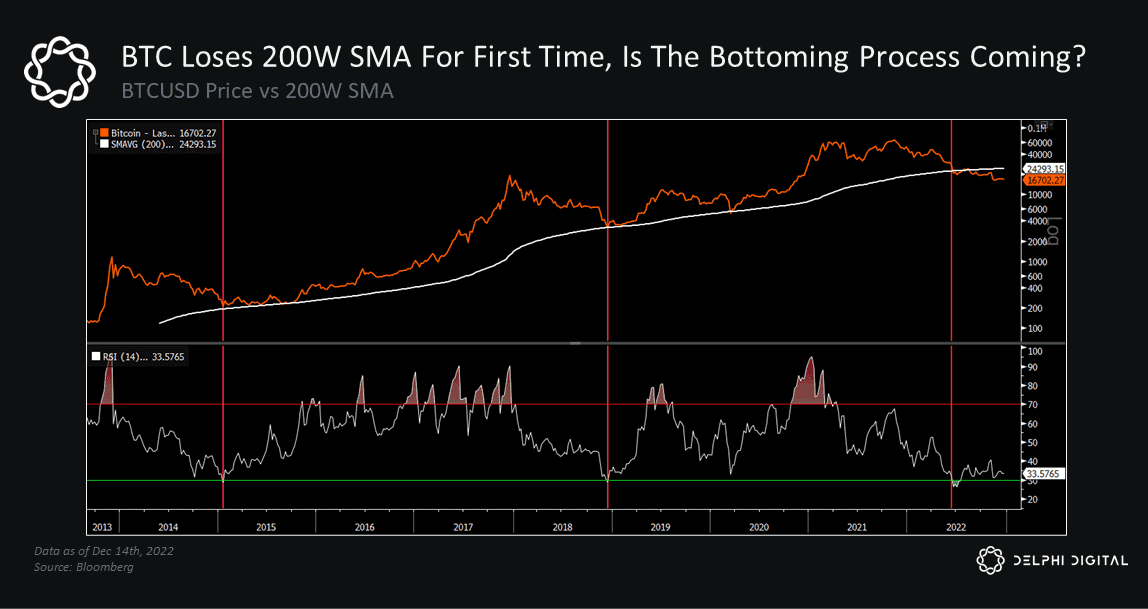
Correlations between crypto and traditional asset classes have been very tightover the last 12 months, and for good reason. Intramarket correlations withincrypto have also remained elevated this year, which has led to widespreadweakness across every major sector.Bitcoin is now trading roughly two standard deviations below its long-term trend.
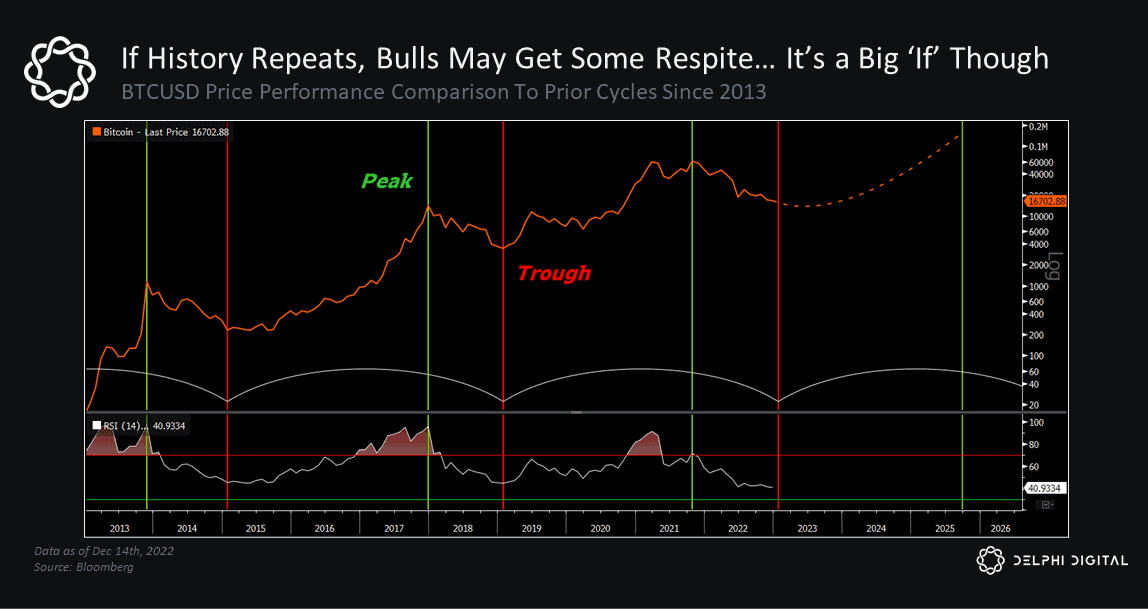
Prior cycle bottoms were marked by a sizable selloff that pushed BTC intooversold territory on its 14-month RSI and a test of its 200-week MA, whichhistorically served as strong support for price to find a floor. We saw these sameconditions play out this past summer, and BTC has been largely rangeboundsince.
Past performance is not indicative of future results. But if this cycle follows thegeneral path of those before it, one would expect to see markets consolidate intoQ1 2023 before forming a clear bottoming pattern. This accumulation period in H12023 would be a welcoming setup for the crypto market to move into its next bullcycle. We would add that this is dependent on a reversal in the key macroheadwinds that have weighed on risk assets throughout 2022.
Key Theme #1: Liquidity Still Runs the World
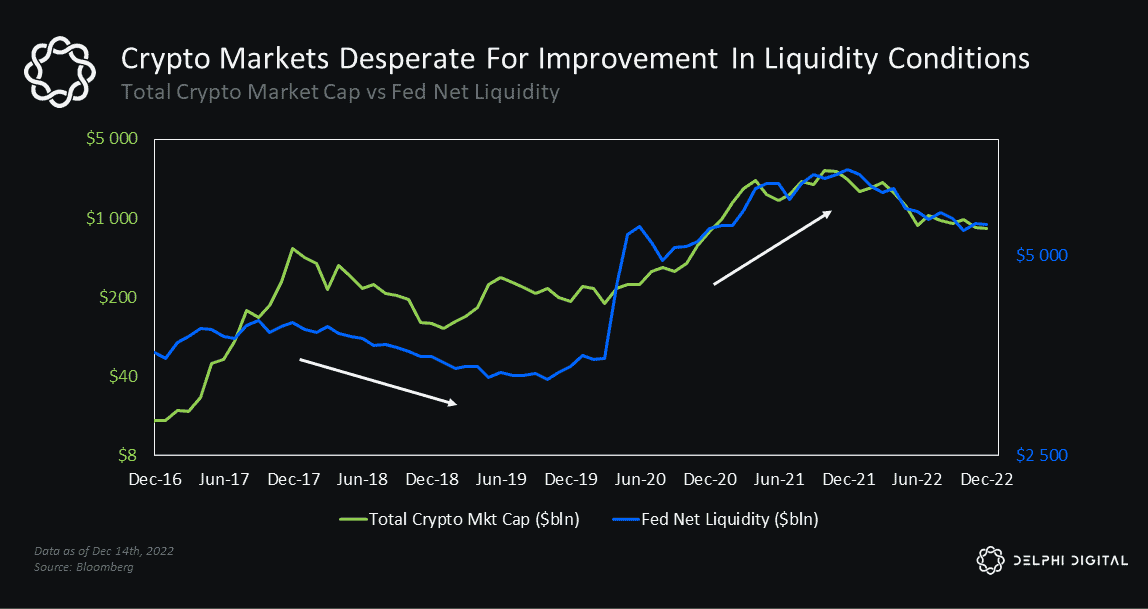
We noted at the turn of last year that a sustained downtrend in global liquidity wasthe biggest risk to crypto markets heading into 2022.
“Bitcoin is one of the purest plays on fiat currency debasement. It also happens tobe one of the most leveraged bets on global liquidity; when liquidity is abundantand expanding, BTC and crypto assets tend to outperform; when liquiditytightens, they struggle.”
Global liquidity is the most powerful force in macro, which is why it’s our first keytheme and one which we believe will have a significant market impact in 2023.
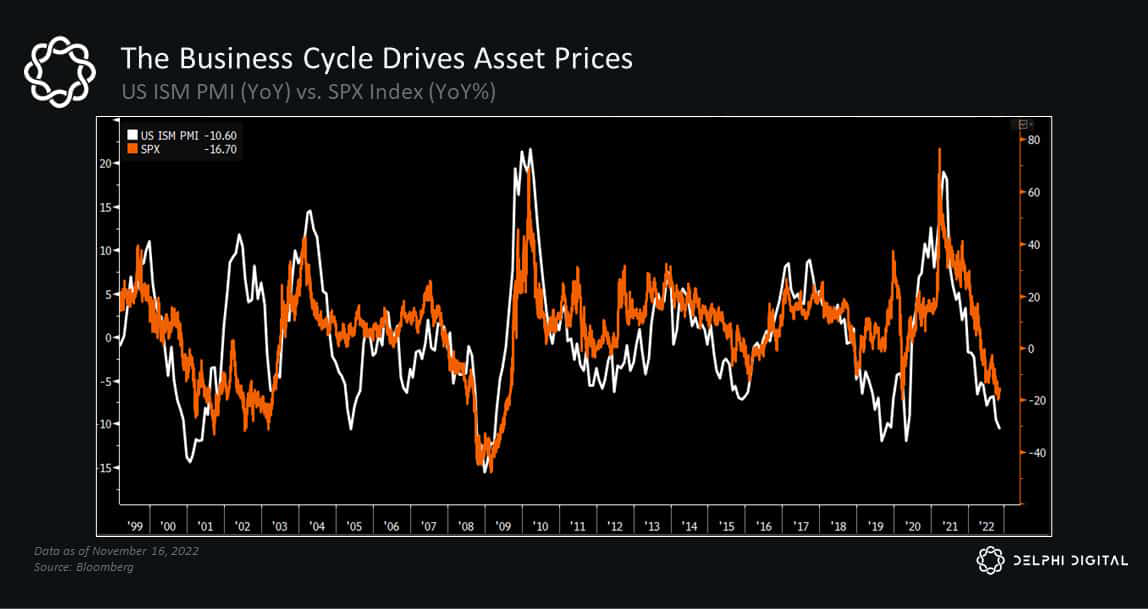
Global liquidity cycles have a strong correlation with changes in the business cycle.
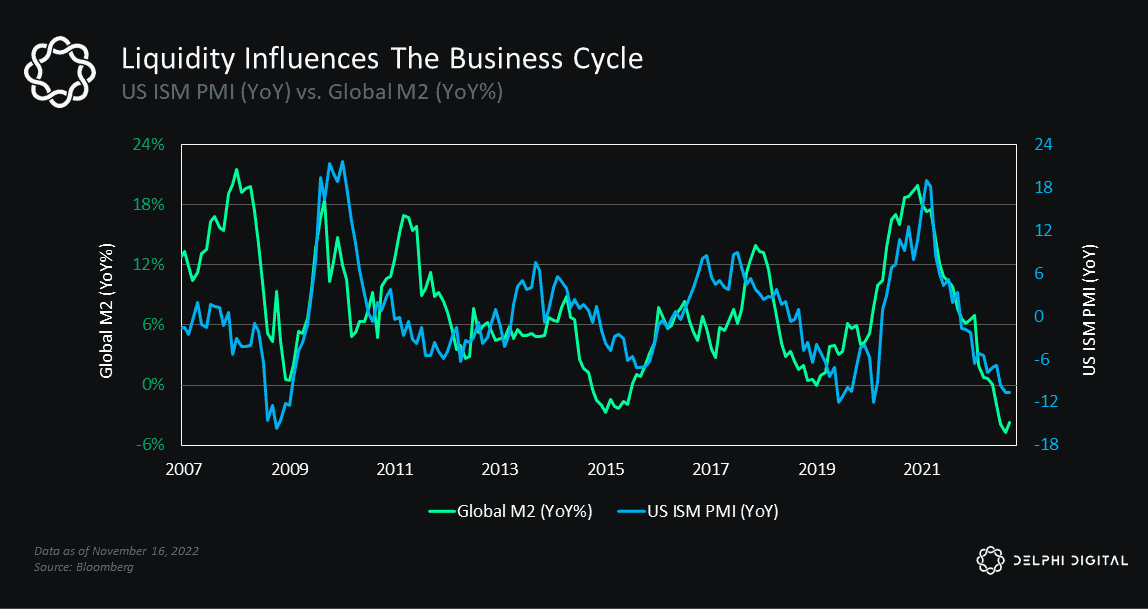
And the business cycle drives changes in asset prices.
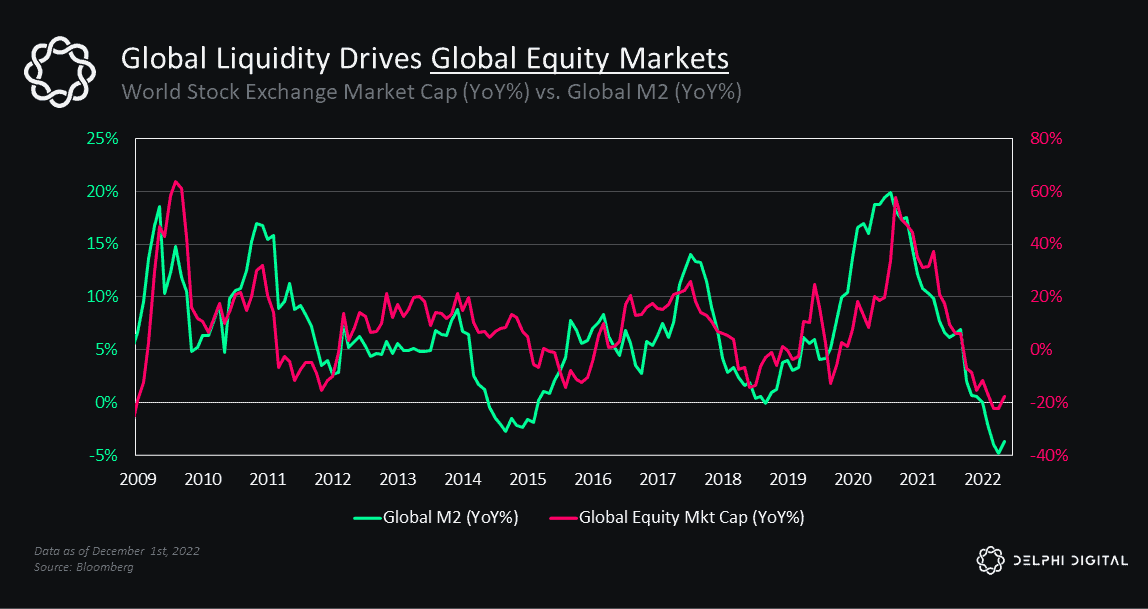
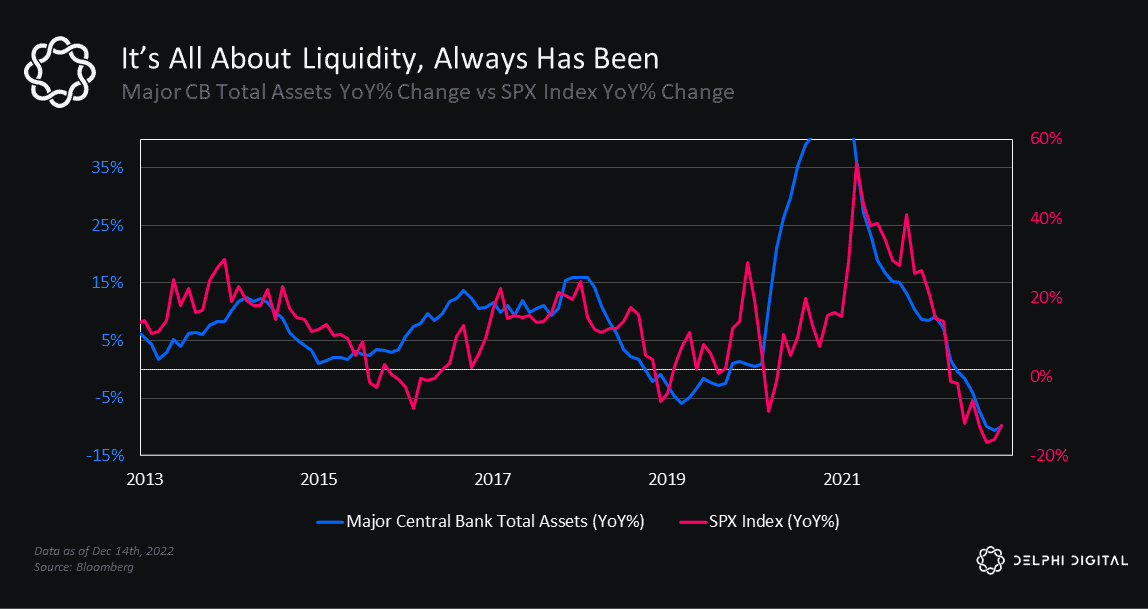
Therefore, trends in global liquidity influence the direction of markets. They drivefluctuations in global equities…
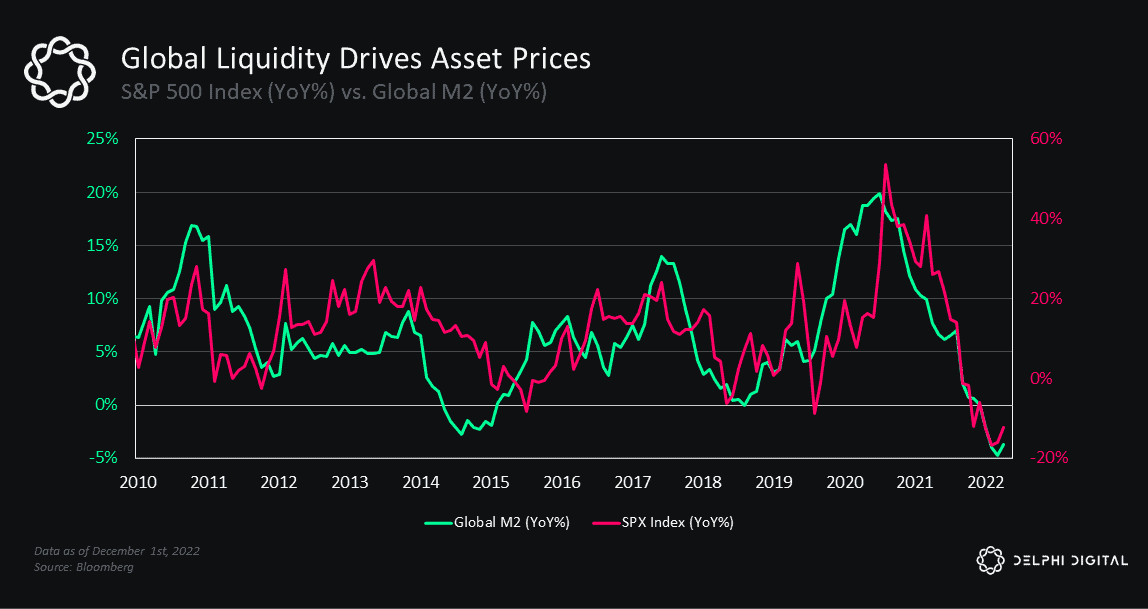
And have a strong impact on the largest equity market in the world.
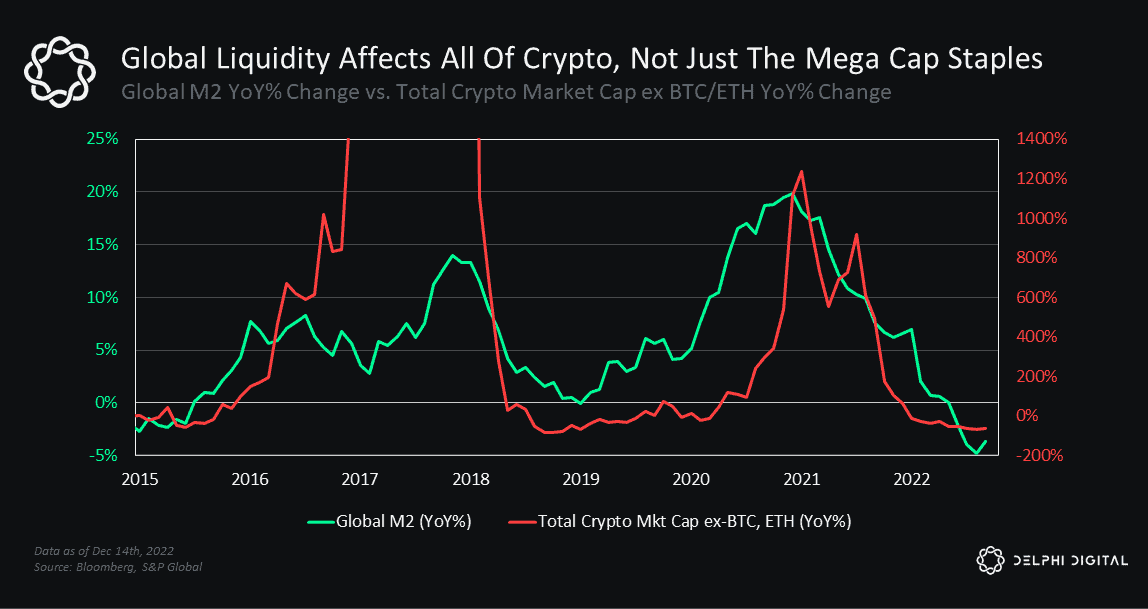
They even influence the direction of the crypto market.
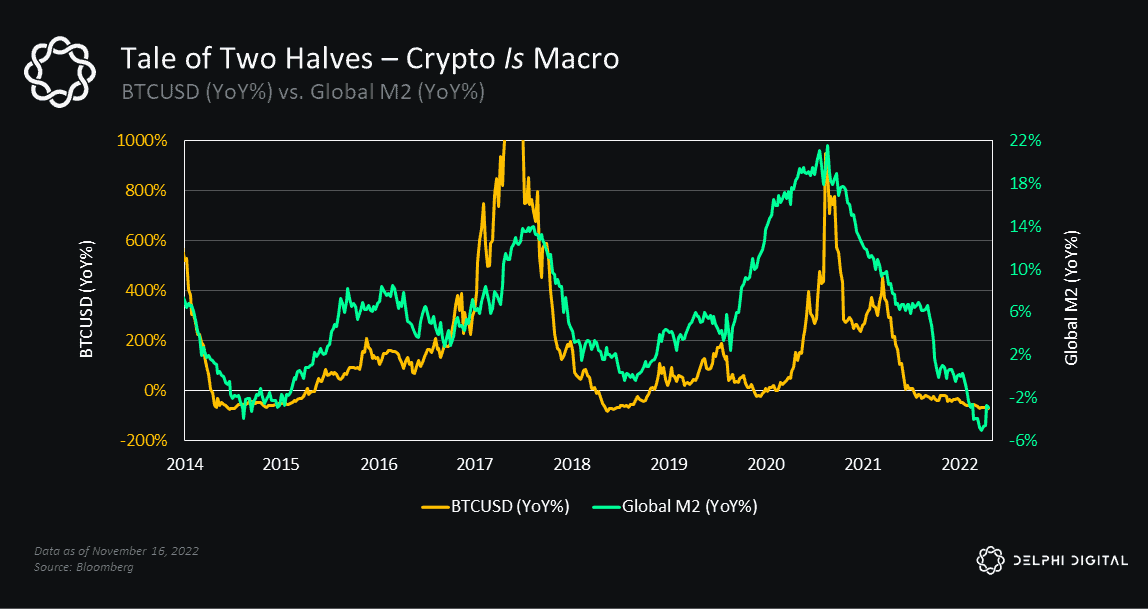
And not just mega caps like BTC and ETH…
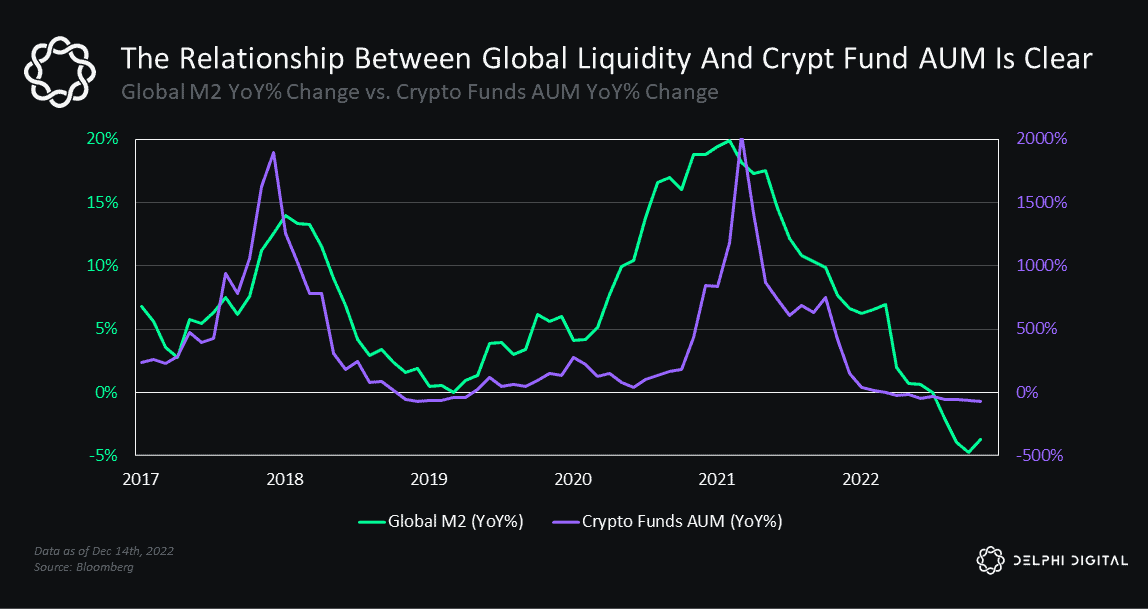
Global liquidity’s influence on crypto asset prices also affects capital flows into(and out of) crypto funds.
One caveat is that M2 is not an all-encompassing measure of global liquidity (seeour prior report Liquidity Runs The World for a more in-depth discussion on thesepoints), but it serves as a decent proxy. It tracks trends in major central bankbalance sheets……
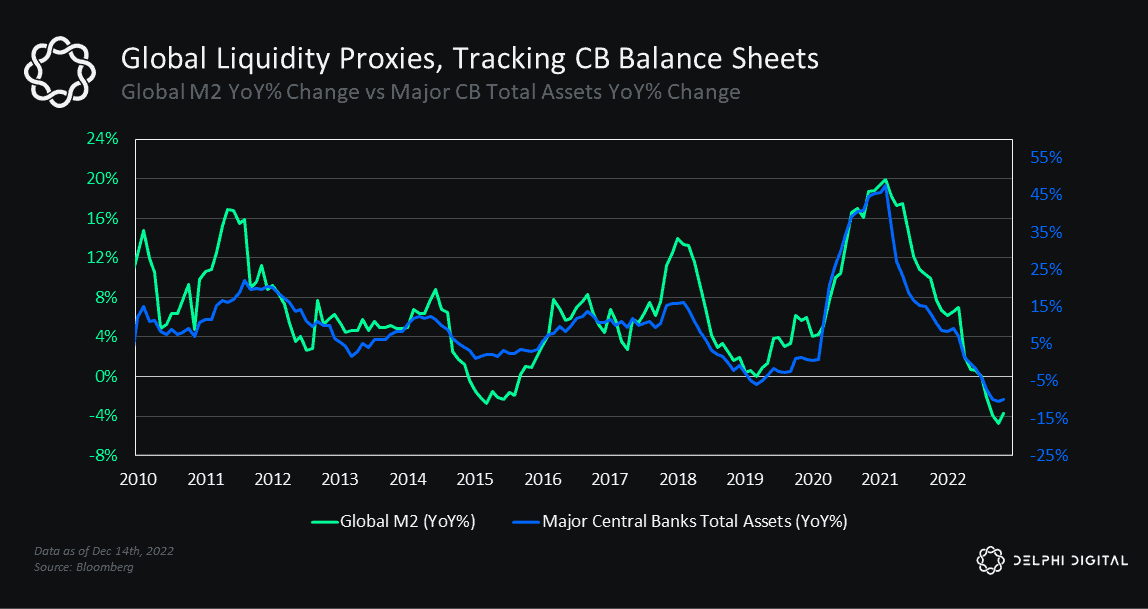
and the relationship with markets, including crypto, is striking.
Liquidity cycles aren’t new — we’ve seen their power before. Global liquiditygrowth slowed considerably back in 2018 as financial conditions became morerestrictive. The result was a sizable correction in risk assets and a prolonged bearmarket for the most speculative long-duration assets (like crypto). We saw asimilar dynamic play out over the last 12 months, though on an even greater scale.
Global liquidity cycles drive changes in asset prices. They influence the directionof global equity markets. They drive fluctuations in bond yields and creditspreads. They even have a substantial impact on the crypto market, which is whya reversal in global liquidity is one of — if not the most — important catalystsfor a renewed bull market.
It also looks like this liquidity cycle is approaching another inflection point.
Global Liquidity – The Reversal We Need

There are early signs that a reversal in global liquidity is upon us. Here’s anupdated chart from CrossBorder Capital that shows the early signs of a potentialbottom in this current cycle:
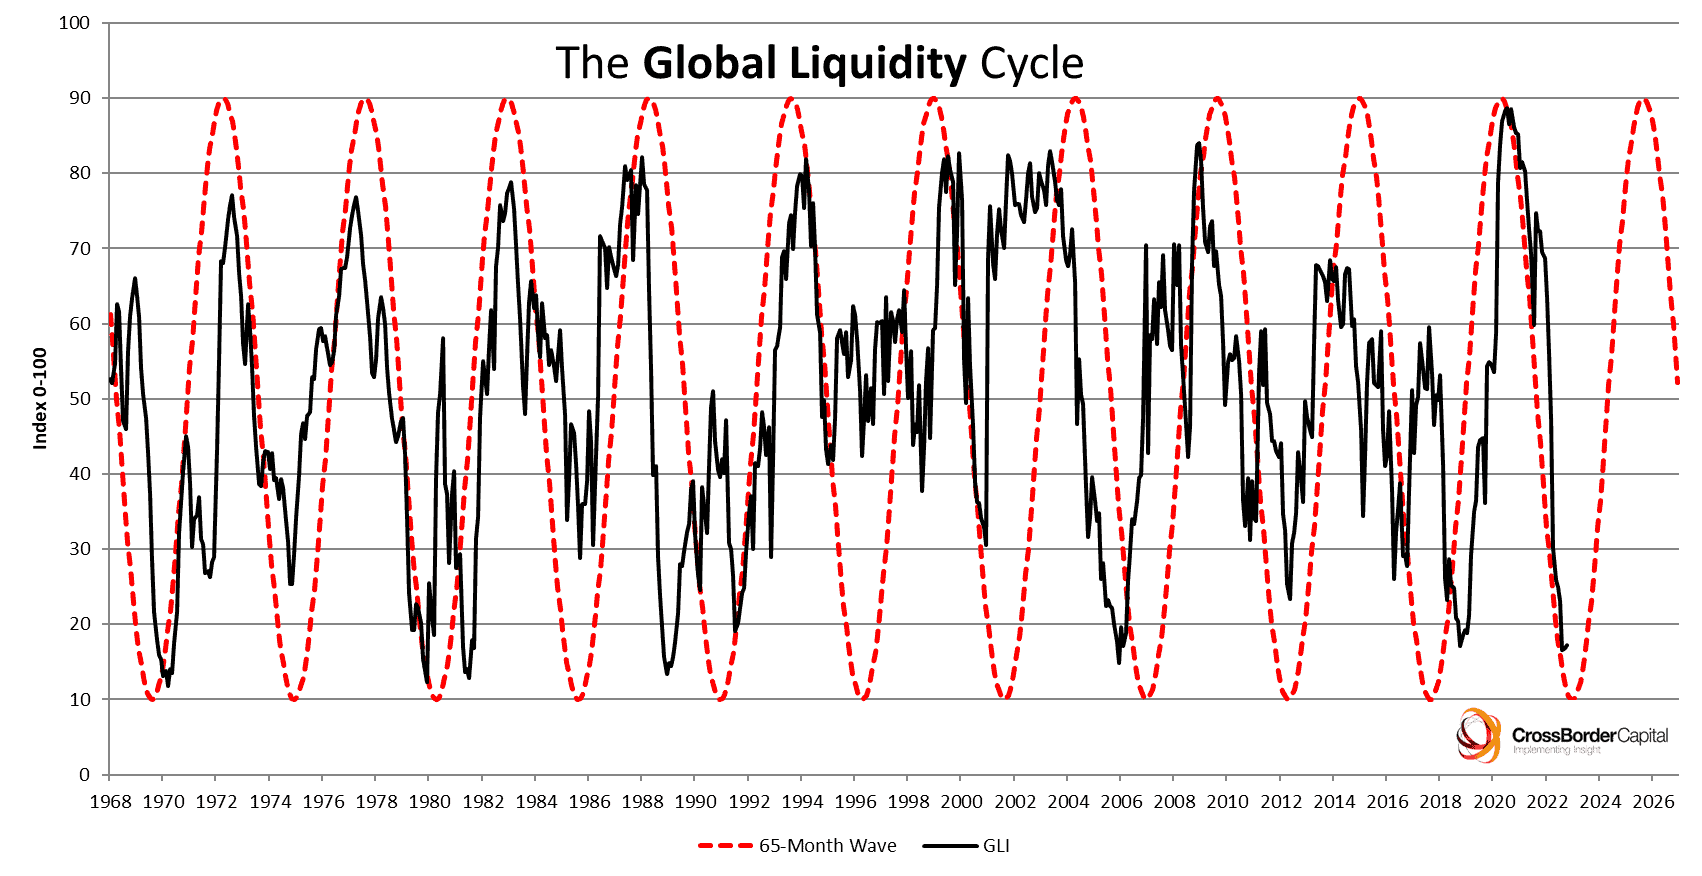
“The cycle moves in 5-6 year waves and is currently just starting to turn higherfrom its mid-2022 lows. Global liquidity leads financial markets by some 6-12months and economies by around 12-18 months…it shows that we are at ‘maximumtightness’” – CrossBorder Capital
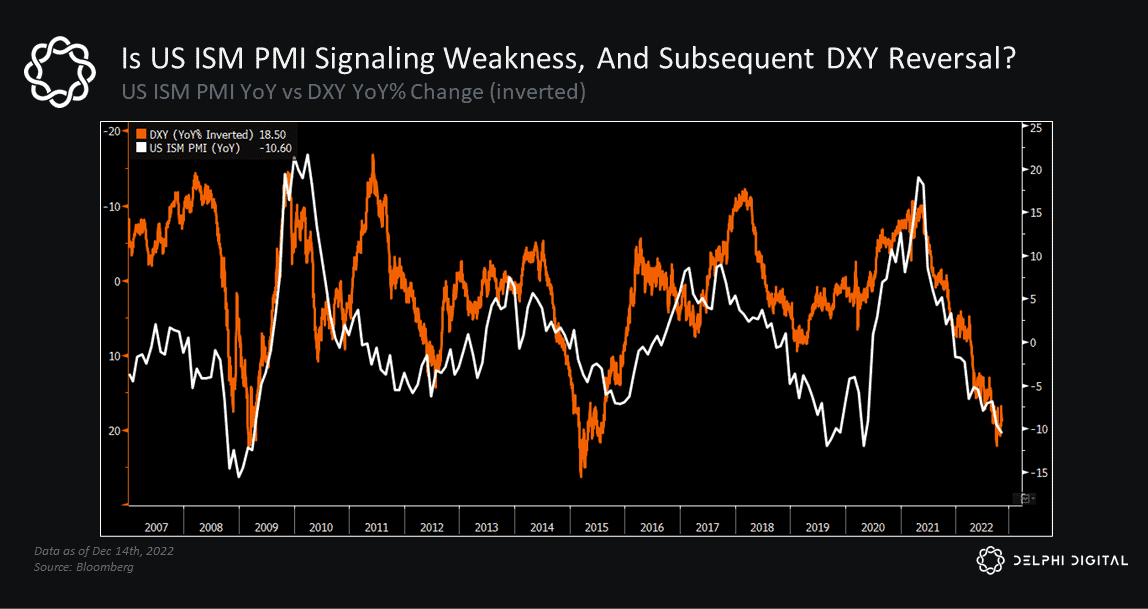
Our good friend Raoul Pal also has a great chart showing how the business cycletends to lead liquidity reversals as well.
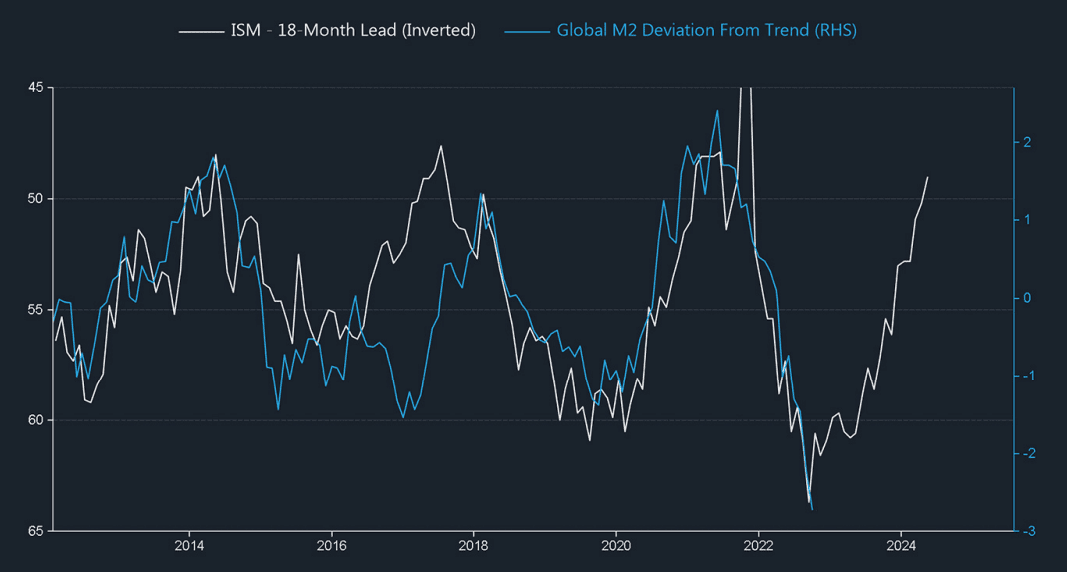
“…but the business cycle leads liquidity, and the ISM (shown inverted here) isforecasting significant economic weakness ahead, and thus liquidity is on thecusp of turning to offset falling growth…” – Raoul Pal, GMI
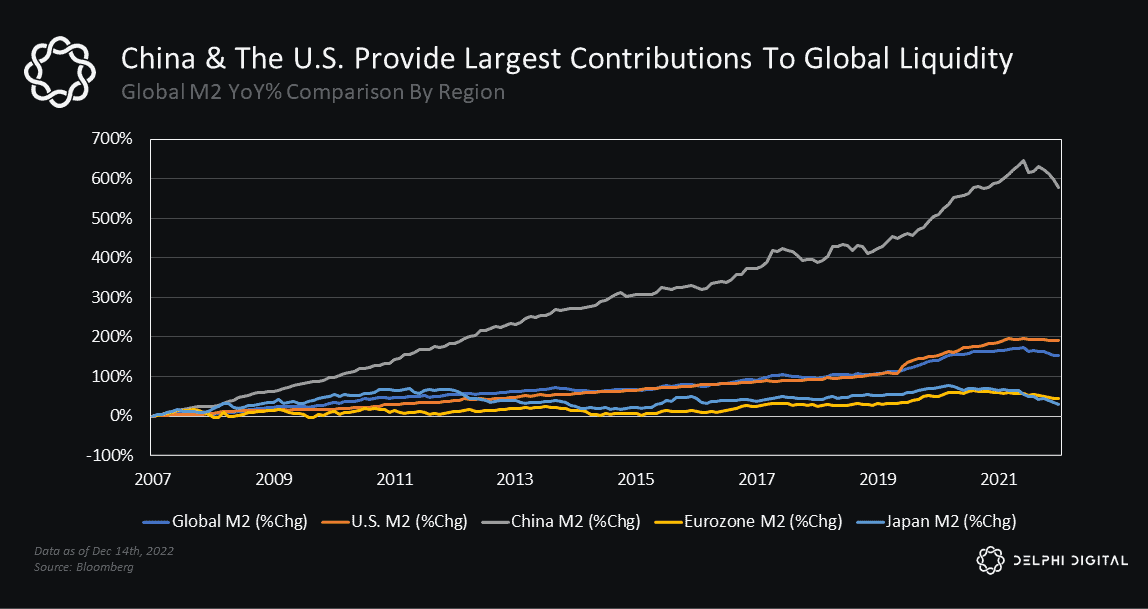
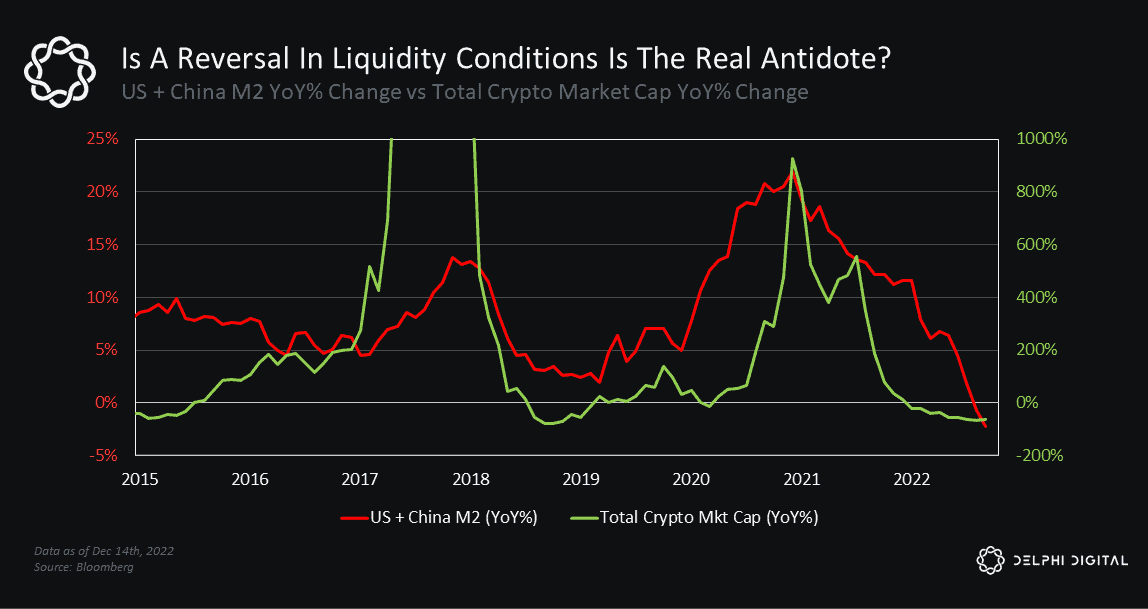
The two biggest contributors to global liquidity are the US and China. The world’ssecond largest economy has grown to be a liquidity powerhouse over the last 15years.
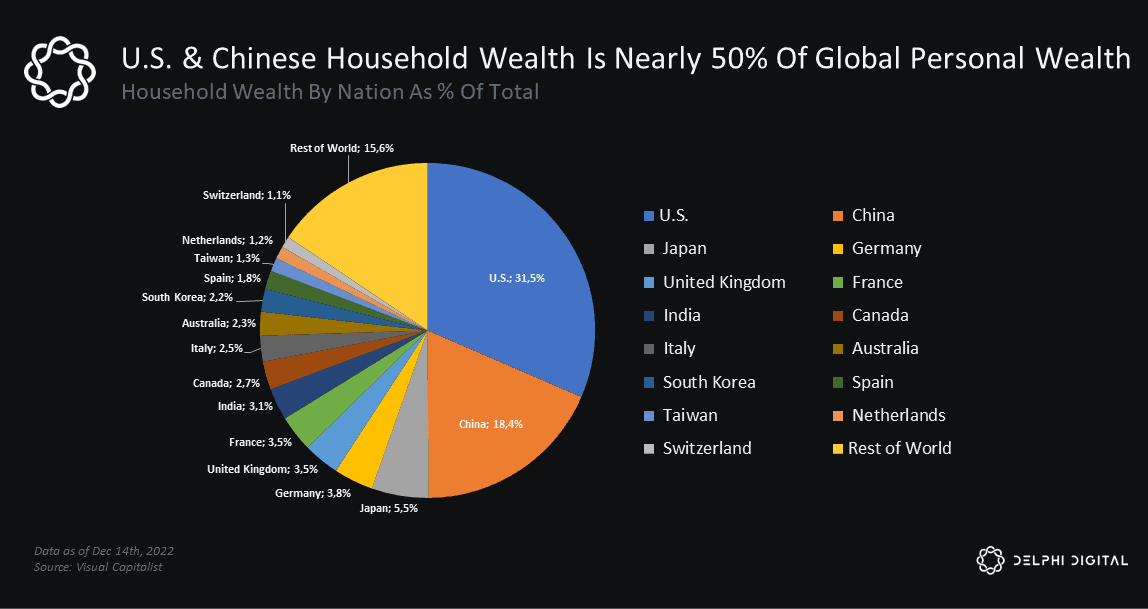
Households in the US and China also make up nearly half of the world’s personal wealth.
After months of stern rhetoric, pressure is starting to mount on China as itseconomy sputters. Policymakers are warming up to the idea of supportiveinitiatives aimed at promoting growth as the country continues to grapple withsignificant headwinds (some of which are self-induced, e.g., zero-COVID).
The focus in China is shifting, and reopening its economy is now top of mind tocombat its weakening growth outlook. The PBOC has already asked banks to“stabilize” lending to property developers, a critical sector for China’s economy,who’ve struggled to claw their way out of a year-long slump that’s left manycompanies cash-strapped and facing greater insolvency risk. The PBOC recentlycut required reserves for banks for the second time this year — the latest ofwhich is estimated to free up ~$70B of liquidity — and will likely take further actionto prop up growth (especially as the rapid spread of COVID infections impact agrowing percentage of its workforce).
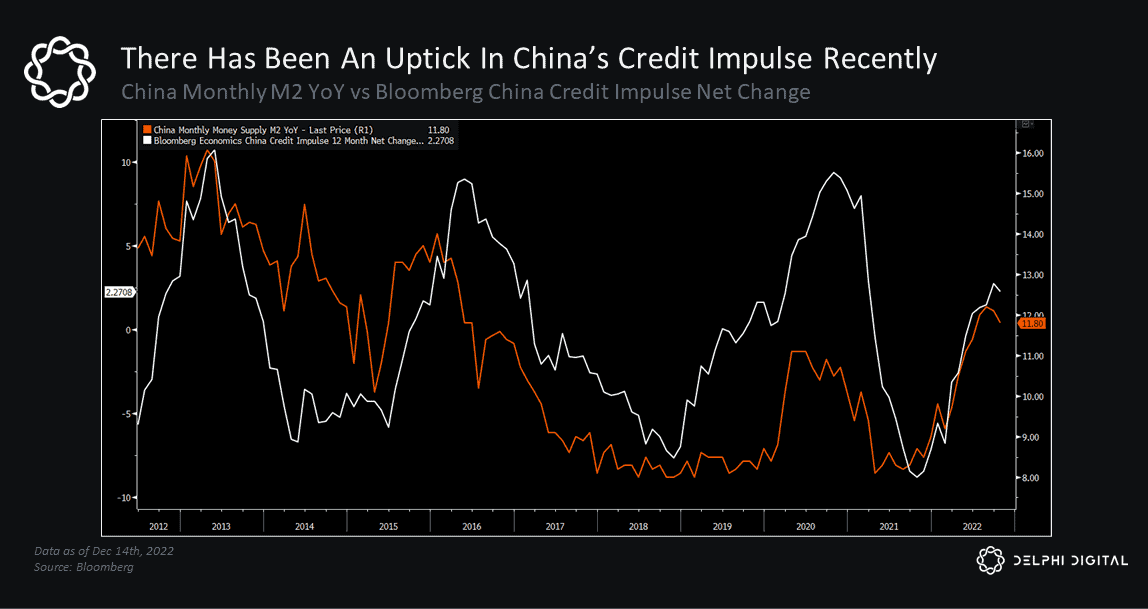
China’s credit impulse has turned higher in recent months too.
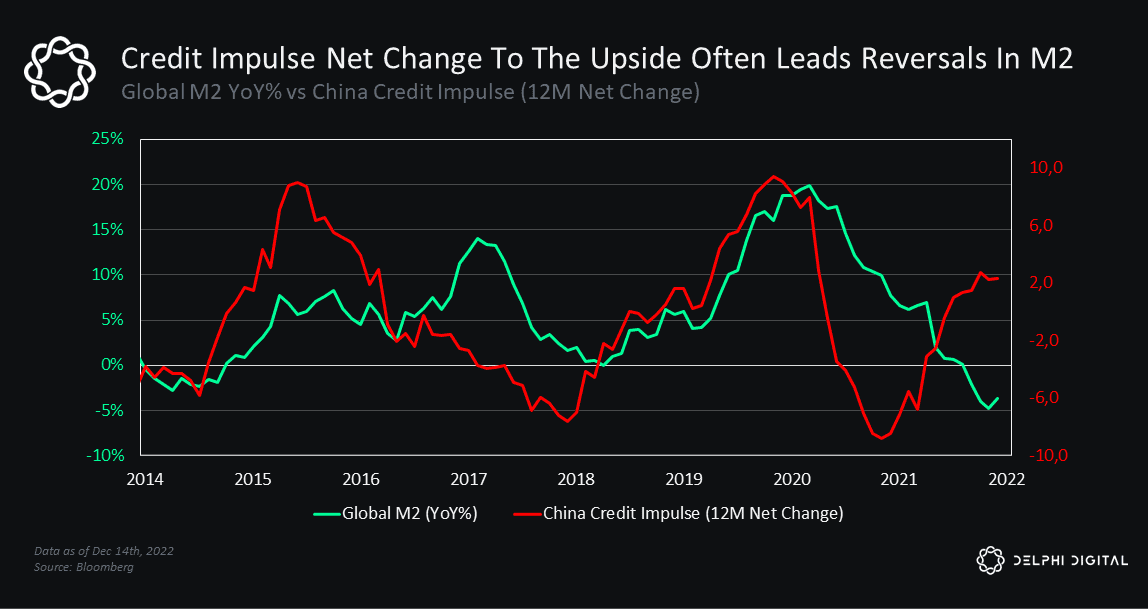
Positive net changes in China’s credit impulse tend to lead to reversals in global M2 growth.
In recent years, they’ve also led trend reversals for the US dollar (which would bea very welcoming sign for markets).
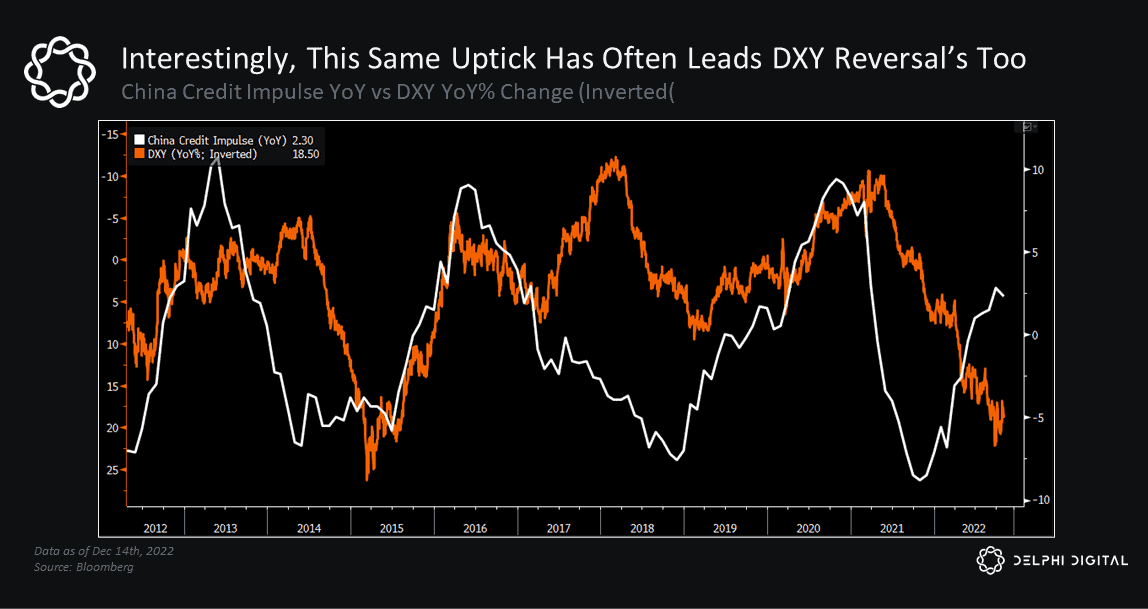
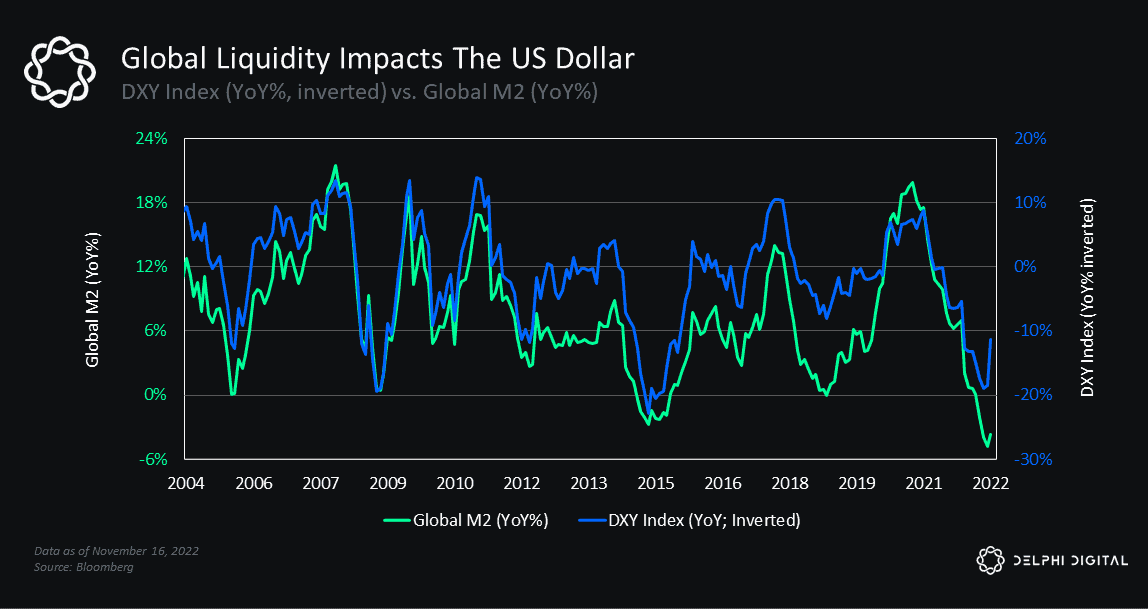
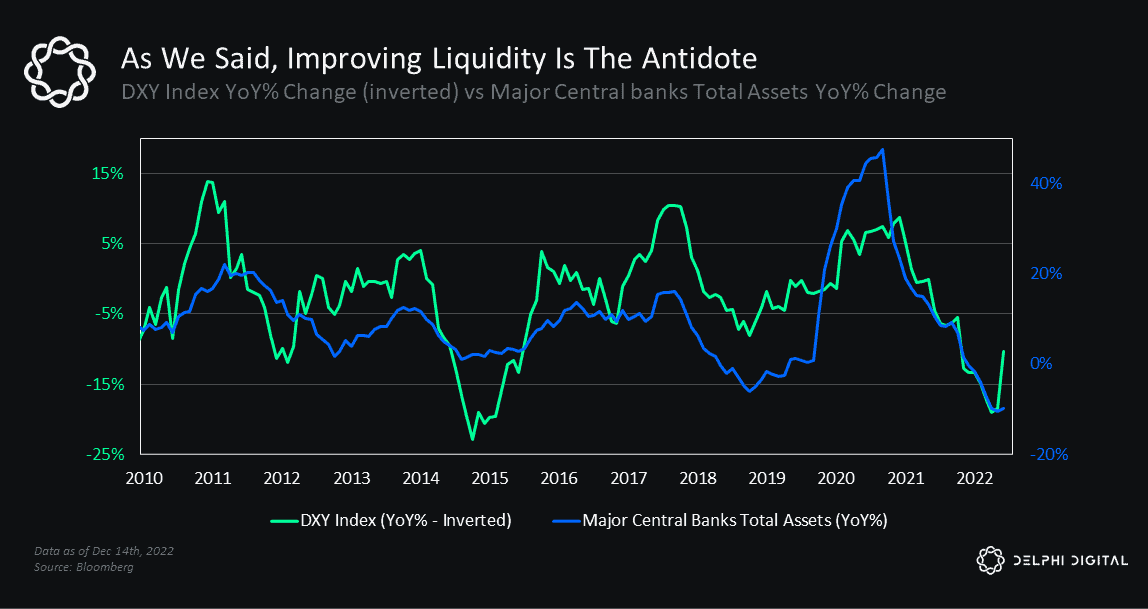
Global liquidity cycles have an inverse relationship with the dollar, making them akey trend to monitor given our past warnings that a strong USD remains one of thebiggest headwinds facing risk markets (including crypto).
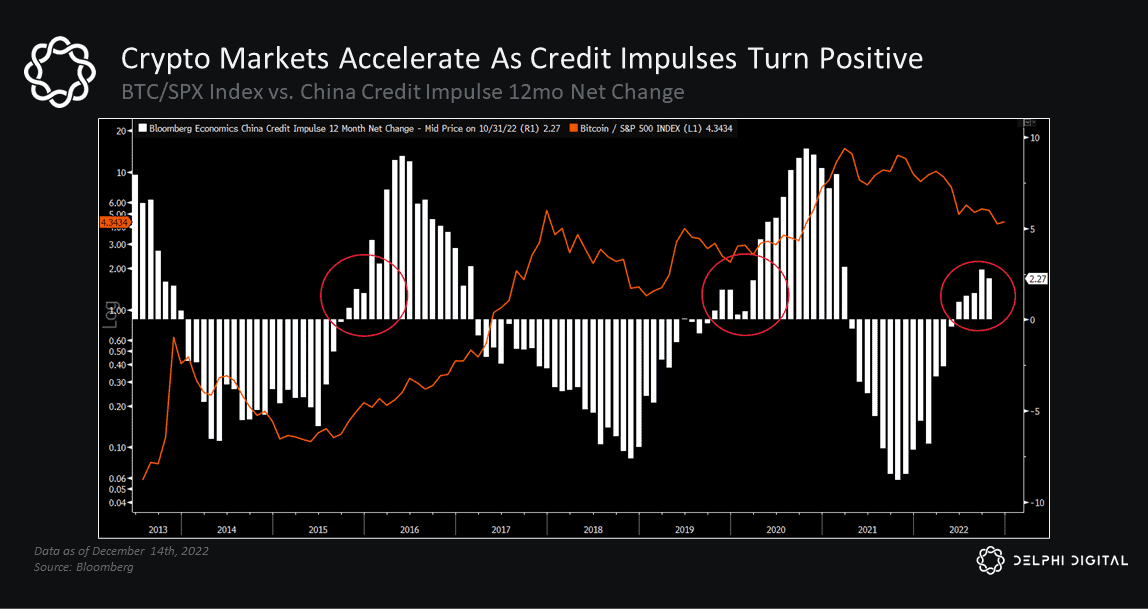
We saw the year-over-year change in China’s credit impulse bottom ahead of thecrypto market back in 2018, which may support a more optimistic outlook as weget deeper into next year.
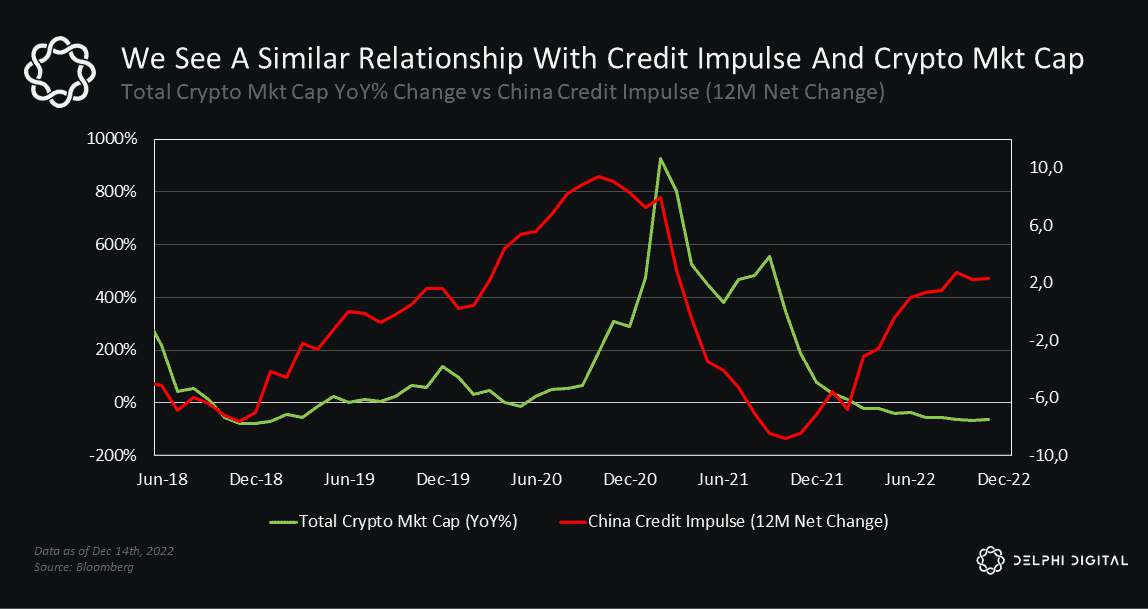
The crypto market’s outperformance really started to accelerate after the netchange in the China credit impulse turned positive, which is something we’vealready started to see over the last few months.
The Fabled “Fed Pivot”
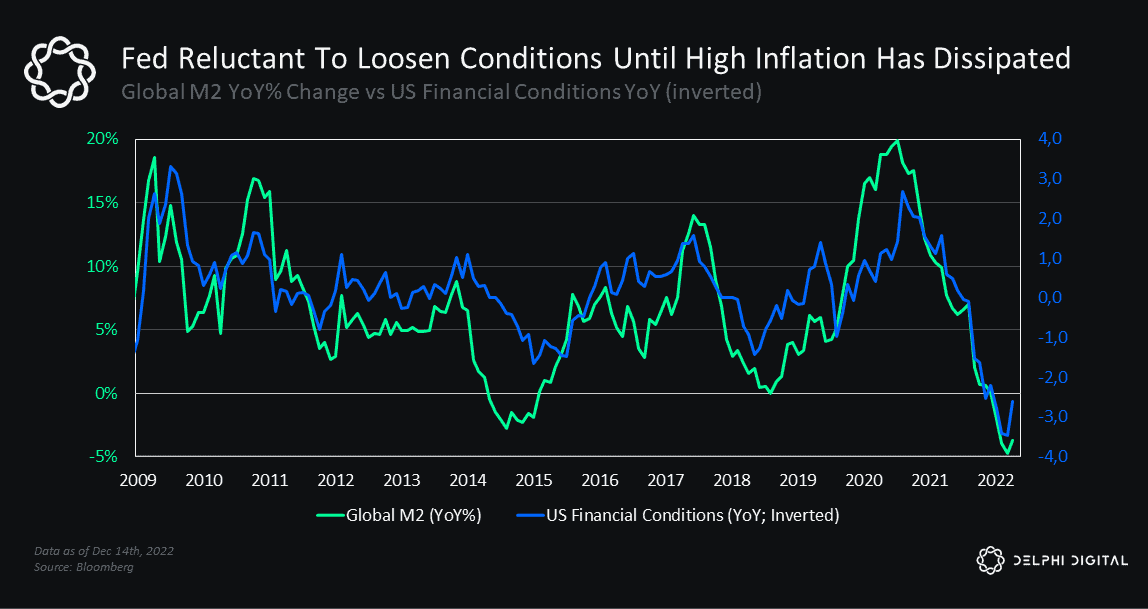
The US is a bit of a different story, at least for now. Much to the dismay ofinvestors, the Fed has aggressively targeted tighter financial conditions in its battle against inflation.
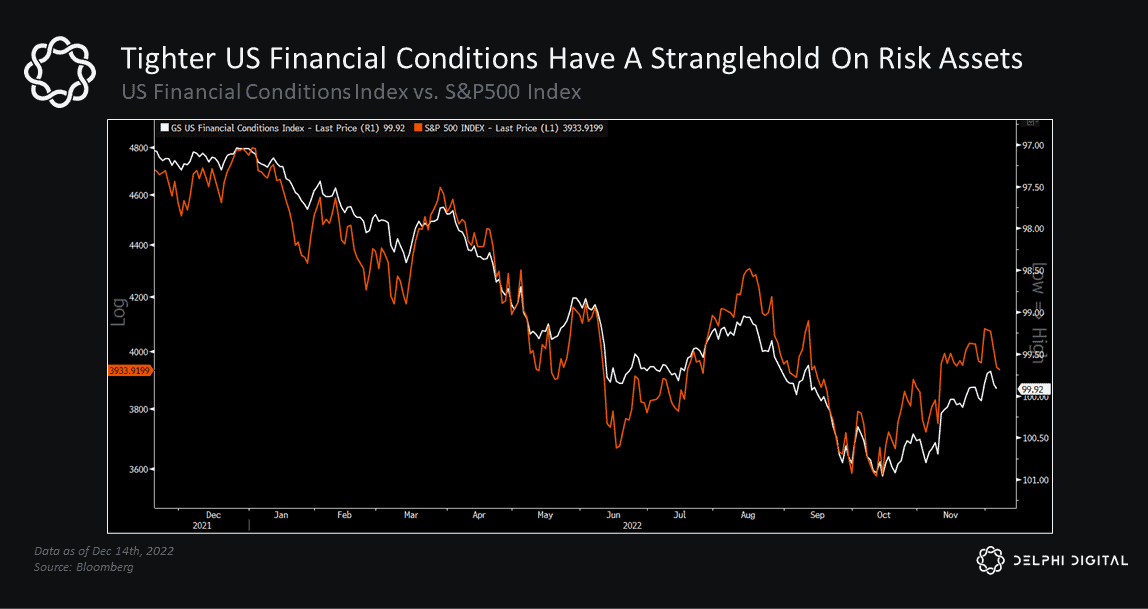
Tighter financial conditions are no friend of markets, especially risk assets whosevaluations are grounded in potential growth further out in the future.
The US has yet to show signs of a liquidity reversal. Liquidity conditions haveimproved somewhat over the last several weeks, but more improvement isneeded to see a sustainable move higher in markets.
The problem is that an expansion in global liquidity tends to loosen financialconditions, which is the opposite of what the Fed wants right now (at least untilthey have more confidence that persistently high inflation is officially behindthem).
Many pundits are trying to predict when we’ll see a “Fed pivot,” but most arefocused on when the Fed will pause rate hikes and if/when they’ll start signaling anew wave of rate cuts.
Rather, we’d argue that what really matters is when we see a reversal in liquidityconditions — that’s what will continue to have an outsized influence on marketsand asset prices going forward. We saw this dynamic during the 2017-2018 cycle,which we highlighted at the start of the year:
“…the crypto market had one of its best bull runs on record [during 2017], even asthe Fed (and other major central banks) started to raise rates…it wasn’t untilliquidity conditions started to deteriorate that BTC topped out [as we saw in early2018].
”TL;DR: We have to keep our eyes on changes in liquidity.
If the US and China move towards a more expansionary liquidity environment,that would give us stronger conviction that a bottom is truly in the rearview.Longer-duration risk assets will likely lead the way when the market realizes thatthe liquidity trend reversal has legs.
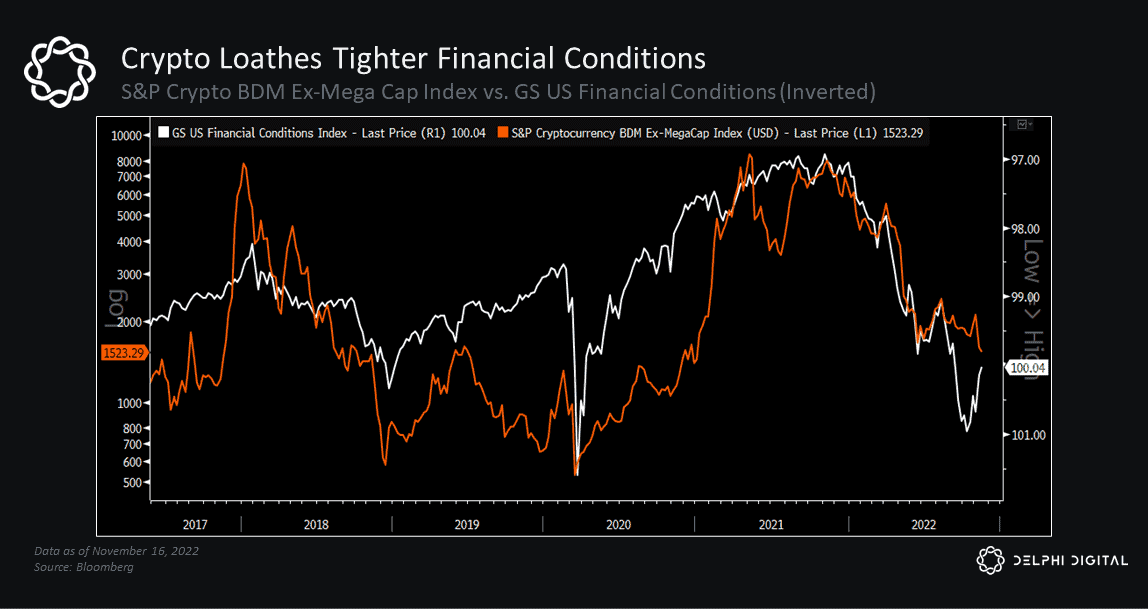
Liquidity Impacts Crypto Markets Too
This liquidity phenomenon isn’t just present in traditional markets, it’s alsoprevalent in crypto.When prices are high, the crypto economy has a bigger balance sheet that canbe borrowed against. During the 2020-2021 bull market, we saw the total amountof loans outstanding balloon alongside asset prices.
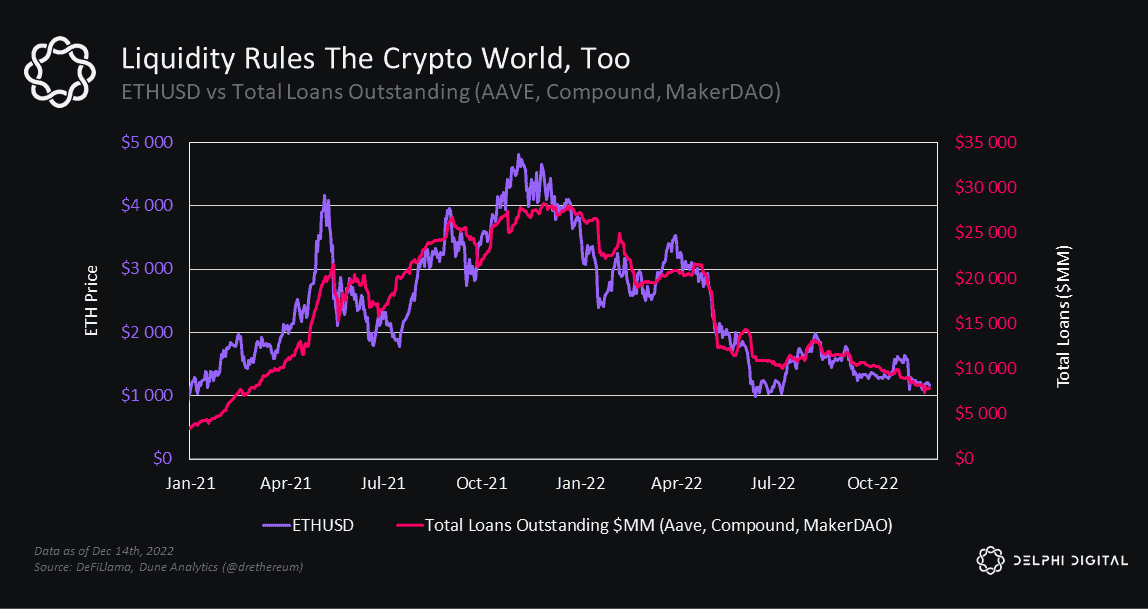
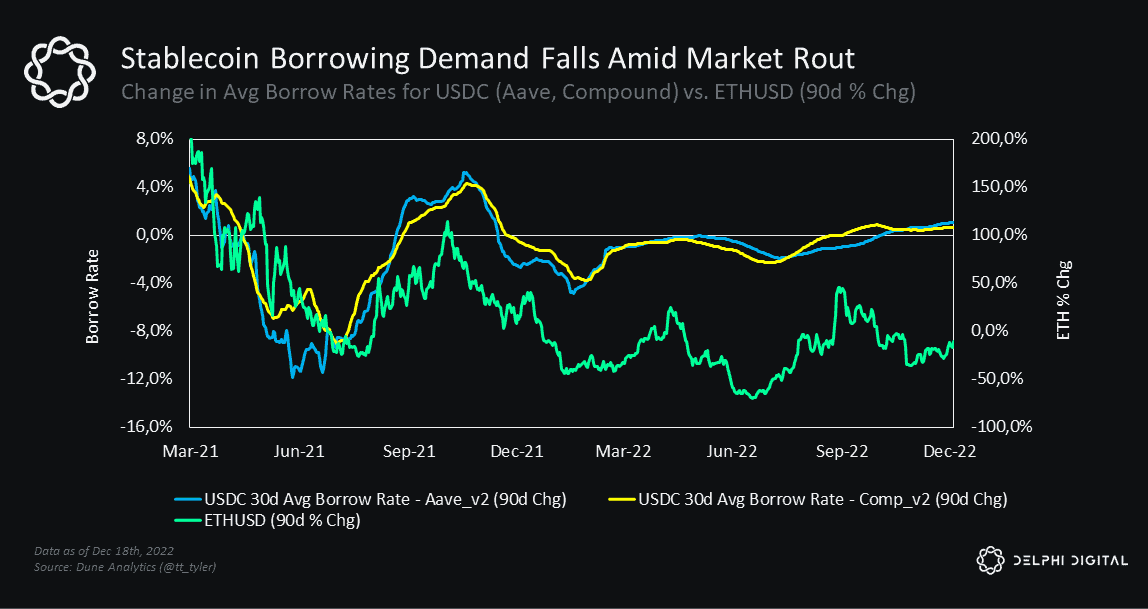
This year, we’ve seen a significant decline in demand for borrowing alongside thevalue of crypto assets.
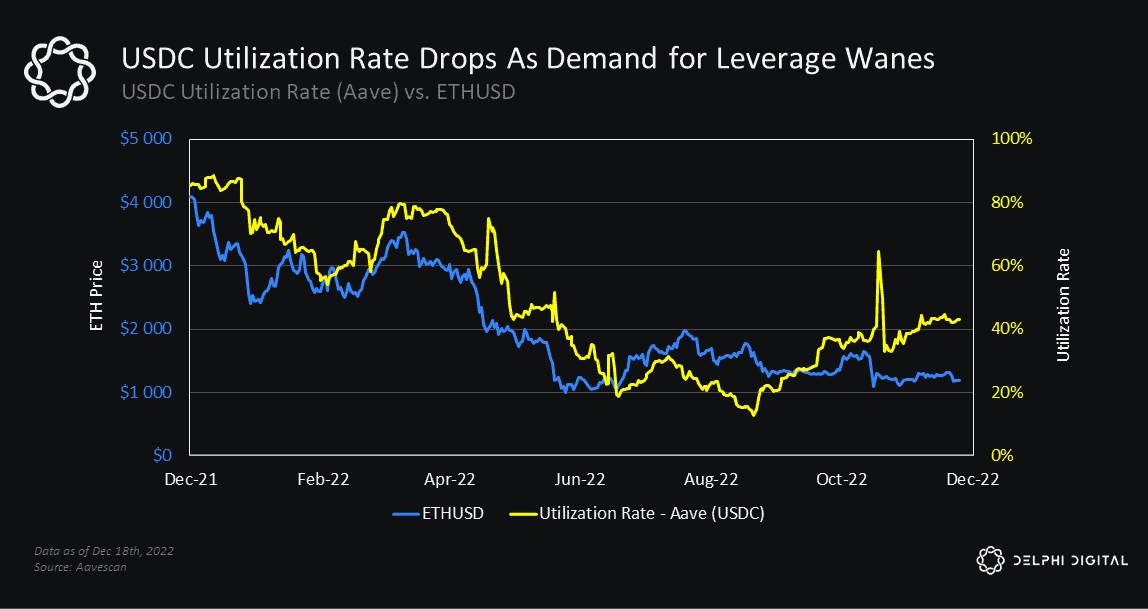
This pullback in borrowing demand has led to a decline in utilization rates for the most prominent collateral types like USDC.
Centralized lenders have historically served as a notable source of liquidity.That’s why headlines about large prime brokers and lenders (like Genesis)needing emergency funding are so impactful. If we see further contraction incredit growth, that means less liquidity for the crypto economy.
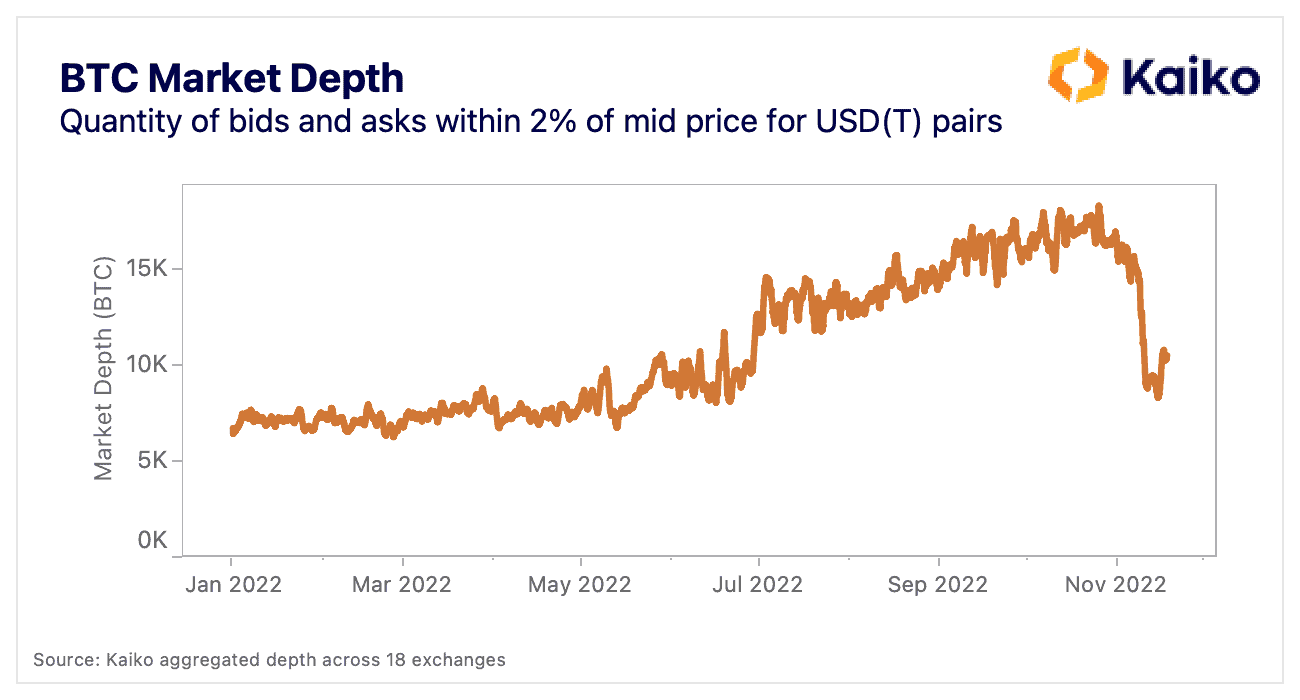
Market makers also got caught up in the FTX collapse. Higher volatility forcesMMs to reduce their risk, leading to worsening market liquidity conditions, as seenover the last several weeks. In the immediate aftermath of the FTX collapse,market liquidity for BTC-USD pairs dropped to its lowest level since early June,according to data from Kaiko.
The sizable drop in total stablecoin market cap after the LUNA/UST implosion isanother example of a negative liquidity shock this year.
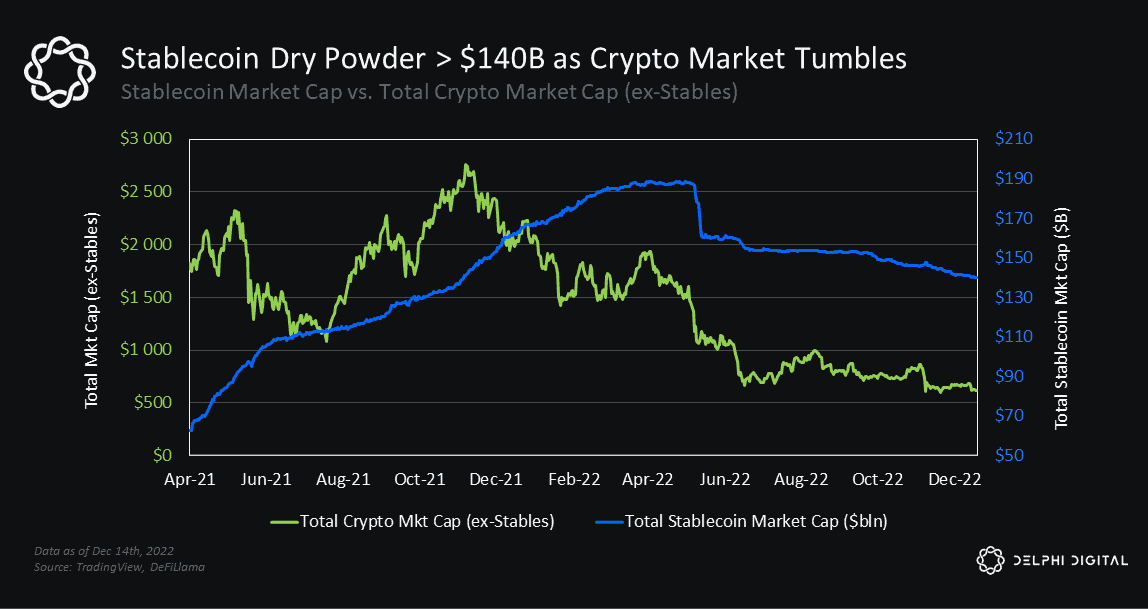
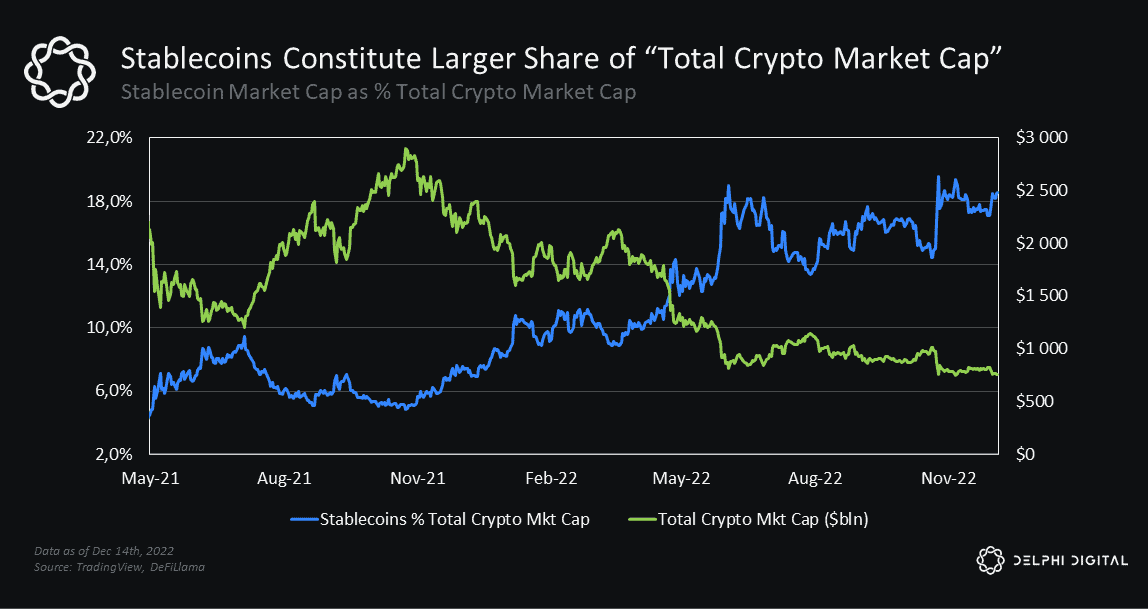
The transition to a risk-off environment has pushed many market participants tostack stables, which has drastically increased their percentage of the totalmarket cap. This represents capital that hasn’t left the crypto economy. Once themarket turns, we’d expect to see some of this dry powder re-enter the market.
Capital flows have a big impact on asset prices throughout global markets andeconomies. As we’ve seen, the decline in funding liquidity can have an adverseimpact on market liquidity too.
Access to liquidity is one of the biggest risks to the crypto industry over the next 3-6 months. Venture capital funding has fallen considerably year-over-year,which is forcing companies big and small to cut costs and headcounts in an effortto ensure their survival. The back half of the year has been challenging for manyteams looking to raise capital for new projects or series funding for existingventures, and conditions will likely get worse before they get better.
Key Theme #2: The Almighty US Dollar
The strong dollar narrative has been a cornerstone theme of ours throughout 2022. In our January report, Why Bitcoin Is Behaving Like It Should, we cited thelikelihood of a strong dollar as a key risk to the crypto market. More specifically,we cautioned that:
Growing expectations for higher rates, coupled with a relatively strongeconomic outlook in the US — at least compared to other regions — have helped breathe new life into the US dollar
A stronger greenback implies tighter monetary conditions, which does littlefavor to assets like BTC that tend to move inversely with the USD
The US dollar is extremely important in determining the direction of globalmarkets, especially assets tethered to a currency debasement narrative
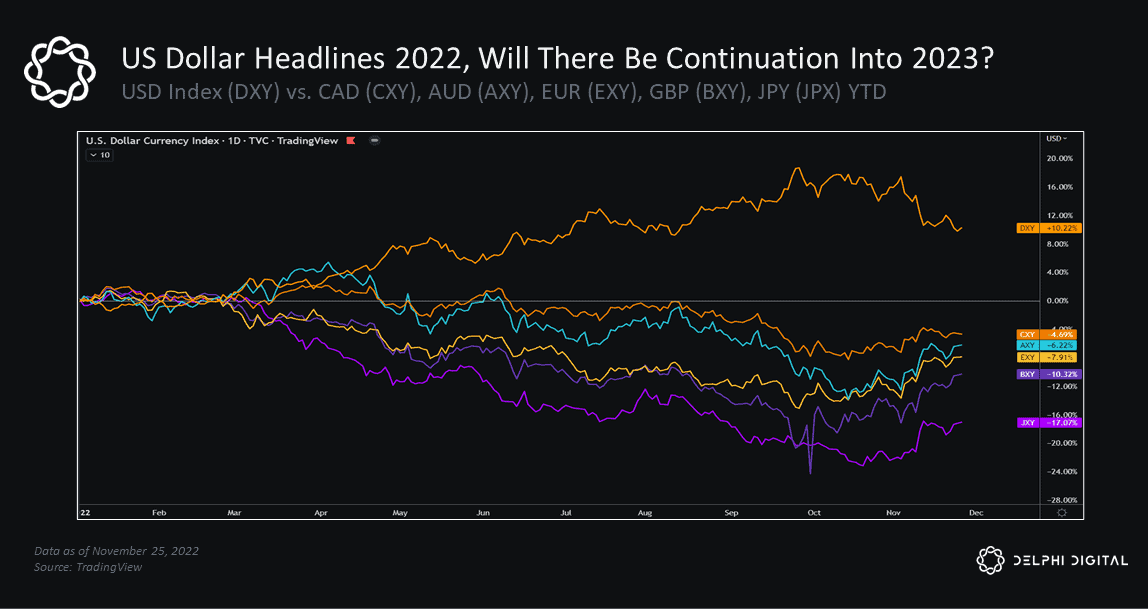
Fast forward a year and we’ve seen the USD strengthen against just about everymajor currency to the detriment of risk assets like crypto. The 15 months leadingup to its late-September peak saw the strongest dollar move we’d seen indecades, so we expected some consolidation after such a rapid rise.
Aggressive monetary tightening, demand for dollars and US safe havens, andthe contraction in global liquidity helped propel the dollar to 20-year highs.
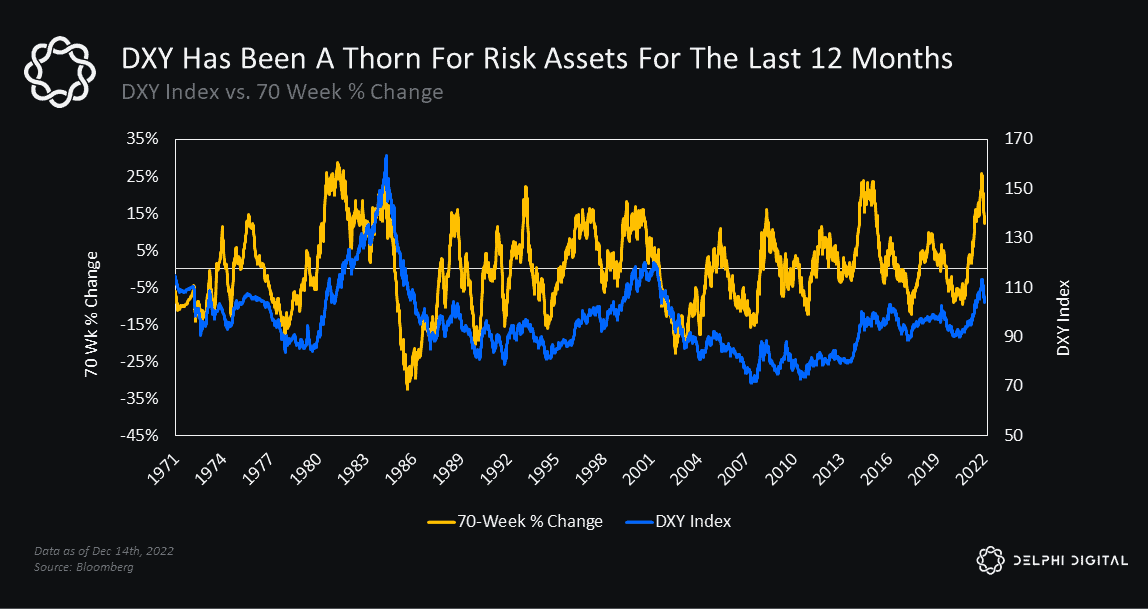
Historically, dollar momentum can continue after a healthy consolidation period.
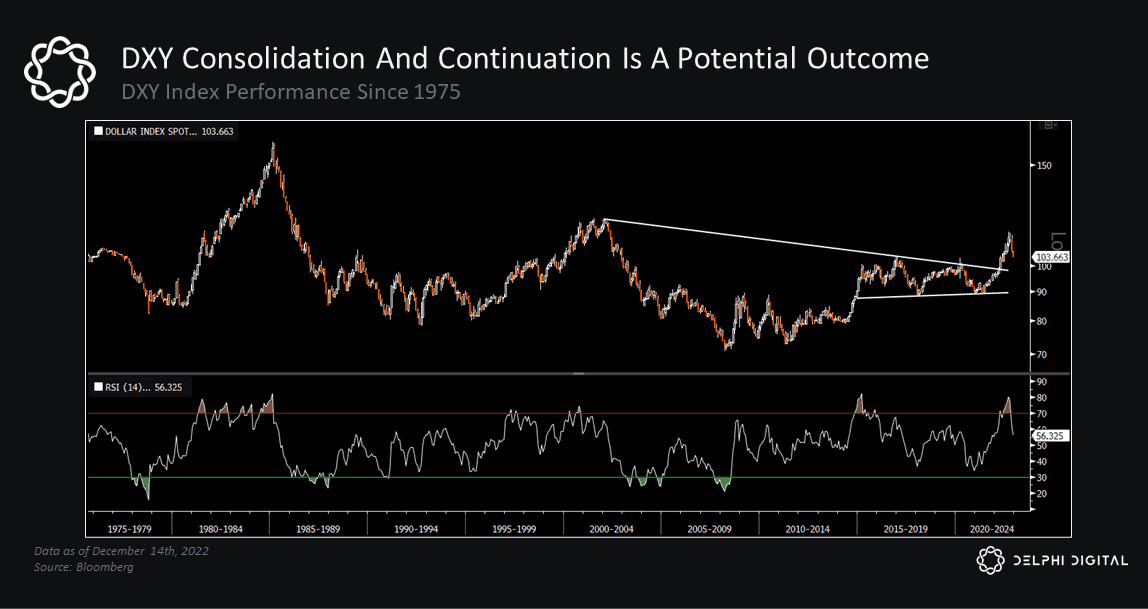
We saw the DXY’s 14-month RSI break above 70 at the end of April for the firsttime since its 2014-2016 run-up. Shortly after, we cited the importance of USDmomentum, specifically how “Similar overbought readings over the last fourdecades led to a stronger dollar ~78% of the time over the following 12 months[with average gains of ~5.7%]…which would put the DXY index just shy of 111…”
The DXY went on to gain another +10% through late September (peaking at 114),but has since fallen back to the same levels we saw in May.
The worldwide fight against surging inflation has prompted a synchronizedtightening of global rates and financial conditions, and the strong dollar continuesto be a big part of that story.
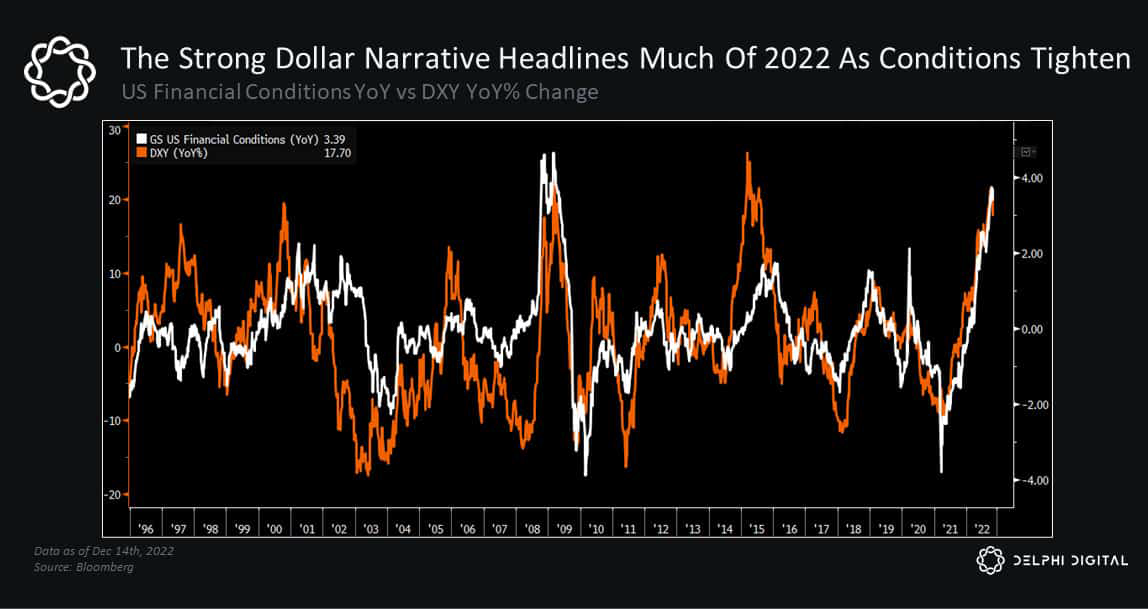
October marked the recent turning point, as peak “tightness” led to somewhateasier financial conditions and the market started repricing future rate hikes asfears shifted from inflation to rising recession risk.
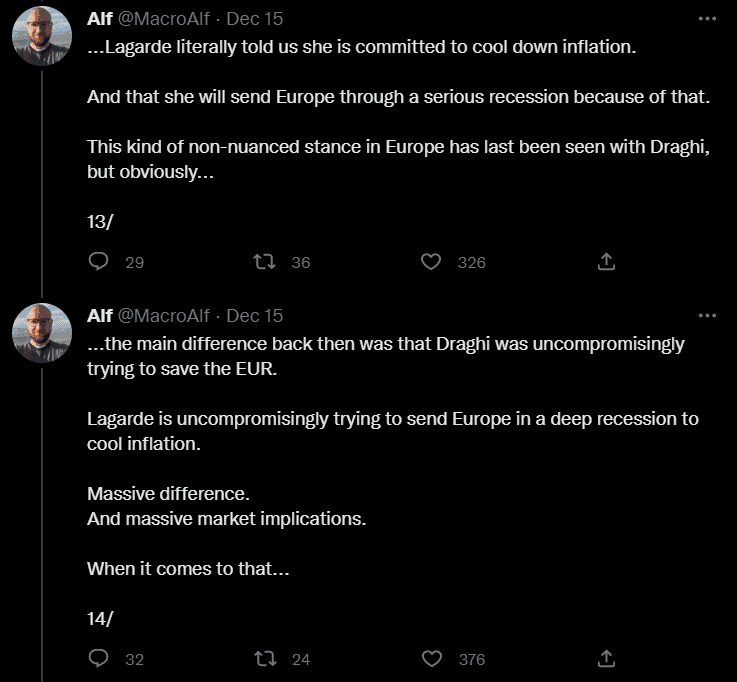
The US led the pack in tightening financial conditions over the last 12 months, butthat’s starting to change as inflation and energy pressures inflict hardship onEurope while the Fed gets closer to its expected terminal rate.
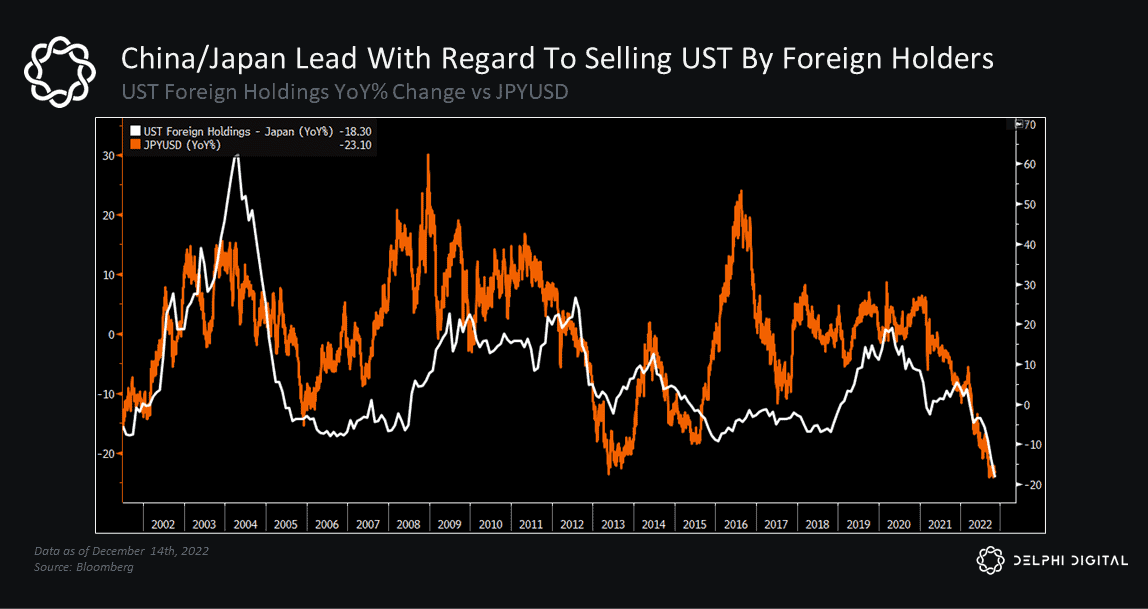
The destructive strength of the US dollar has also forced other countries (both29advanced and developing) to take action, defending their own currencies in theface of major economic headwinds. Foreign CBs have started selling dollarreserves at an accelerated pace, similar to what we saw after the last strong USDrun-up (2015-2017).
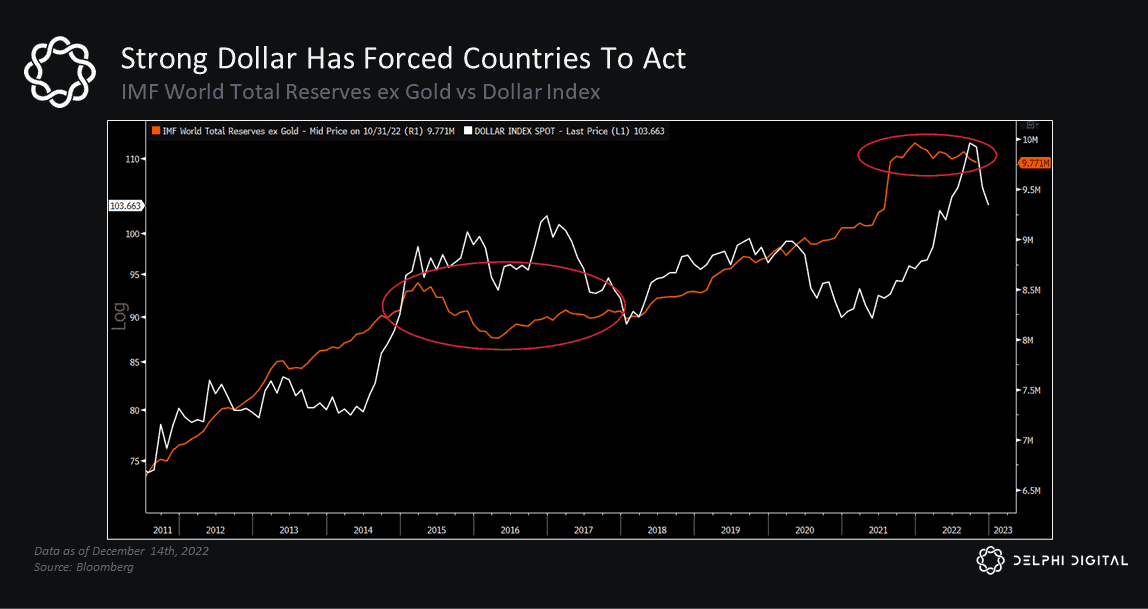
This trend has been led by China and, more recently, Japan (more on this later).
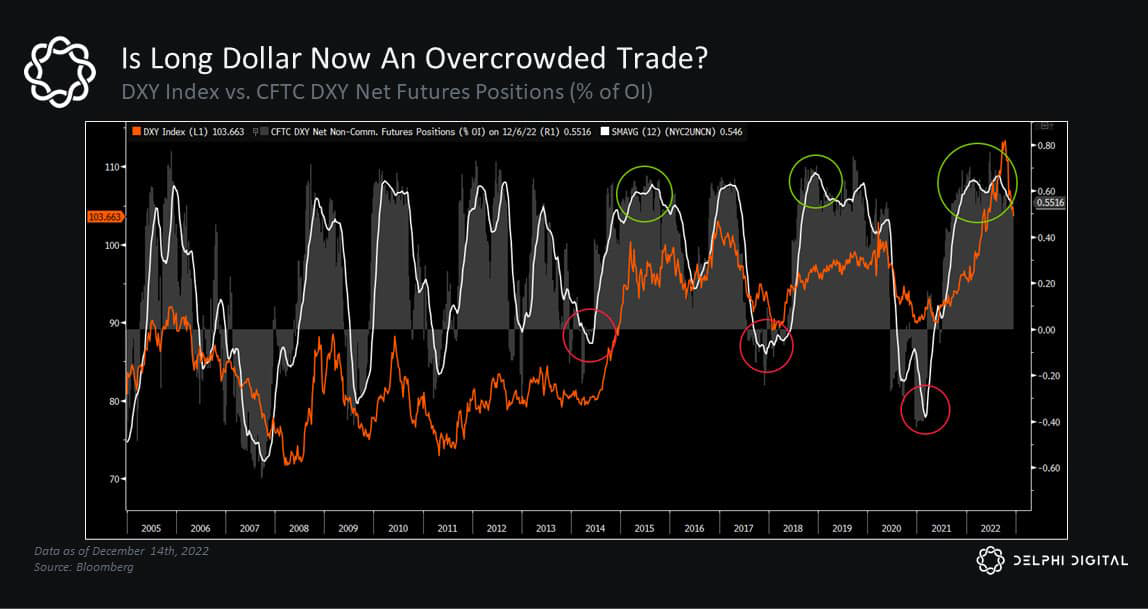
Long dollar is also one of the most overcrowded trades at the moment.
We know global liquidity cycles have an inverse relationship with the dollar. Wealso noted how the business cycle tends to lead changes in liquidity trends, andthe US ISM has been warning of a significant slowdown for months now.
Therefore, if we expect the liquidity cycle to turn (as we’re already seeing earlyevidence of) to combat this weakening growth outlook, then we’d expect tosee a reversal in the USD too.
So, are we out of the woods? Not necessarily. Another wave of dollar strength isstill a key risk as we move into 2023. It is important to acknowledge that the Fedremains steadfast in their fight against inflation, and we know through historicalprecedent that the latter stages of inflation can be sticky, especially if wagegrowth remains strong.
The dollar’s run-up has already caused a lot of destruction, but the US still lookslike the “cleanest shirt in the laundry” to many. If capital flows to the US in searchof safety against weakening growth prospects elsewhere — like the eurozone —we could see another dollar rally. Demand for dollars remains high, and dollarliquidity constraints only add more fuel to the fire.
If we get another period of dollar strength, it’d likely mark the end of the latestrelief rally. The size and speed of USD fluctuations is critical too. If the USDappreciates too much too fast, the potential for major currency depreciation anddebt issues becomes increasingly high — with cracks already emerging in both.Dollar-denominated debt outside the US has grown considerably over the last 15years, and another leg higher would tighten global financial conditions evenfurther.
Periods of extreme stress often lead to unforeseen breakdowns in financialmarkets, something crypto participants know all too well at this point.
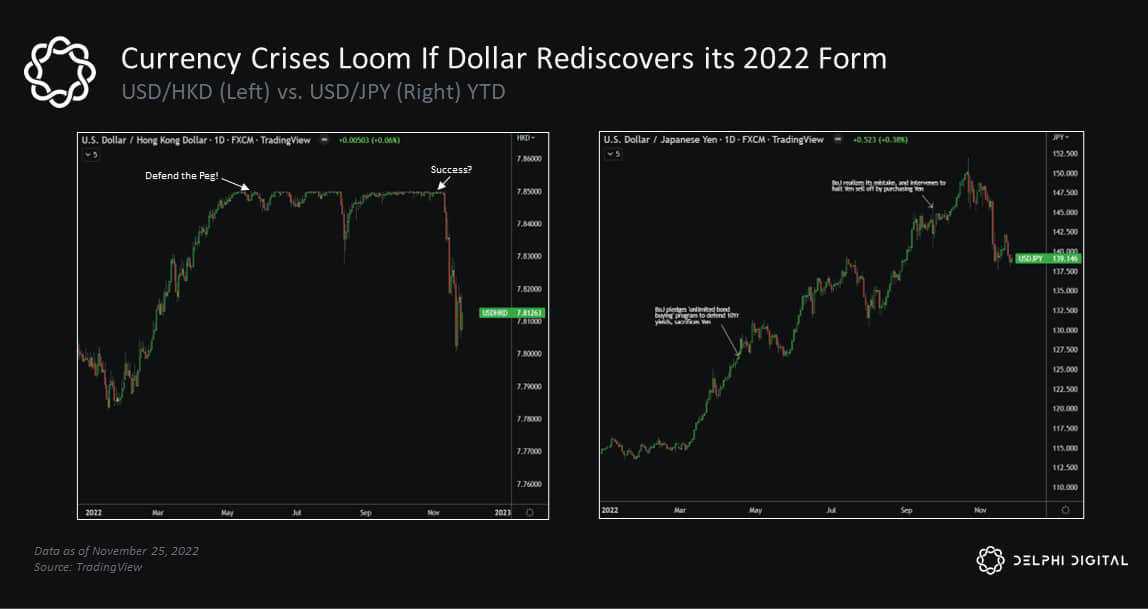
A couple of interesting examples where this stress could manifest are the HongKong dollar peg (HKD, above left) and the Japanese yen/JGB market (aboveright). The above charts are prominent examples of potential cracks in globalcurrency and sovereign debt markets, and ones that could be strained if we seeanother period of consistent USD strength. The debacle in the UK gilt market isanother example that’s lingering in the minds of US officials.
It’s important to note that betting on an HKD depeg has been an infamous“widowmaker” trade over the last 15 years. Also, as this was going to print, the BOJannounced an increase in the yield cap on 10yr JGBs. This sparked a jump in theyen and a new wave of hawkish concerns, as many believe this opens the door fora tighter monetary regime after Japan’s seemingly steadfast dovish stance.
Once again, global liquidity trends have a lot of influence on where we go fromhere. The fragility of sovereign bond markets may inhibit the Fed’s QT plans,bringing with it a weaker dollar and some much needed relief to markets that’velost their luster this year. If policymakers can avoid an outcome in which the dollarremains a strong, consistent threat, then risk assets stand to benefitconsiderably.