Introduction
Following the network’s upgrade on September 15th, Ethereum switched from a proof-of-work (PoW) to a proof-of-stake (PoS) consensus mechanism, enabling the network to reduce its carbon footprint by 99.95%.
This also implies that Ethereum’s daily token supply has decreased since the merge, and the ultrasound money appears to be taking life.
This article will look at the supply and demand dynamics of the new PoS Ethereum network, as well as the realities of it being deflationary.
Pre-Merge
There has been much speculation about Ethereum becoming deflationary following the merge, and now we will be able to examine the data to see what has actually occurred since the merge.
As the developers were working on the Ethereum network’s scheduled merge upgrade for September, many analysts were looking at past information in order to predict Ethereum’s tokens activity after the network’s upgrade.
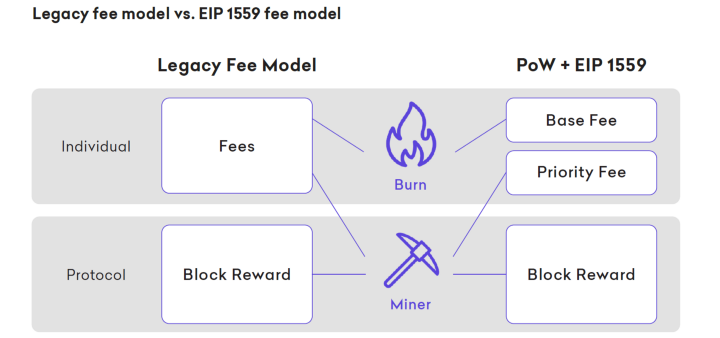
Given Ethereum’s other major upgrade in August 2021, the EIP-1559, which required the network to burn any Ether tokens used to pay base fees, lowering total supply, many projected that ETH token net issuance would be between -0.5% and -4.5%, depending on network fees, making Ethereum deflationary.
Kraken intelligence — ConsenSys
Read this article for further information on what was anticipated of Ethereum’s network pre-merge:
Ethereum 2.0 — What to Expect?
Introduction
medium.com
Post-Merge: Is Ethereum Now Deflationary?
One of the most spectacular accomplishments of engineering in the blockchain sector was the successful implementation of Ethereum’s move from PoW to PoS consensus mechanism, which had been in the works for many years.
Since PoS works in differently than PoW, we’re going to explore and understand supply dynamics using on chain metrics. This will include analysis of validators, ETH token issuance and the effects of EIP-1559 burn mechanism.
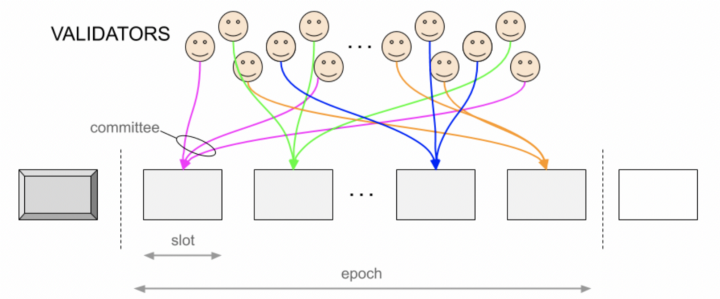
Understanding Proof-of-Stake Ethereum — Slots, Blocks & Epochs
kb.beaconcha.in
In the Ethereum PoS consensus mechanism, miners are replaced by validators and block production and validation goes through the following.
The Ethereum PoS blockchain is constructed from a series of slots, which occur at an average interval of 12 seconds. Each slot represents an opportunity for a validator to build and propose a block. Each slot may or may not have a block in it.
Each sequential set of 32 slots are grouped into an epoch. A set of 128 validators are selected by the protocol to form a committee for each epoch. Only one validator of this committee is algorithmically chosen to propose a block in the upcoming slot.
The remaining validators in the committee provide attestations that the proposed block and included transactions follow the consensus rules. Epochs are then systematically finalized by two-thirds of the validator network.
Validators
The Ethereum PoS protocol allows for the movement of validators both into and out of the validating network. On both entrance and exit, there is a queue system which regulates the number of validators to assure smooth network operation, with the churn limit per Epoch.
Consider below:
glassnode
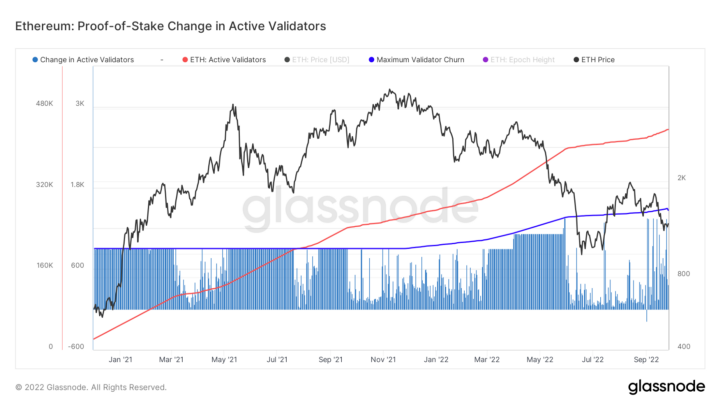
As per the chart above, active validators have been increasing for most of the Beacon chain’s history.
The Beacon Chain, which was launched in December 2020, is the coordination mechanism of the new PoS network, responsible for creating new blocks, making sure those new blocks are valid, and rewarding validators with ETH for keeping the network secure.
The blue line indicates the network’s enforced cap, or churn limit, which rises as more validators join the network. There’s been periods with major bursts of new validators, such as May 21 — July 21, September 21 and May 22.
On the other hand, there are validators leaving the network, whether voluntary or due to slashing in the event of malicious behaviour. See chart below:
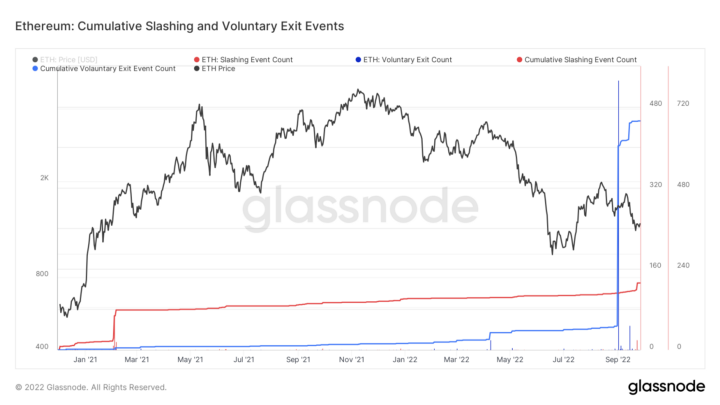
glassnode
To date there’d been 678 voluntary exits and 198 slashing events.
The chart above illustrate that there has been a relatively small number of validators leaving the network and a continual increase in the number of validators joining the network. Despite a protracted crypto winter and an uncertain macroeconomic situation, this suggests an overwhelming faith and conviction in the future of the Ethereum network, a powerful positive indicator.
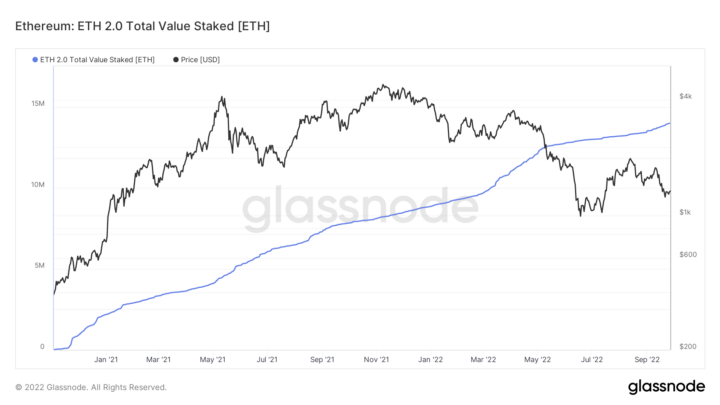
Validator Staked Balance
As validators enter the network they must deposit at least 32 ETH each. The total value staked reflects the sum of all staked deposits, see below.
glassnode
As of now, the total amount of ETH deposited in the network is 13.9 million. We can also observe a steady increase in deposited Ether. It should be noted that deposited Ethereum cannot be withdrawn until the Shanghai upgrade, which is scheduled for early 2023. Another encouraging sign indicating a high level of confidence in the Ethereum network’s future.
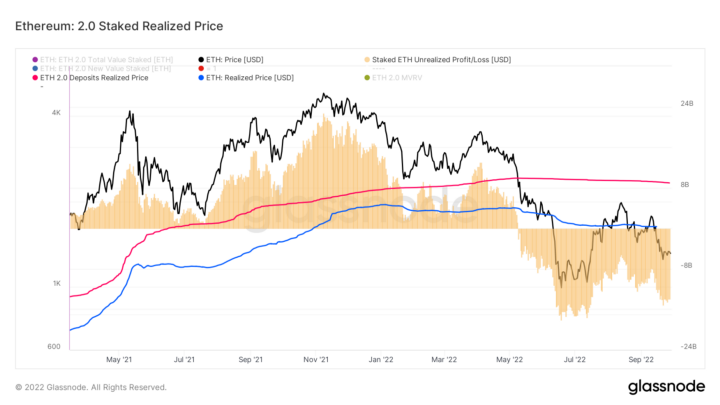
Validator’s Losses
Investors would have deposited ETH to the Beacon Chain staking contract at an average price for their staked deposits, commonly known as the realized price. See the chart below:
glassnode
The red curve shows the average price for staked deposits, which is currently at $2,326, which is fairly lower from today’s average trading price of $1,300 per ETH, meaning that there is a substantial unrealized loss incurred by the validators. This can further be seen on the yellow chart, which indicates an amount of unrealized loss, which currently stands at $13.9 billion.
This may give an indication of what could happen when ETH deposits become accessible for withdrawal in 2023. If unrealized losses continue to build but validator count rises and sell-off remains small, this would imply continued confidence for the network, its utility, adoption, and strong belief in Ethereum’s future potential. Since the blockchain industry is rapidly expanding and worldwide adoption is still in its early stages, network participants’ confidence is critical.
Supply Dynamics
To determine and evaluate the utility of Ether, let us first analyze the current ETH supply concentration across the network. The more the utility, the greater the demand for Ether, boosting buying pressure, making the network more deflationary, and reducing the capital flight risk during the times of uncertainty.
This graph shows an area chart perspective of these high concentrations of ETH supply for comparative purposes. Supply areas are represented as a proportion of circulating supply.
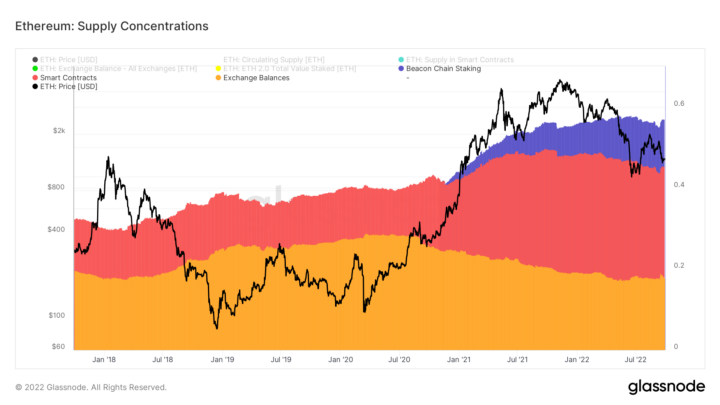
glassnode
The orange area represents supply held on exchanges, the red area represents supply in smart contracts, and the purple area represents staked supply held in the beacon chain by the validators.
As we can see, the majority of supply is stored in smart contracts, implying that the majority of ETH is being utilized, generating revenue in network fees and paying validators. On the back of bolstering Ethereum smart contract ecosystem, the ETH locked by the validators are growing meaningfully, further reducing the Ether supply. In this context Ethereum is largely being utilized by the network, whether for smart contracts or network security.
Ethereum’s ETH Issuance
Ethereum’s PoS estimated annual issuance is the function of a validator count. This means that as more validators are staking the Ether issuance increases.
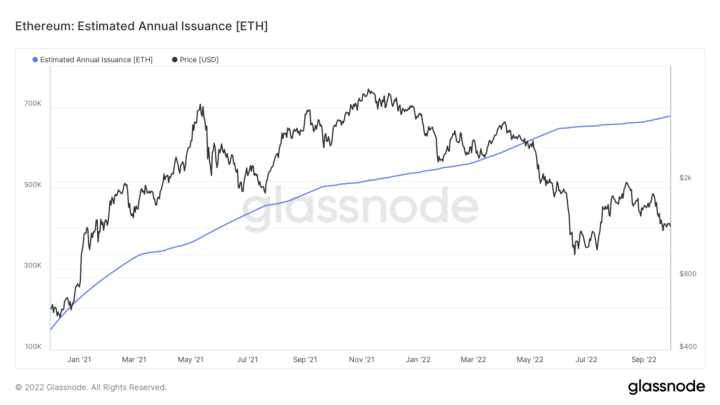
glassnode
This chart above indicates an estimated total ETH issuance continues to climb. Since Jan 22 the amount of ETH minted per year has increased from 227k ETH to 675k ETH today. This will continue to increase as more validators join the network.
Since higher issuance of ETH is not helpful to network becoming deflationary, there is a yield curve, or rewards validators earn on their deposited ETH, which declines as the count increases. See the chart below:
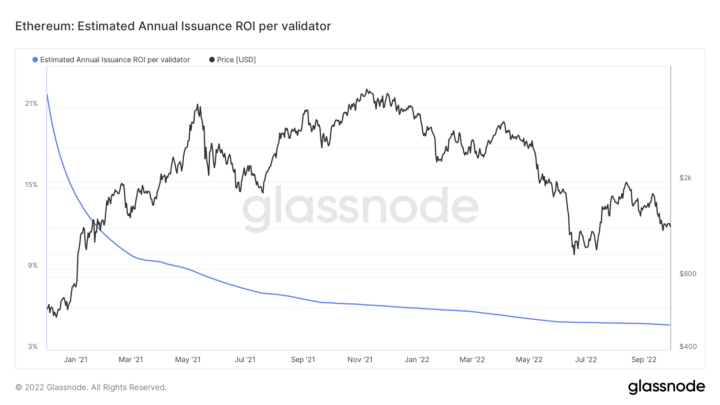
glassnode
The chart above reflects the ETH denominated annual return (%) on a 32-ETH stake validator. The larger the validator count, the lower the yield, which in turn reduces numbers of validators joining, flattening the curve line, and reducing ETH issuance. Currently the yield is at 4.8%, down from 14% in Jan 22, and will likely go down further to a range of 2–3%, and at that stage it’s unlikely more validators will join the network.
With all of the above, we can evaluate the nominal inflation rate and determine if the network is deflationary by incorporating the EIP-1559 burn mechanism.
Ethereum Inflation Rate
Consider the chart below, which illustrates how much Ether supply is being created and issued onto the market.
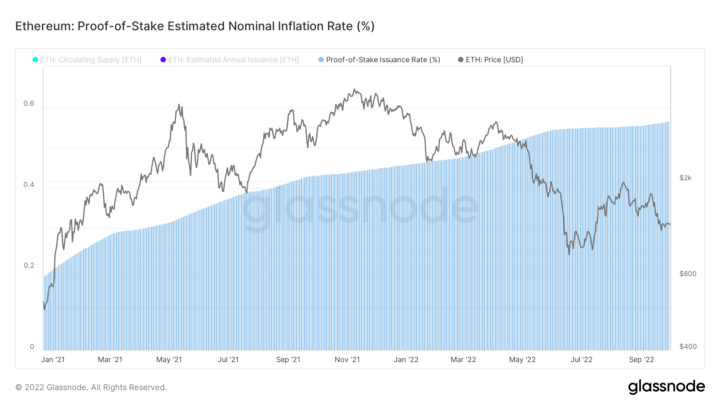
glassnode
The current issuance rate (minted supply) is 0.56%, which is much lower than the 4% in ETH issuance before Ethereum migrated from the PoW consensus mechanism. This will continue to rise as long as the validator count rises, which may be until the Shanghai upgrade, after which this may start declining due to the implementation of staked ETH withdrawals. Consider the difference below as shown by the chart:
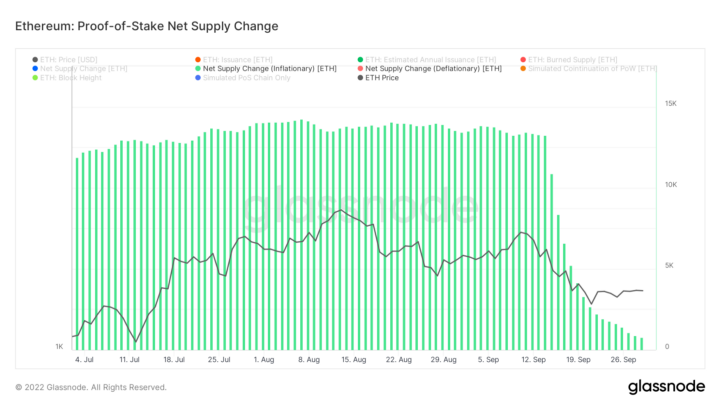
glassnode
As we can see when the merge was executed on September 15, 2022, the daily ETH issuance has dropped from an average of around 13k ETH per day to an average of 800 ETH per day.
EIP-1559 Burn
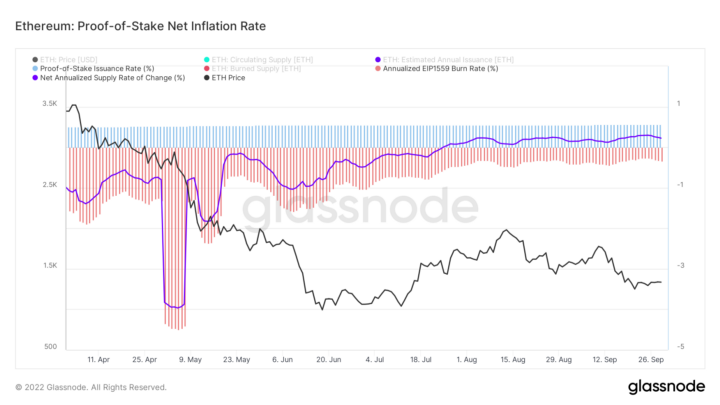
Let’s now add Ethereum token burning (EIP-1559) to the mix.
glassnode
Consider the chart above which shows the EIP-1559 burn cycle from April 22 up until today. The chart simulates PoS model only and excludes any token issuance under the old PoW model. This simulation will help us to determine EIP-1559’s role and evaluate its full impact on what it would take to make Ethereum a deflationary network.
In blue we can see the nominal issuance rate under PoS and in the red area we can see the EIP-1559 burn rate applied. If merge would have went live on April 22, the purple curve would indicate that Ethereum would have been deflationary through most of the crypto bull market.
Since July 25, the purple curve moved into a blue territory, meaning the burn is less than PoS issuance, making network inflationary once again. As we can see Ethereum is currently in an inflationary regime.
To address the point, post-merge Ethereum is inflationary, but it wouldn’t take much to shift the network into deflationary zone, i.e. a gas fee of 15 gwei. Given that Ethereum has averaged approximately 10 gwei over the last month, the network will be highly deflationary over the next bull run. This will be boosted further as adoption grows over time.
Summary
Ethereum has the potential to become an ultrasound money, as it was termed previously. As of now, Ethereum continues to dominate the DeFi, accounting for 57.58% of total value in its ecosystem.
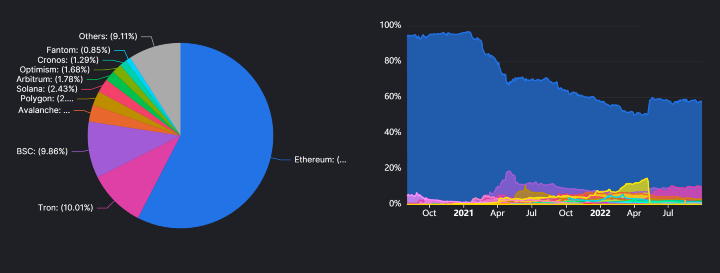
defillama.com
Furthermore, over 65% of all volume on the decentralized exchanges occurs on the Ethereum network.
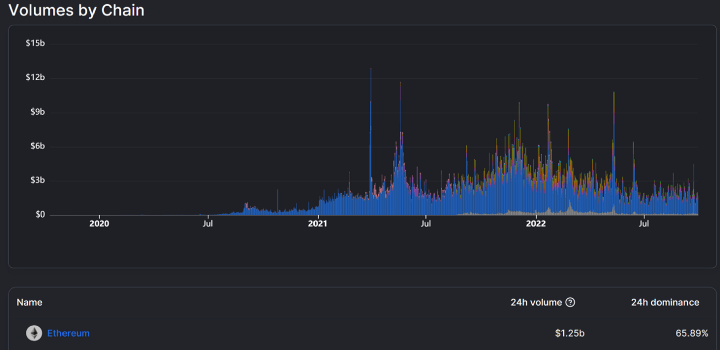
defillama.com
Since the merge, Ethereum still remains as the top network generating most of the fees.
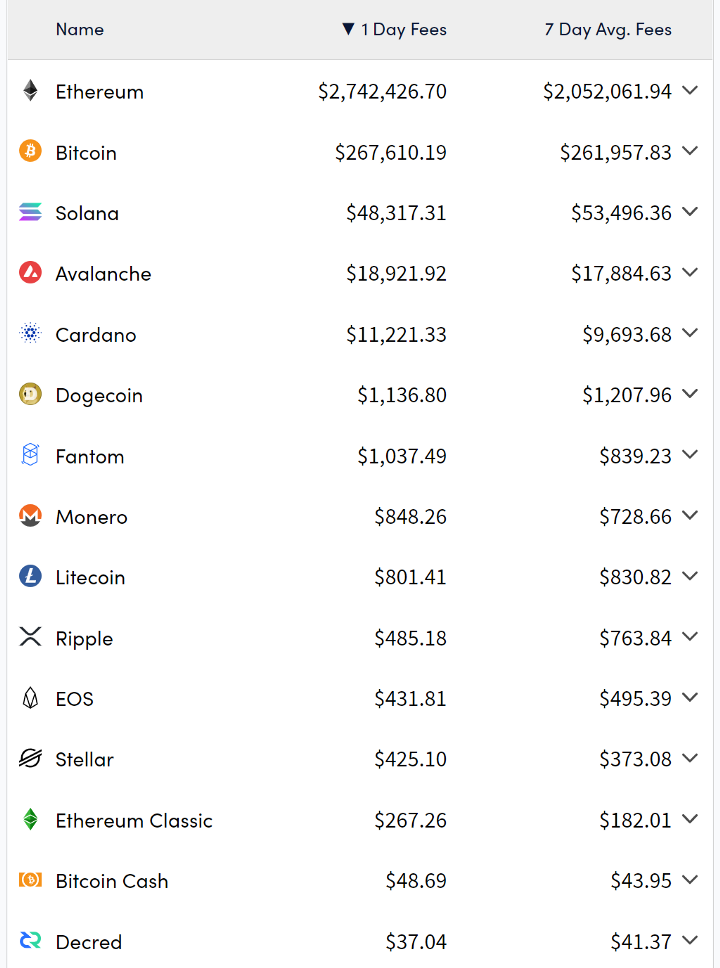
cryptofees.info
As of today, considering the data above, Ethereum is the dominant smart contract chain and despite many competitors in the space, such as Cardano, Avalanche, Solana and several others, the users still largely use Ethereum.
Ethereum is planning to implement further network upgrades. Vitalik Buterin, the Ethereum co-founder shared his vision for future developments well beyond the network’s move to PoS. On of the next major upgrades will be sharding, a scaling solution which the Ethereum Foundation claims will further enable cheap layer-2 blockchains, lower the cost of rollups or bundled transactions, and make it easier for users to operate nodes that secure the Ethereum network. With this upgrade Ethereum will be able to process 100,000 transactions a second, making it considerably faster than VISA.
Ethereum’s adoption is likely to grow, especially if Ethereum does become a network of choice for CBDCs (Central Bank Digital Currencies). Currently, at least two nation states are implementing their pilot programs on top of Ethereum network. The Reserve Bank of Australia is conducting the pilot in cooperation with the Digital Finance Cooperative Research Centre (DFCRC). The DFCRC will develop and install the eAUD (Australian dollar) platform as a private, permissioned Ethereum (Quorum) implementation. The eAUD ledger will operate as a centralized platform, under the management and oversight of the RBA.
Norwegian central bank also tapped up Ethereum for its CBDC. Norway’s central bank has made the source code for its CBDC sandbox publicly available and confirmed that the prototype infrastructure for the project is based on Ethereum technology. The open source code has been made available on GitHub, allowing for the testing of basic token management use cases, including minting, burning and transferring Ethereum’s ERC-20 tokens.
The Bank for International Settlements (BIS) and the central banks of Israel, Norway and Sweden have announced that they are launching ‘Project Icebreaker’, a joint exploration of how central bank digital currencies (CBDCs) can be used for international retail and remittance payments. The BIS is an association of 61 central banks from around the world and has innovation hubs set up in multiple locations focused on exploring the applications of new financial technologies including CBDCs, which are digital versions of countries’ sovereign currencies.
It’s possible that with the success of CBDC pilot programs on Ethereum, it could become the go-to smart chain for several major central banks. It will then be a force to be reckoned with.