Author: Nancy, PANews
Reversing the downtrend at the end of June, the crypto market has recently experienced a noticeable rebound. Led by Bitcoin, mainstream crypto assets have quickly recouped previous losses, and multiple on-chain indicators have successively released signs of a bottom, adding optimistic expectations for future market trends.
However, while the market is showing signs of warming up, issues such as insufficient spot demand, institutional capital waiting on the sidelines, and continued pressure on altcoins still bring uncertainty to the subsequent market movement.
Has the July Rebound Arrived? Crypto Market Sees Collective Minor Rally
Historical patterns show that July is typically the strongest performing month of the summer for the crypto market. After entering July, the market is welcoming a rebound, with crypto assets recovering across the board and regaining upward momentum.
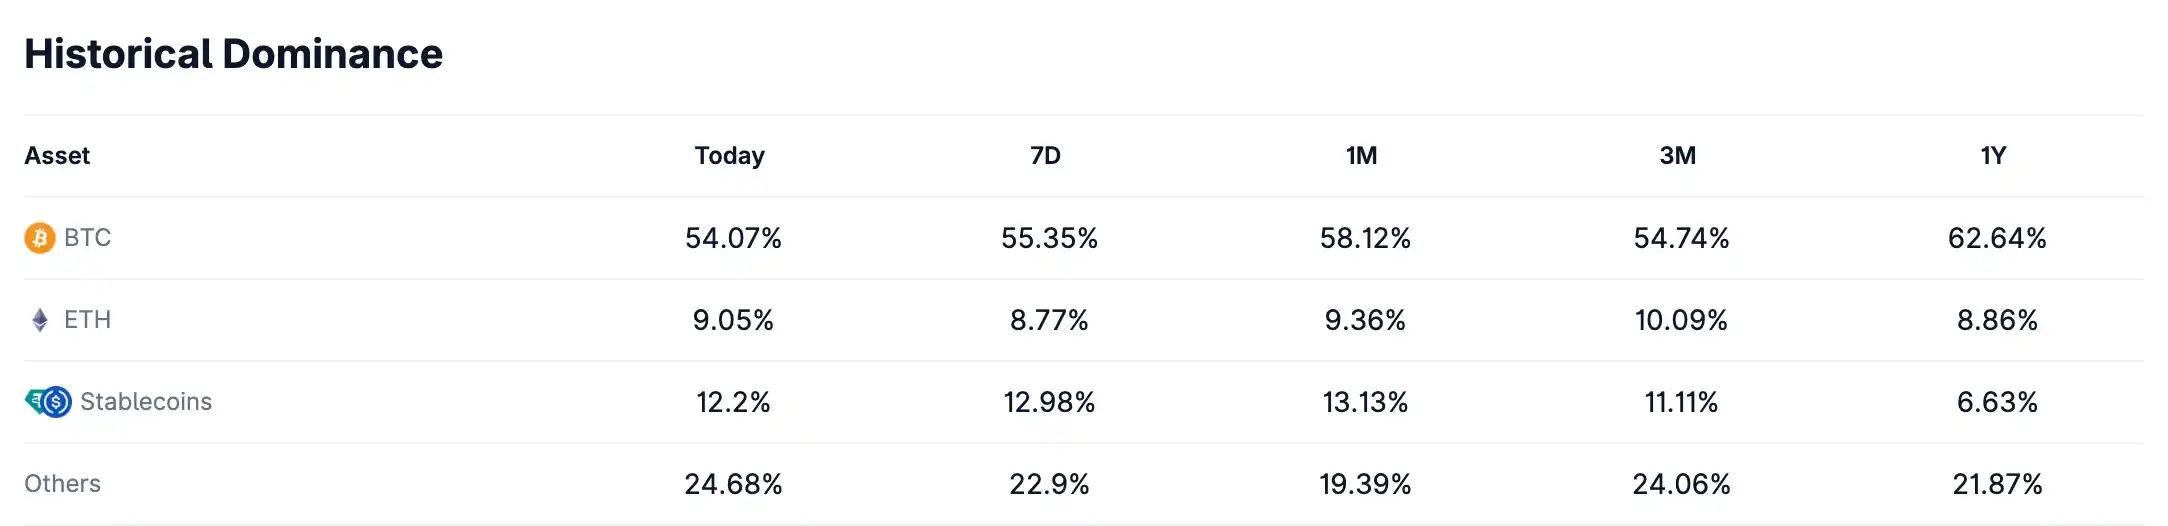
CoinGecko data shows the total crypto market capitalization has rebounded from a recent stage low of $2.1 trillion to the current $2.28 trillion. Among them, Bitcoin has rebounded strongly, climbing back above $63,000 to hit a two-week high, reclaiming all losses from the end of June; Ethereum continued its upward trend, gaining 12.9% weekly, with its market dominance recovering to 9.05%; the altcoin market (excluding stablecoins) also saw a clear recovery, with its market dominance rising from 19.39% a month ago to 24.68%.
It is worth mentioning that, driven by celebrity tokens like ANSEM, CZ, and TCC, the MEME coin sector on Solana and BNB Chain has shown recovery recently, with on-chain transaction volume and active address counts rising significantly.
This minor rebound is primarily driven by multiple factors including improved macro expectations, capital inflows, and a short squeeze in the derivatives market.
The macro level served as an important catalyst. The US June non-farm payrolls data was significantly lower than expected, adding only 57,000 jobs, far below market expectations. The labor force participation rate fell to a new low in over five years, leading to a marked cooling of market expectations for a Fed rate hike in September. At the same time, the new Federal Reserve Chair Wash released slightly dovish signals, further dampening speculation of rate hikes within the year. With liquidity expectations improving, capital is flowing back into assets like crypto and gold, with risk appetite significantly warming.
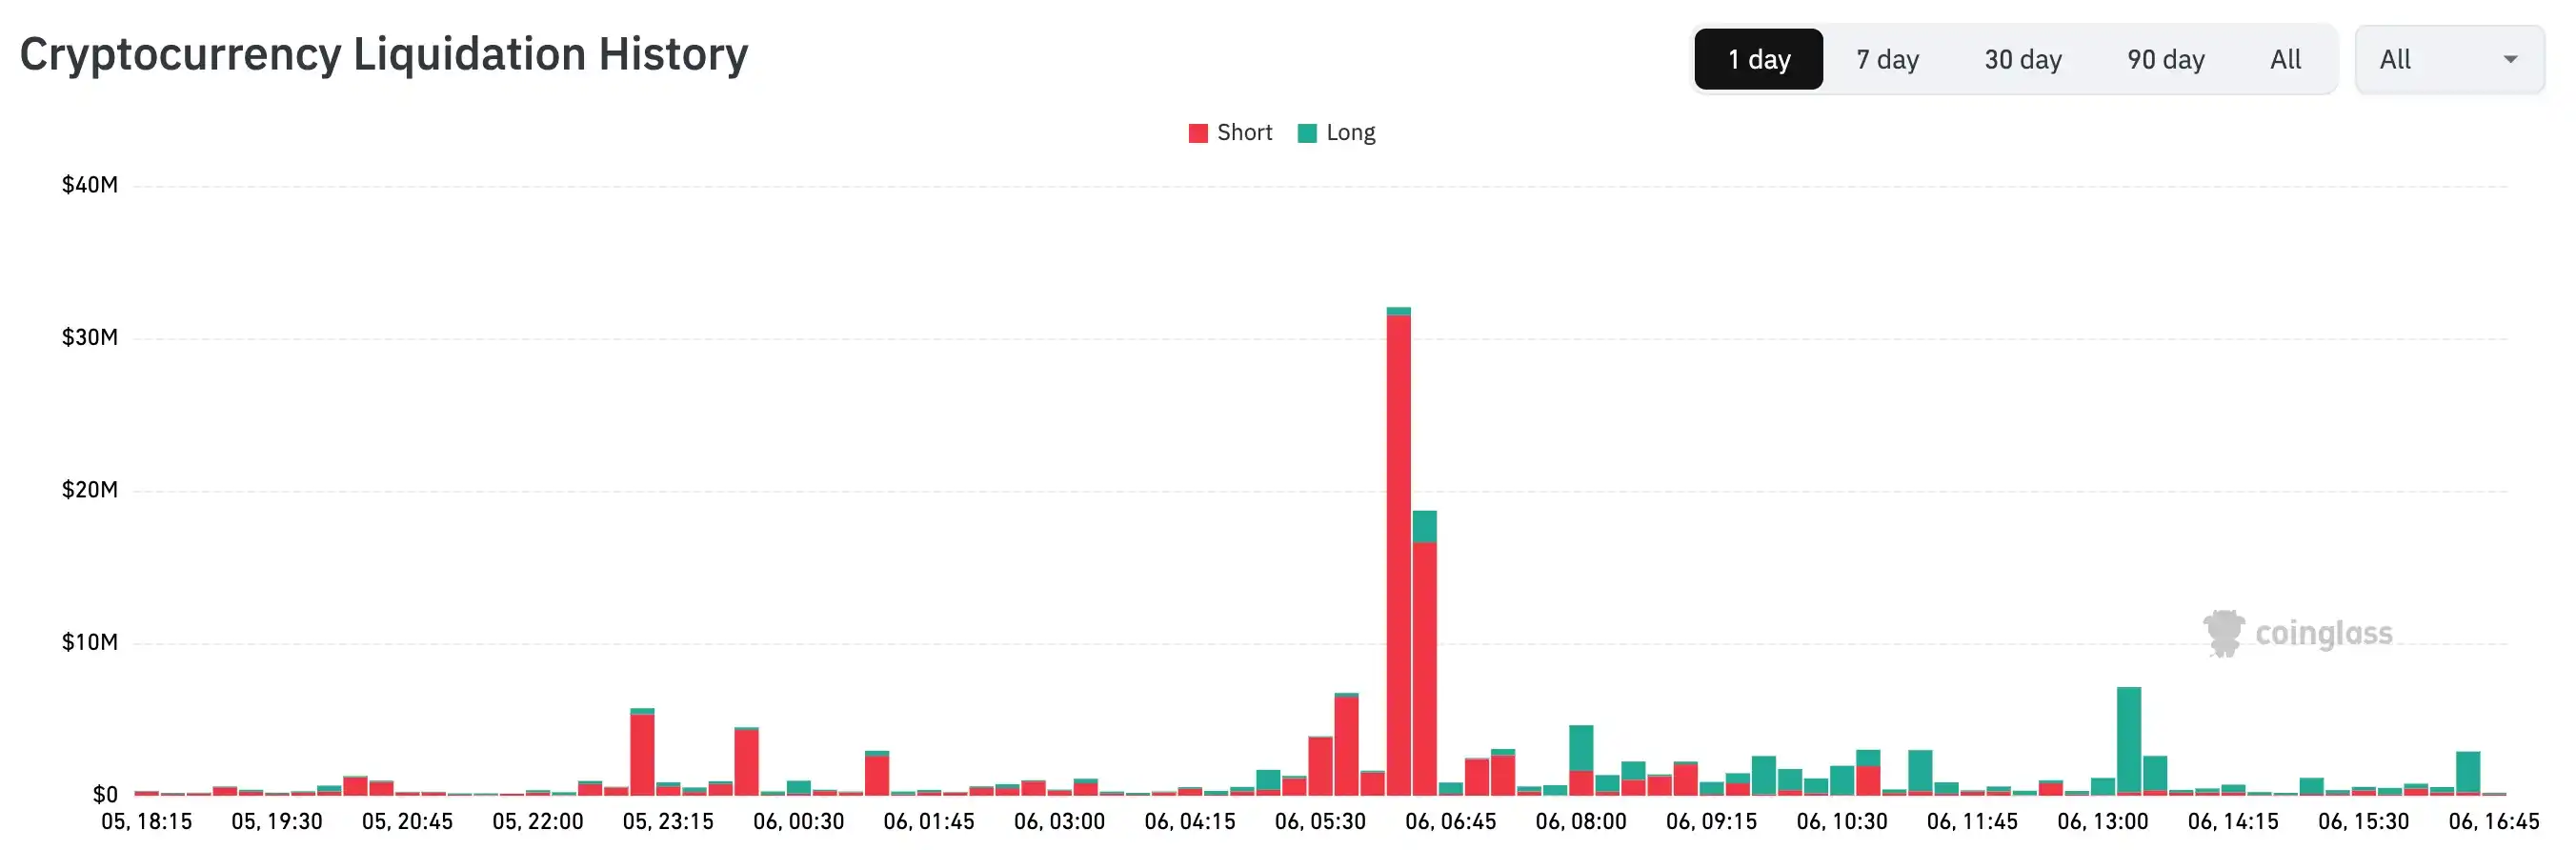
The derivatives market further amplified this rebound. As Bitcoin quickly broke through resistance levels, a large number of short positions were forced to close, with the short squeeze pushing prices further up. Taking data from July 6th as an example, Coinglass data shows that the total amount of short liquidations across the network exceeded $92.04 million, far higher than the $40.71 million in long liquidations.
The capital level also released positive signals. US spot Bitcoin ETFs ended a 10-day streak of net outflows, with a single-day net inflow of approximately $220 million on July 2nd. Meanwhile, Bitcoin whales continued to buy at lower levels. According to Bitfinex analysts, wallets holding over 1,000 BTC increased their holdings against the trend during the market sell-off, accumulating over 270,000 BTC (approx. $16.7 billion) in the past two weeks. Their holdings have rebounded to highs seen over the past six months.
Multiple Bottom Indicators Flash, But Still Face Tests of Sentiment and Capital
Despite multiple on-chain indicators frequently releasing bottom signals, the overall crypto market has not yet shaken off the pessimistic atmosphere, with sentiment and capital flow showing no substantial improvement.
Currently, crypto market sentiment remains at historically low levels. Looking at the Crypto Fear & Greed Index, the current reading is only 23, still in the "Extreme Fear" zone. The 7-day and 30-day moving averages are 18 and 16, respectively.
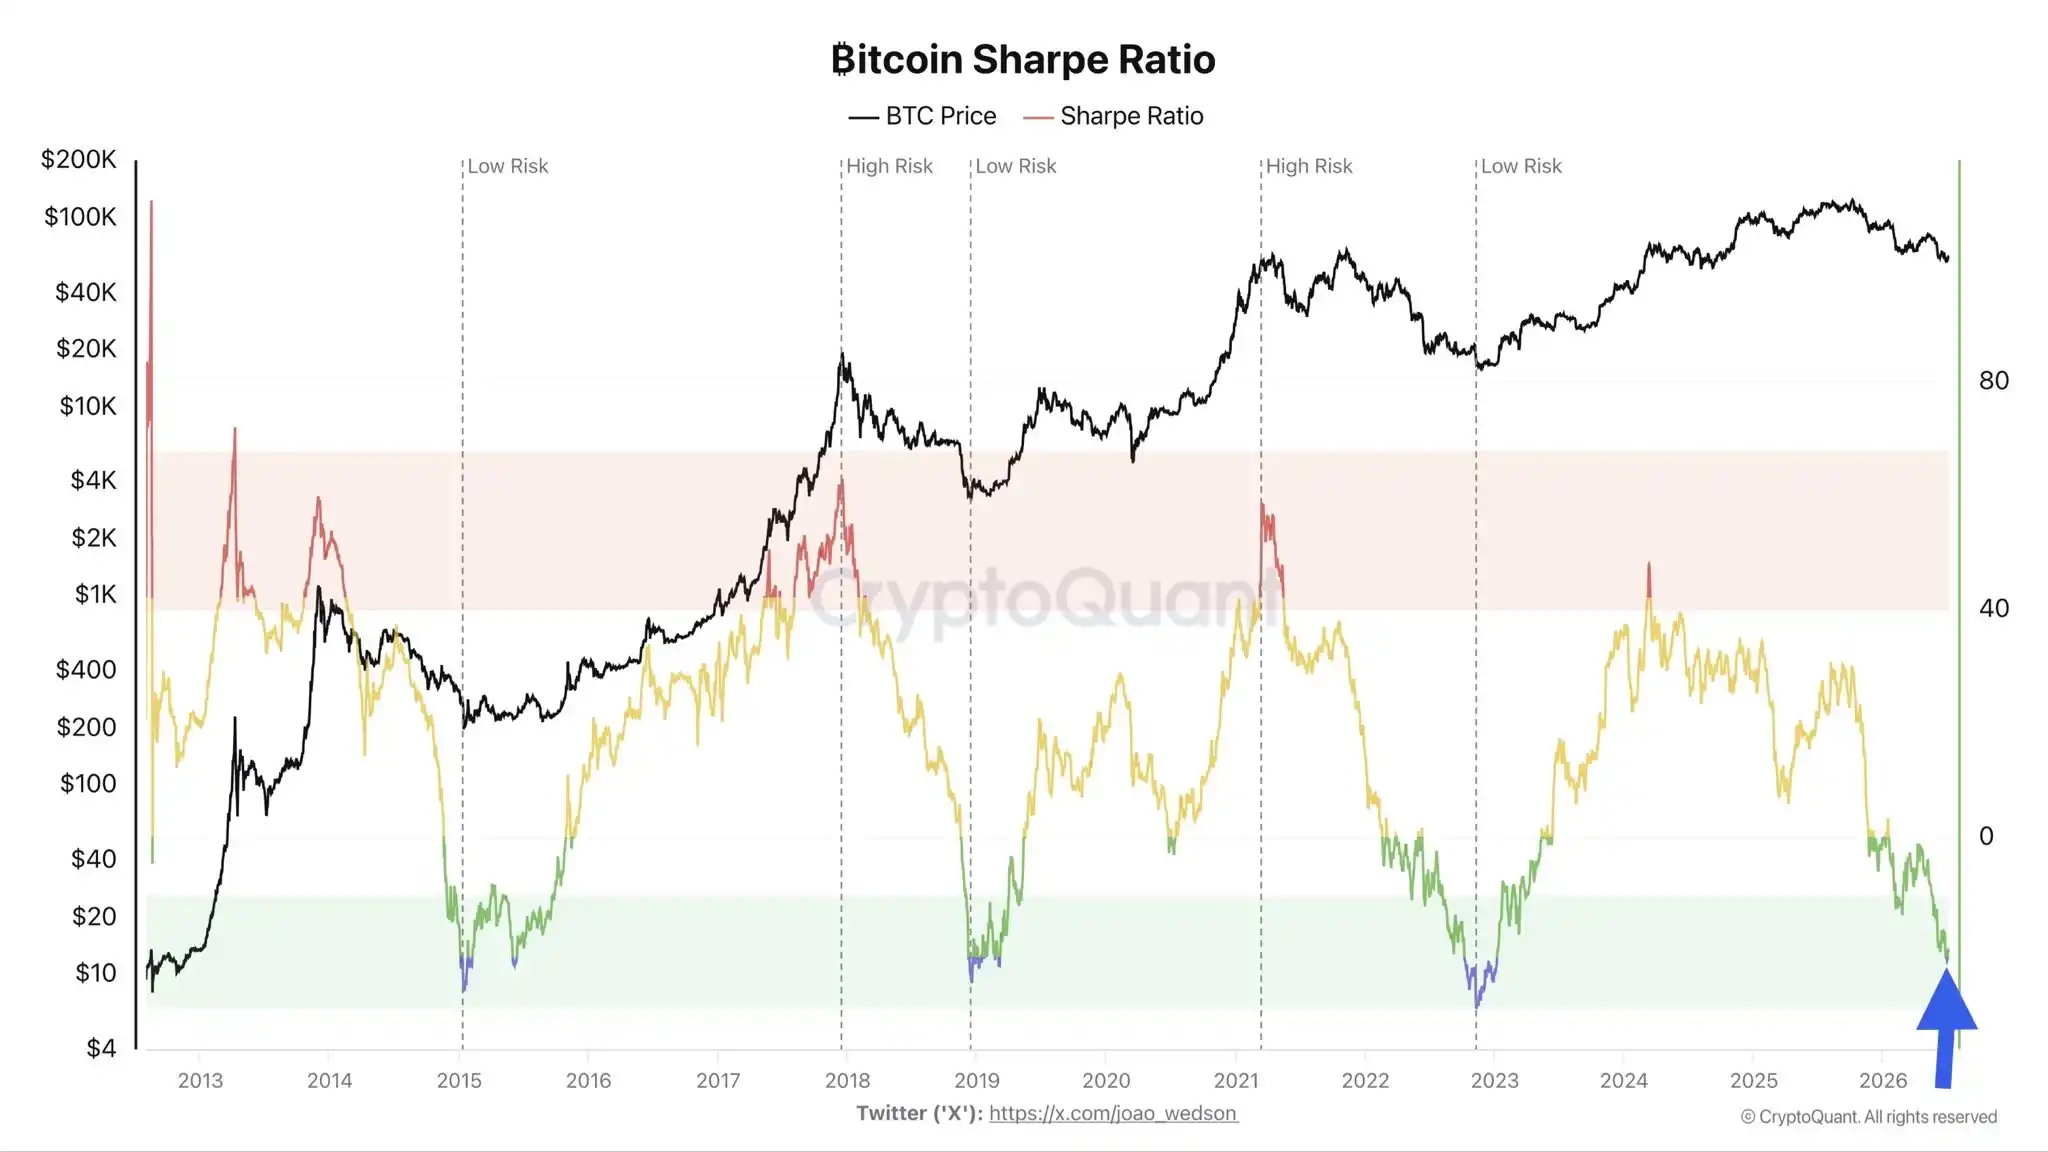
On-chain risk-reward indicators also reflect continued low investor sentiment. CryptoQuant analyst Darkfost points out that Bitcoin's Sharpe Ratio recently fell below -20 again. Although it has slightly recovered since then, historical experience shows that this level typically only appears during periods of extreme market pessimism. The Sharpe Ratio measures the return per unit of risk. Falling into negative territory means the risk investors are taking exceeds the reward obtained. Similar extreme pessimism phases often last for weeks or even months, accompanied by the market repeatedly finding a bottom.
Currently, active Bitcoin investors are still generally at a loss. Darkfost analyzes that the AVIV (Active Value/Investor Value) Ratio is currently hovering around 0.8, meaning active Bitcoin investors as a whole are floating at an average loss of about 20%. Compared to the extreme levels of 0.5 to 0.6 during previous bear market bottoms (corresponding to investor losses of 40%-50%), the current overall investor loss level has not reached extreme bear market levels. This means that while the market has entered a value zone, there is still some distance from a typical bear market bottom. However, he also emphasizes that Bitcoin still follows its own cycle rules, and a short-term rebound may not require waiting for all indicators to hit historical extremes, but the pressure environment created by widespread unrealized losses must be acknowledged.
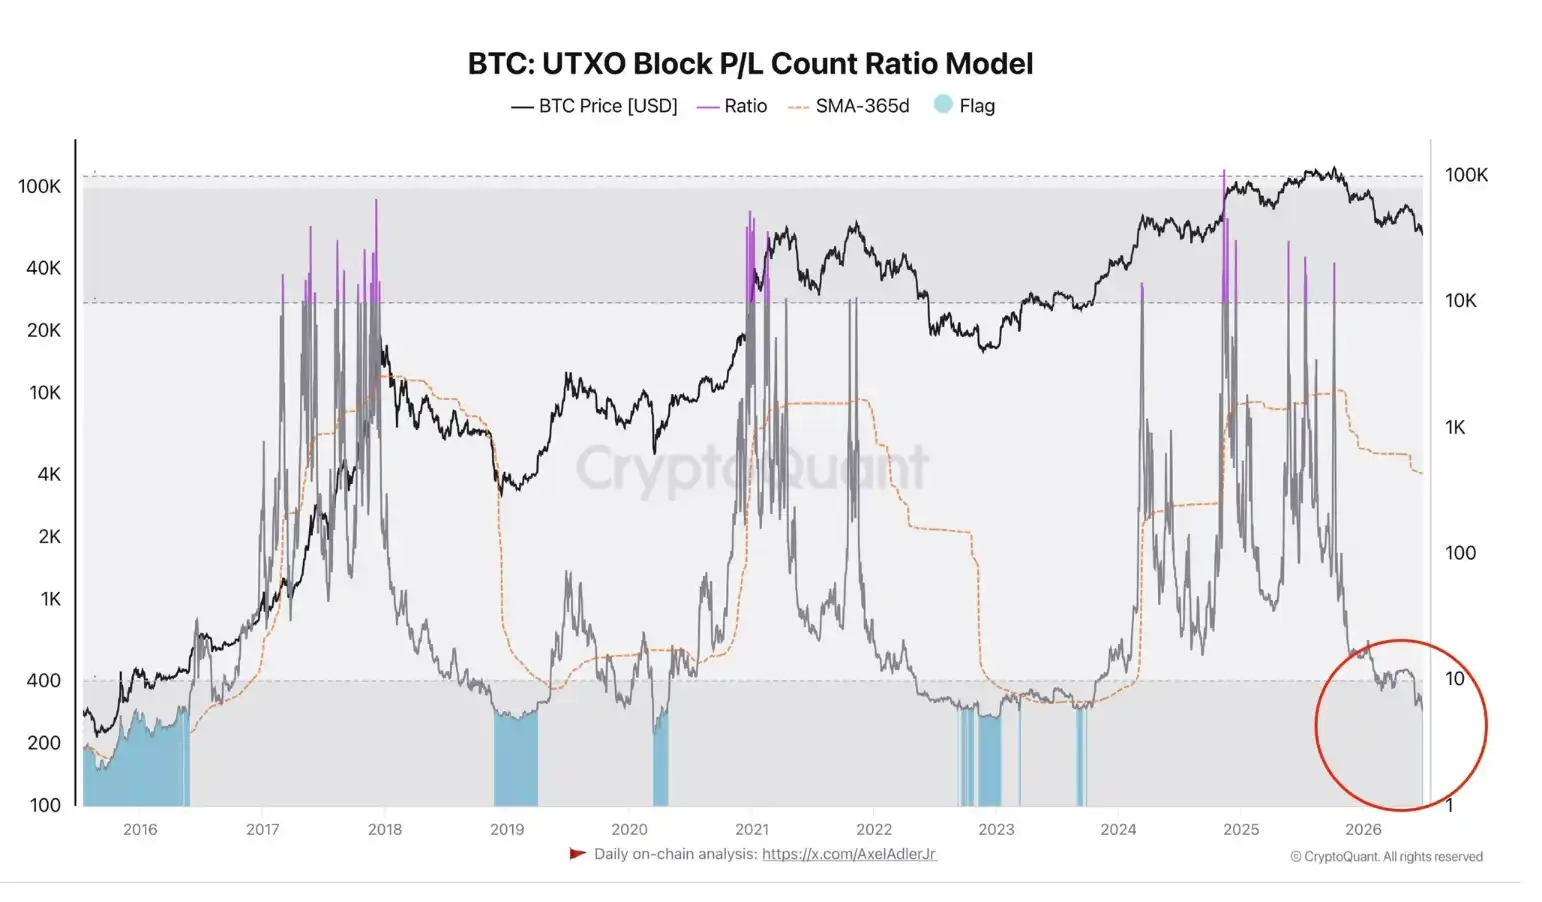
Meanwhile, on-chain data indicates the market has entered a clear "capitulation" phase. Darkfost further points out that the UTXO Profit/Loss Ratio has triggered the first "capitulation" signal of this bear market. The current proportion of on-chain loss-making transactions compared to profitable transactions has fallen to the lowest level of this bear market. Historically, this indicator has appeared multiple times in market bottom regions. The last time it fell to a similar level was during the bear market trough in mid-2023 when Bitcoin prices fell to around $26,000.
Institutional capital also remains cautious. According to Coinglass data, the Coinbase Bitcoin Premium Index has remained negative for 48 consecutive days since May 19th, setting the longest streak of consecutive negative premiums since the indicator's launch, surpassing the approximately 30-day streak of negative premiums during the "10/11 crash." The Coinbase Premium Index is primarily used to assess professional and institutional demand for Bitcoin. Historical experience shows that prolonged negative premiums are often accompanied by US institutional capital exiting, warranting caution about short-term pullback pressure.
However, looking at the Bitcoin Accumulation Trend Index AHR999, the indicator has currently dropped to 0.32, approaching the historical extreme low range. Over the past decade, this indicator has fallen below 0.3 only during extreme market environments, including the early market in 2011, the bottom of the 2018 bear market, the "March 12 Flash Crash" triggered by the pandemic in 2020, and during the FTX collapse in 2022. Although it has not yet broken below 0.3, it is already at a historically rare level.
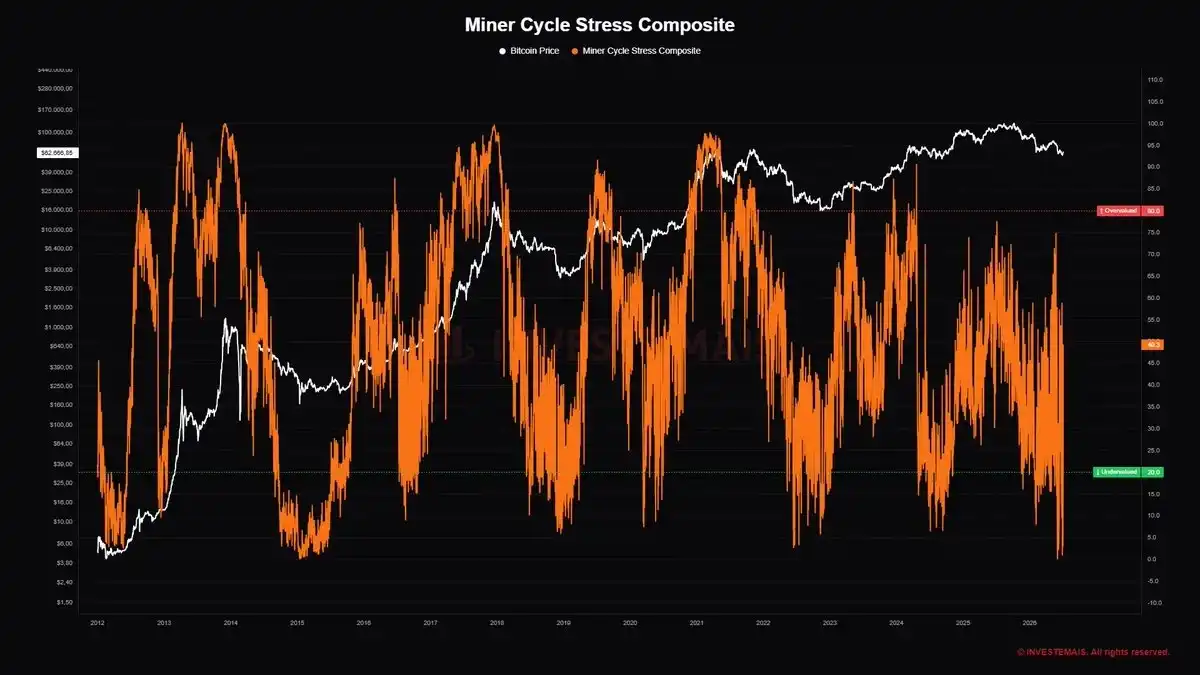
Besides investors, pressure on miners continues to increase. On-chain analyst @gaah_im points out that the Bitcoin Miner Cycle Pressure Composite Index has fallen to its lowest level since 2026 and re-entered the historical undervalued zone. This indicator combines the Puell Multiple and the Reverse Miner Capitulation Index, reflecting changes in miner revenue and miner selling pressure, respectively. Historical data shows this indicator has previously signaled near important market bottoms in 2015, 2018, 2020, 2022, and 2024. Among them, during the 2015 market capitulation, the composite index previously hit zero only during that period, with Bitcoin's price also falling from around $300 to $160 in a short time. The indicator exhibiting similar behavior in 2026 marks that miner pressure has again reached historically rare levels.
Still in a Recovery Rally, $70k May Be the Key Level for Trend Reversal
For now, this round of rise seems more like a recovery bounce following the previous oversold conditions.
Crypto analyst Murphy also points out that during this Bitcoin rebound, spot relative trading volume has declined rapidly. In the absence of spot demand driving such rises, they usually find it difficult to evolve into a trend reversal and are often just sentiment-driven recovery rallies. Follow-up attention should be paid to the sustainability of the rebound.
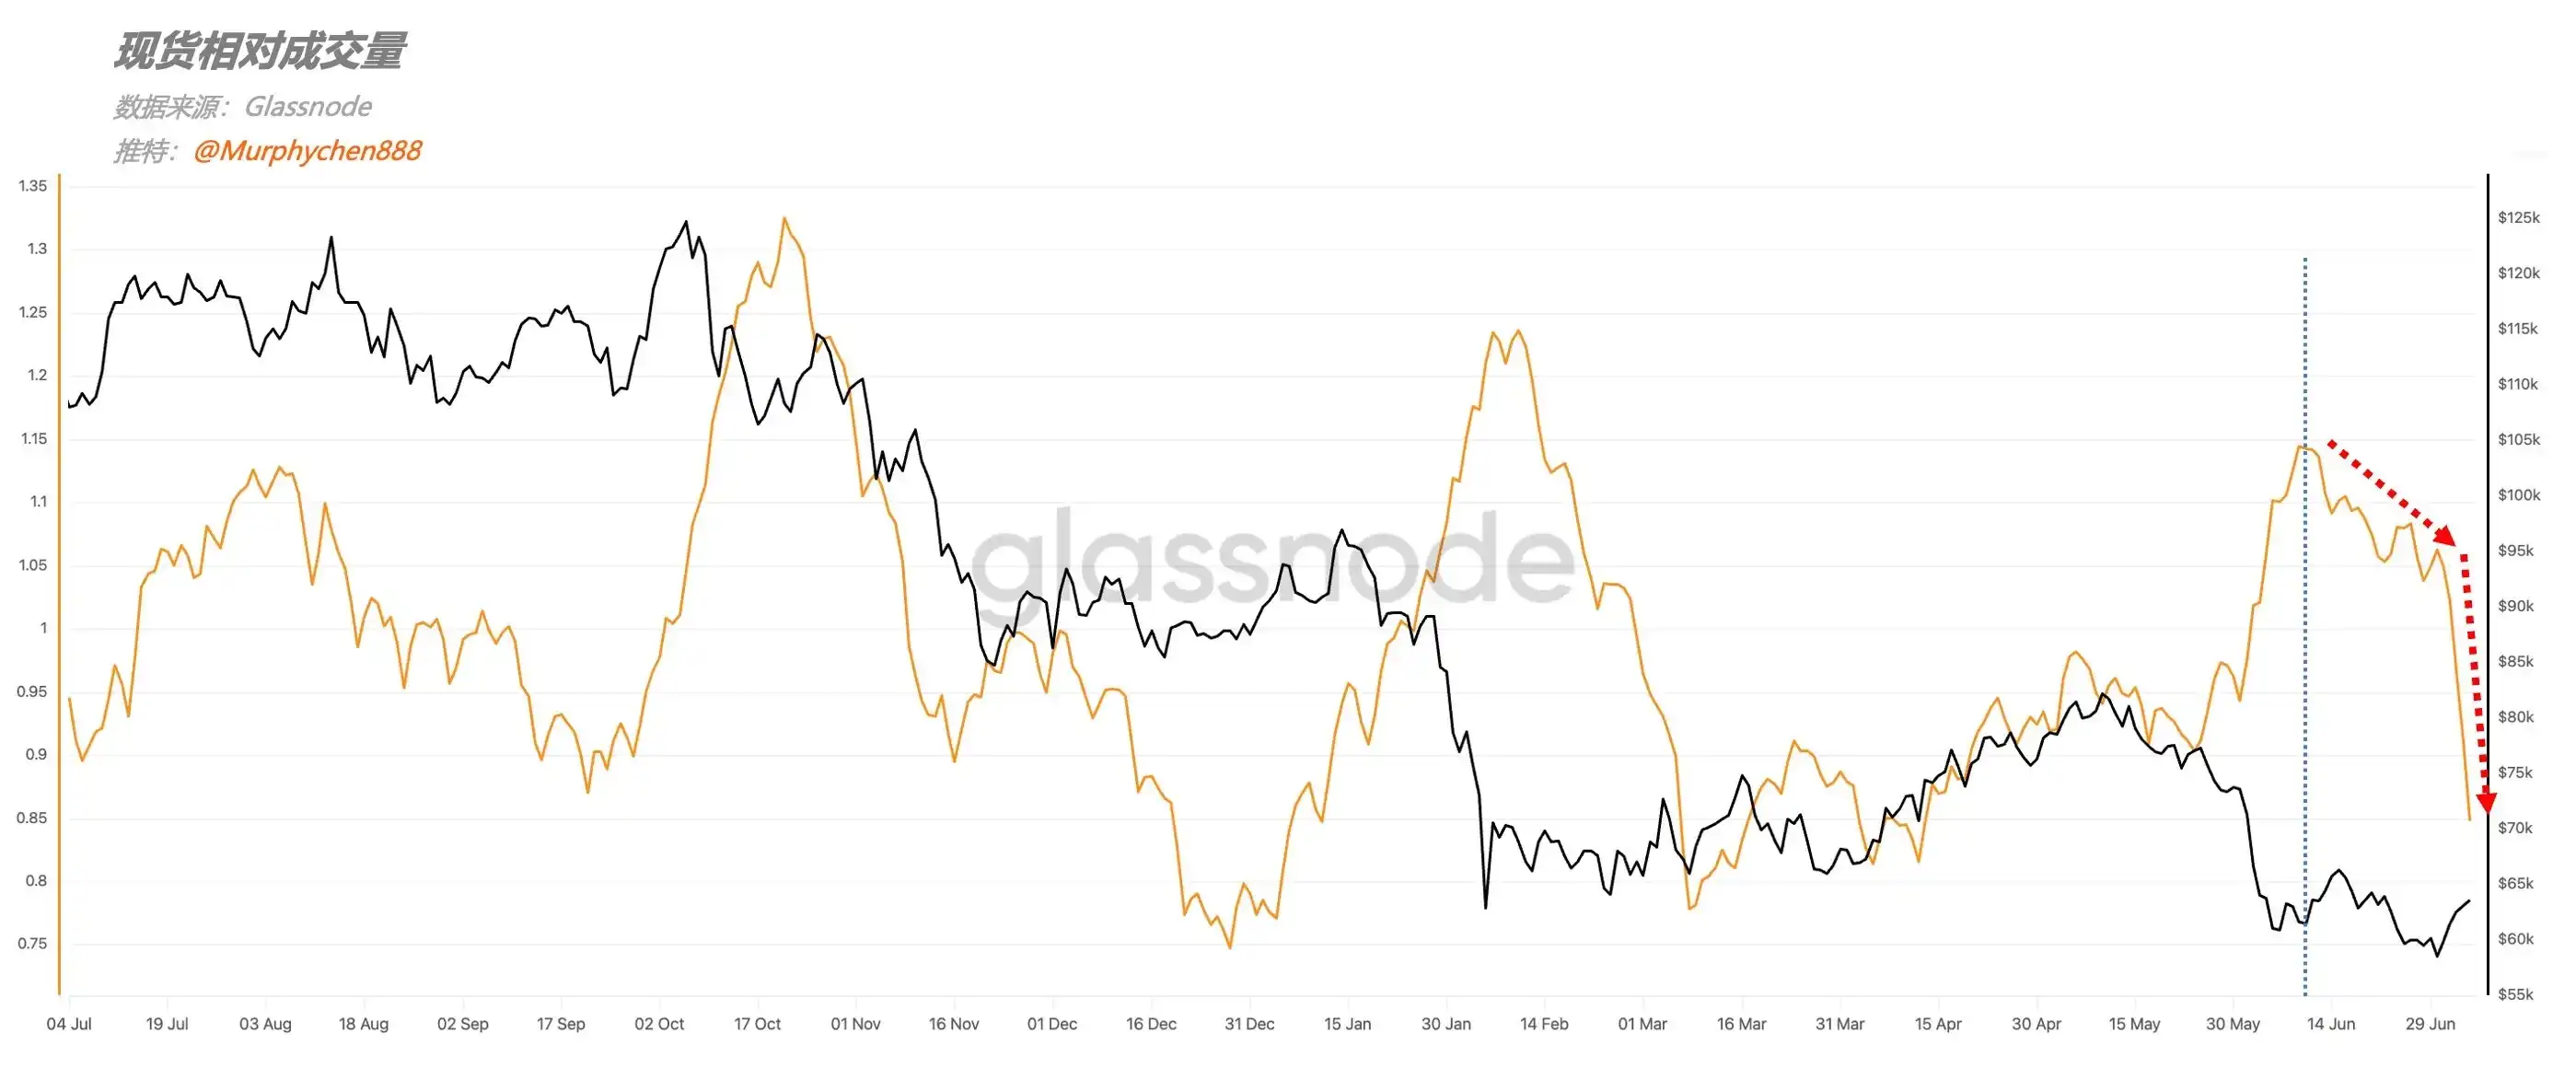
However, Murphy points out some positive changes in capital flow. On the positive side, the USDC/USDT exchange rate has fallen from 1.001 to 1.0006, indicating weakened exit intention and rising trading willingness in the market; simultaneously, mainstream stablecoins on exchanges are still in a state of net outflow, but the outflow magnitude continues to narrow. The marginal improvement in capital flow pressure provides some support for the continuation of the rebound. However, the weakening of spot driving force means the weight of derivatives has relatively increased. The 7-day moving average of perpetual contract funding rates continues to rise to $160k/hour, indicating Taker buy orders are continuously pushing perpetual contract prices above spot prices; although the current open interest has declined somewhat, it remains significantly higher than the level in February this year. The current funding rate is still within a relatively normal range, but as the rebound continues, the risk of a long squeeze will accumulate. Once open interest rebounds again, intense long-short battles will cause volatility to come faster and more sharply, which is worth particular attention.
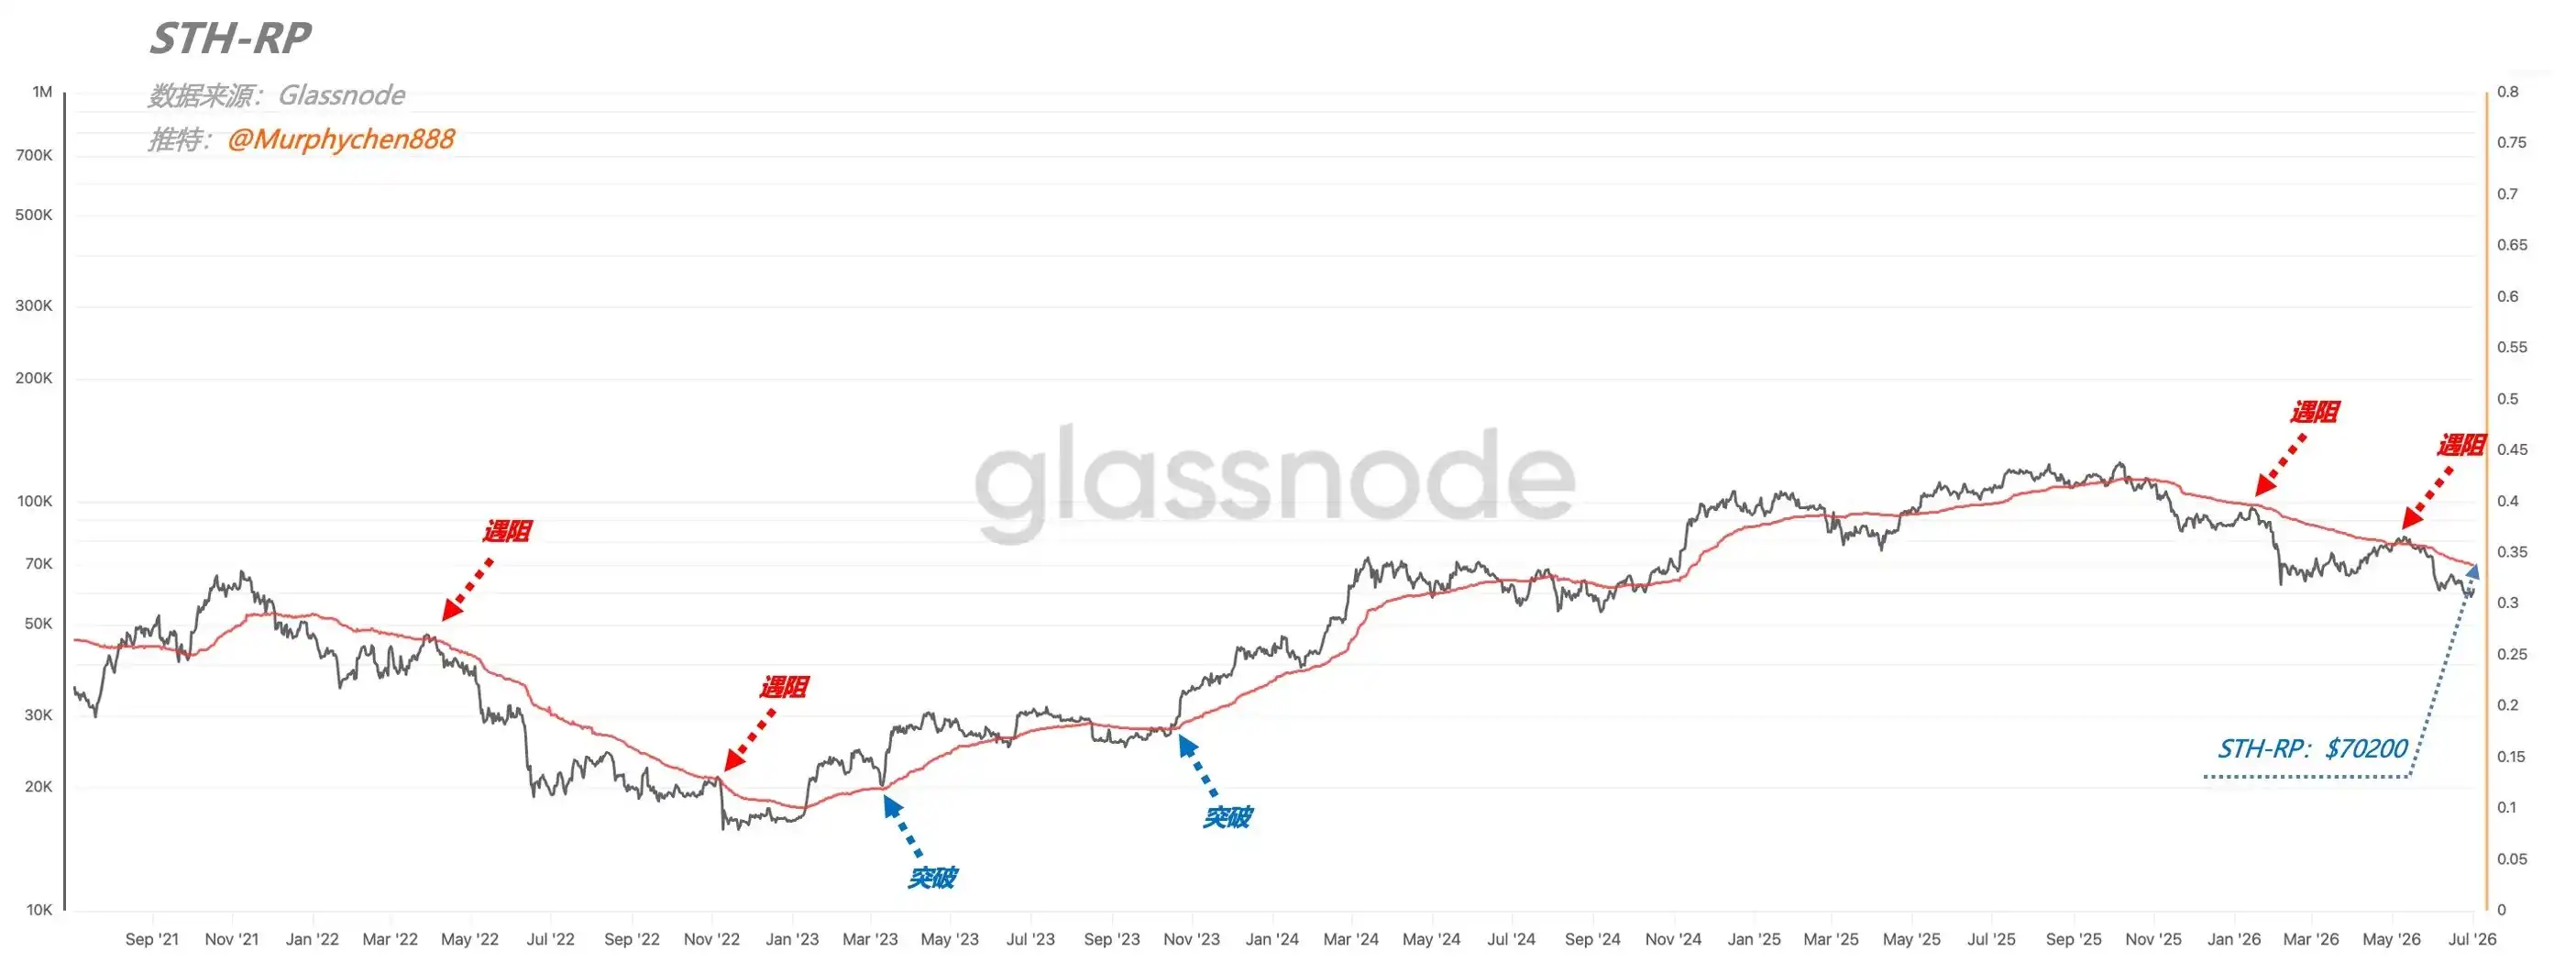
Regarding the potential rebound range, Murphy divides the target zone into three levels: $64,000, $68,000, and $70,000. Among them, $64,000 and $68,000 correspond to Bitcoin's short-term cost concentration zones (holdings under 1 month and under 3 months); $70,000 corresponds to the Short-Term Holder Realized Price (STH-RP). The STH-RP is often seen as the line dividing bull and bear sentiment. Historically, trend reversals have often started with prices effectively breaking through this key level, thus $70,000 is also seen as the ceiling for this bear market rally.
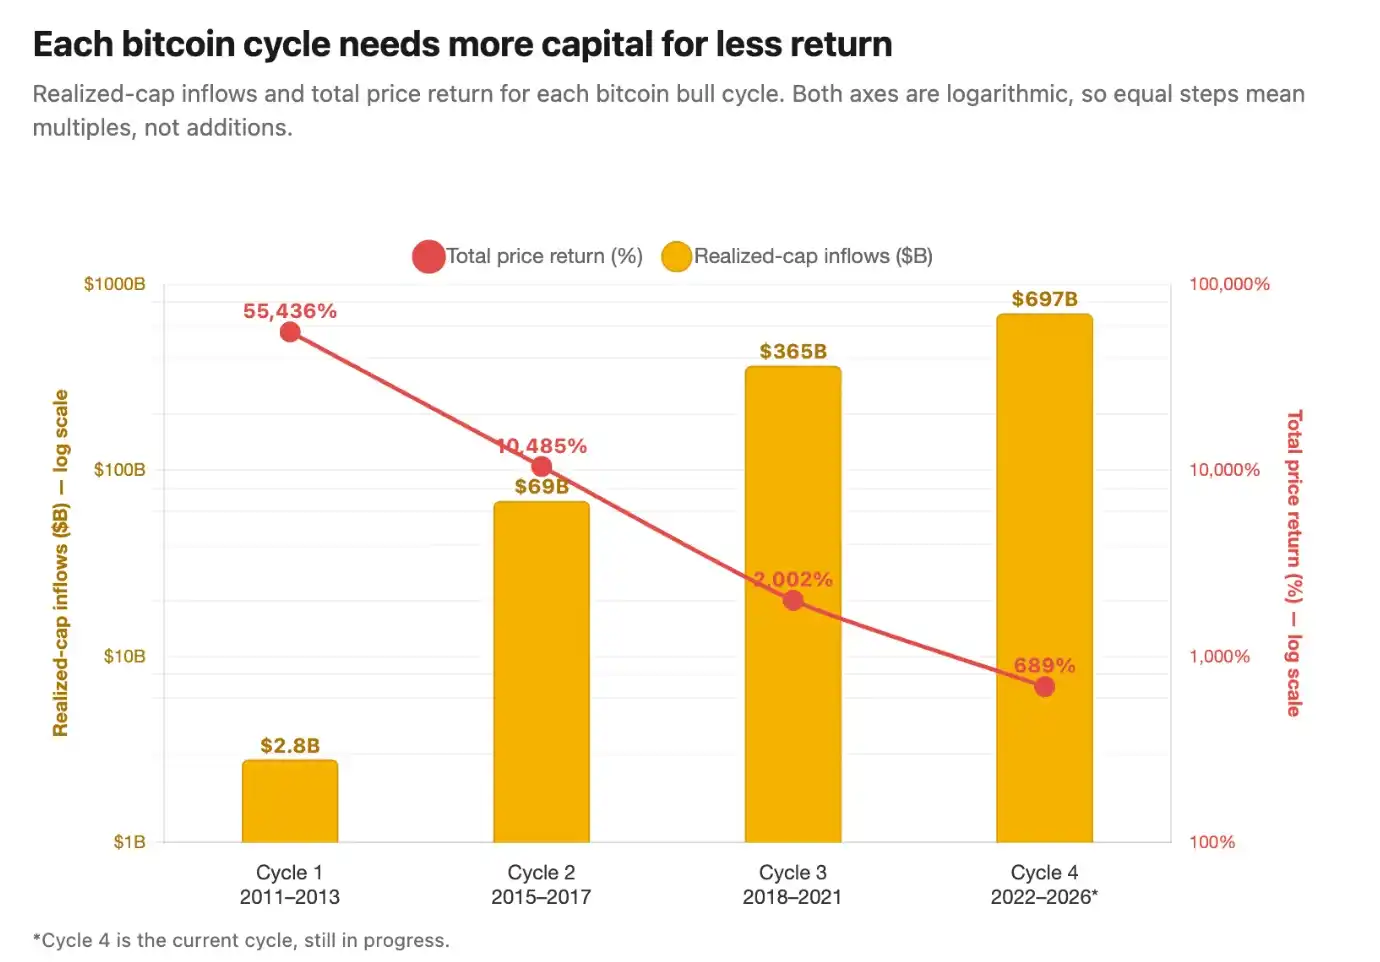
Extending the time horizon further, the challenges facing Bitcoin's bull market become more apparent. CryptoQuant founder Ki Young Ju believes that for Bitcoin to start the next parabolic bull run, it needs to truly grow into a core global macro asset, rather than relying primarily on retail sentiment and ETF fund flows. He estimates that the next bull market may need to attract over $1 trillion in new capital, far exceeding the current scale of institutional capital allocation. Historical data shows that the capital efficiency of Bitcoin bull markets is continuously declining. The 2011 cycle saw about $2.8 billion in net inflows driving a roughly 550x price increase; the 2015 cycle saw about $69 billion driving nearly a 100x increase; the 2018 cycle saw about $365 billion driving about a 20x increase; in the current cycle since 2022, about $697 billion in new capital corresponds to only about a 689% price increase. This means that as Bitcoin's market capitalization continues to expand, increasingly larger amounts of incremental capital will be needed to drive prices to achieve similar magnitude gains in the future. However, this long-term logic still faces practical challenges. US spot Bitcoin ETFs recently experienced consecutive net outflows for a period, retail capital continues to withdraw, and institutional capital has not yet formed a sufficiently large scale of incremental inflows. The market still has some distance to go before the next full-scale bull market.
Meanwhile, the altcoin market still shows no significant improvement. CryptoQuant analyst IT Tech indicates that the altcoin market (excluding Bitcoin and Ethereum) remains under continued pressure. Data shows that the cumulative buy/sell volume divergence for altcoins in June has hit an extreme low for the past five years and is still further declining, reflecting that the spot market is still dominated by sustained net selling. Since the decline from the high in early 2025, selling pressure has not shown significant relief, and the market has not yet shown clear signs of stabilization.
Despite near-term market pressures, several veteran investors believe Bitcoin prices are gradually approaching the bottom range of past cycles. For example, early investor Bruno Ver anticipates Bitcoin could still potentially retreat to around $50,000; CryptoQuant's calculated Bitcoin Realized Price is approximately $53,400, which has historically served as an important bottom reference in bear markets; while multiple on-chain models from Glassnode place the potential bottom range between $37,000 and $60,000.
Overall, July has brought a long-awaited breathing opportunity for the crypto market, but a true trend reversal still requires more confirmation signals.