End of Correction or Continuation of Trend: Technical Structure Review of BTC and HYPE | Guest Analysis

Odaily星球日报Xuất bản vào 2026-07-06Cập nhật gần nhất vào 2026-07-06

Tóm tắt

**Weekly Technical Analysis: BTC & HYPE Structure Review** This analysis covers the multi-timeframe technical structure for Bitcoin (BTC) and HYPE. **Bitcoin (BTC) Analysis:** BTC's correction from its May 6 high has formed a clear four-segment pattern on the daily chart. The market is currently in a (3-4) rebound phase. The key determinant for the short-term trend is the endpoint of this rebound ("Endpoint 4"): * **Path 1 (Preferred Scenario):** If the rebound surpasses the $65,700 resistance, subsequent pullbacks are less likely to break the key support at $57,820 (July 1 low). This would suggest a transition into a consolidating range, building energy for a potential bullish reversal. * **Path 2:** Failure to reach $65,700, or even $64,500, increases the probability of a breakdown below $57,820, continuing the downtrend. The 4-hour chart shows a completed five-wave decline from June 15, culminating in a momentum divergence at the low, which supported the recent bounce. **BTC Weekly Outlook & Strategy (Jul 6-12):** * **Core View:** Focus on the high point of the daily rebound from $57,820. * **Key Levels:** * Resistance: $64,500-$65,700; $67,300; $69,500-$71,000. * Support: $60,950-$62,300; $57,820; $55,000. * **Strategy:** * **Mid-term:** Maintain ~20% short position. Consider increasing shorts to <50% if price stalls in the $65,700-$67,300 zone with confirming model signals. * **Short-term:** Use 30% capital for swing trades between su...

This weekly report conducts a multi-period technical structure analysis focusing on BTC and HYPE. For Bitcoin, the analysis begins with the daily and 4-hour charts, examining the correction structure since the May 6th peak. Combined with a proprietary quantitative model, it offers predictions for key resistance and support levels this week, along with medium- and short-term trading paths. The HYPE section concentrates on the 4-hour chart trend, analyzing the structural evolution of the current rebound and providing corresponding risk control suggestions for this week's short-term operations. Details are as follows.

Last Week's Strategy Verification

  • BTC Market Prediction Verification: Last week's article explicitly stated that Bitcoin's short-term correction was nearing its end. The actual market movement largely aligned with the predicted path, validating the forward-looking judgment.
  • HYPE Market Prediction Verification: Last week's article pointed out that a short-term entry opportunity for long positions in HYPE was about to emerge. Current market movements have confirmed this judgment.

I. Multi-Period Trend Structure Analysis of Bitcoin

1. Daily Chart Trend Structure Analysis

Bitcoin Daily Candlestick Chart
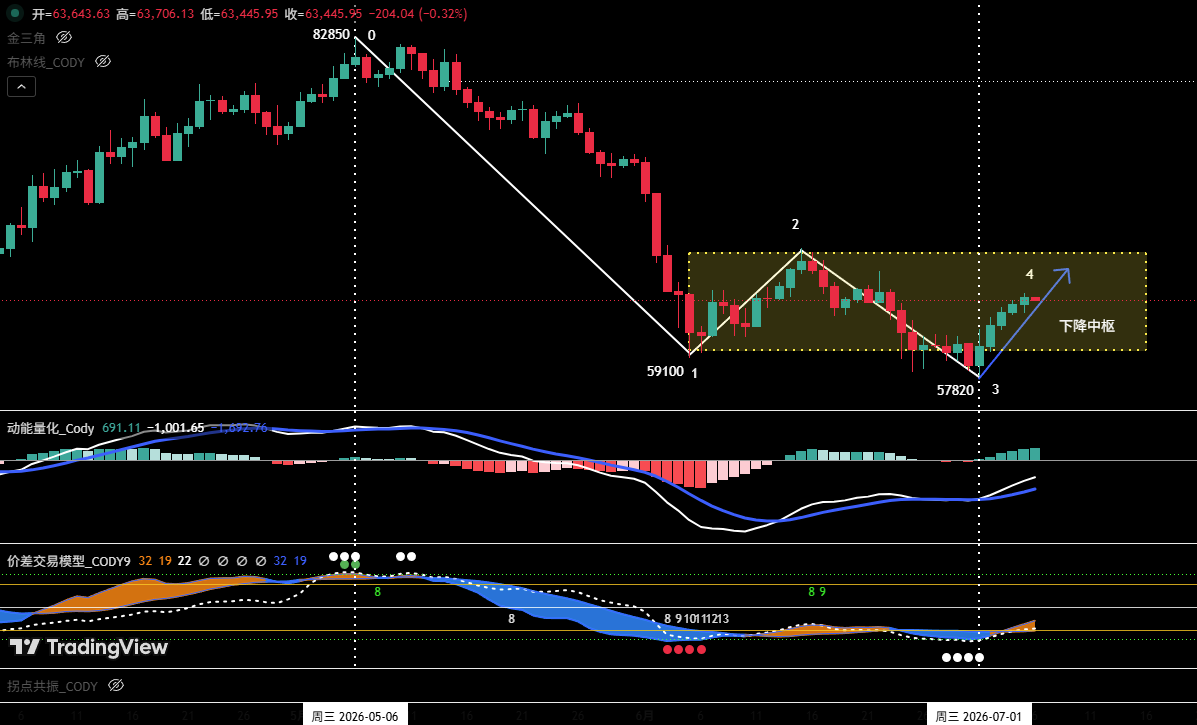
Figure 1

1. As shown in Figure 1: The correction that began from the May 6th high of $82,850 has clearly formed a four-stage correction structure on the daily chart, from "Point 0" to "Point 4".

2. The market is currently in the (3-4) rebound phase. The final position of "Point 4" will determine the short-term price direction.

  • Path One: If the rebound price at "Point 4" can break through the resistance at $65,700, the probability of a subsequent pullback directly breaking below the support at the July 1st low of $57,820 will be significantly reduced. In this scenario, the market is expected to rebound again after the correction ends, with the recent overall trend likely entering a range-bound consolidation pattern. The longer this consolidation structure persists, the more it helps to slow downward momentum and accumulate strength for a subsequent bullish counterattack.
  • Path Two: If the rebound price at "Point 4" fails to reach $65,700, or even falls below $64,500, the probability of a subsequent pullback directly breaking below $57,820 increases substantially, making it more likely for the market to continue its downward trend.

3. Analysis based on the proprietary quantitative model indicates a high probability of the market entering range-bound consolidation (i.e., Path One).

2. Hourly Chart Trend Structure Deep Dive (Using 4-hour as Analysis Period)

Bitcoin 4-hour Candlestick Chart
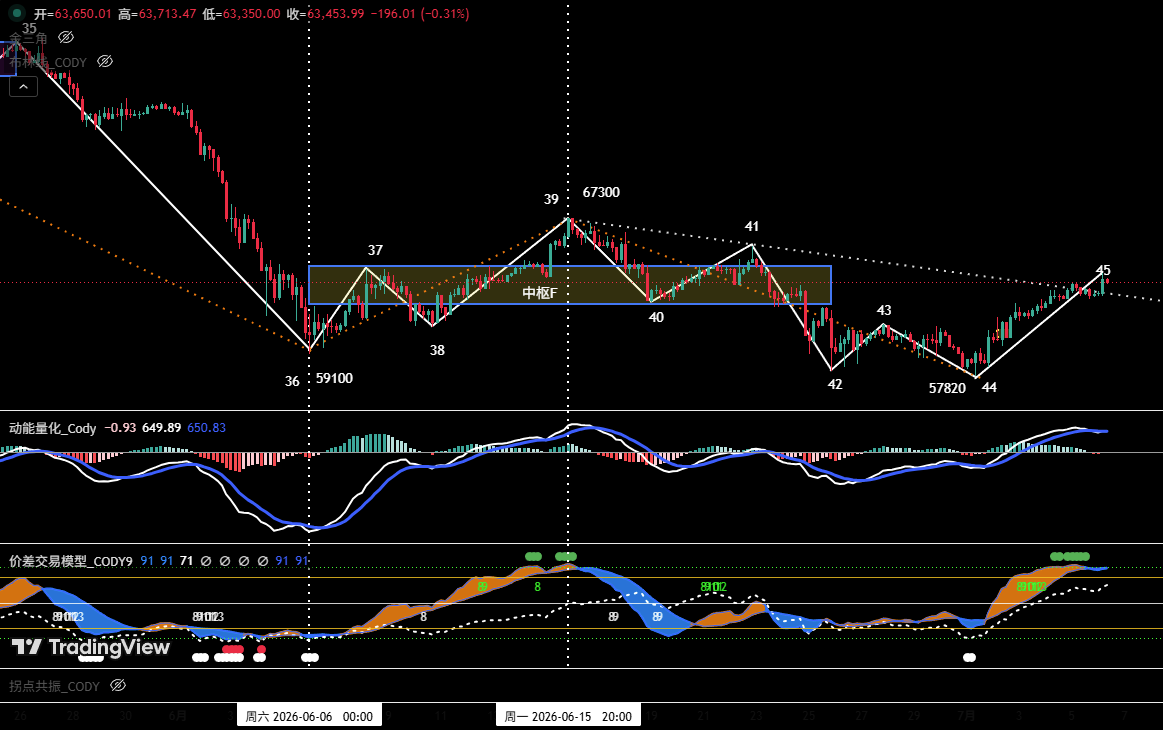
Figure 2

1. Last week's review pointed out: "If the end of Point 44 is below $58,110 accompanied by the formation of a momentum bottom divergence, the market will present a rebound opportunity." Last week's price action validated this judgment, with the actual movement highly consistent with the predicted structure.

2. On the 4-hour chart, the hourly-level decline wave that started from the June 15th high of $67,300 has completed a full five-wave structure; simultaneously, at the end of the correction, a clear momentum bottom divergence formed between low points "Point 44" and "Point 42," providing technical support for the subsequent oversold rebound.

3. The market is currently in the (44-45) rebound phase. From Figure 2, the current rebound high "Point 45" has broken above the lower boundary of the previous "Falling Channel F" (around $62,300), indicating short-term momentum is shifting in favor of bulls. If the price can further break through "Point 41" (around $65,700), it would signal an upgrade in rebound strength, significantly reducing the probability of a subsequent pullback directly breaking below "Point 44" (around $57,820).

II. Bitcoin Weekly Market Forecast and Trading Strategy (07.06~07.12)

1. BTC Weekly Market Trend Forecast

Core View: Focus on the high point of the daily oversold rebound starting from the low of $57,820.

2. Core Resistance Levels:

• First Resistance Zone: $64,500~$65,700 area (previous significant high/low points)

• Second Resistance Zone: Around $67,300 (previous significant resistance area)

• Third Resistance Zone: $69,500~$71,000 area (previous significant resistance area)

3. Core Support Levels:

• First Support Level: $60,950~$62,300 area (previous significant support)

• Second Support Level: Around $57,820 (previous significant support)

• Third Support Level: Around $55,000 (previous significant support)

4. Weekly Trading Strategy

1 Medium-Term Strategy:

Bitcoin Daily Candlestick Chart (Position Monitoring Model)
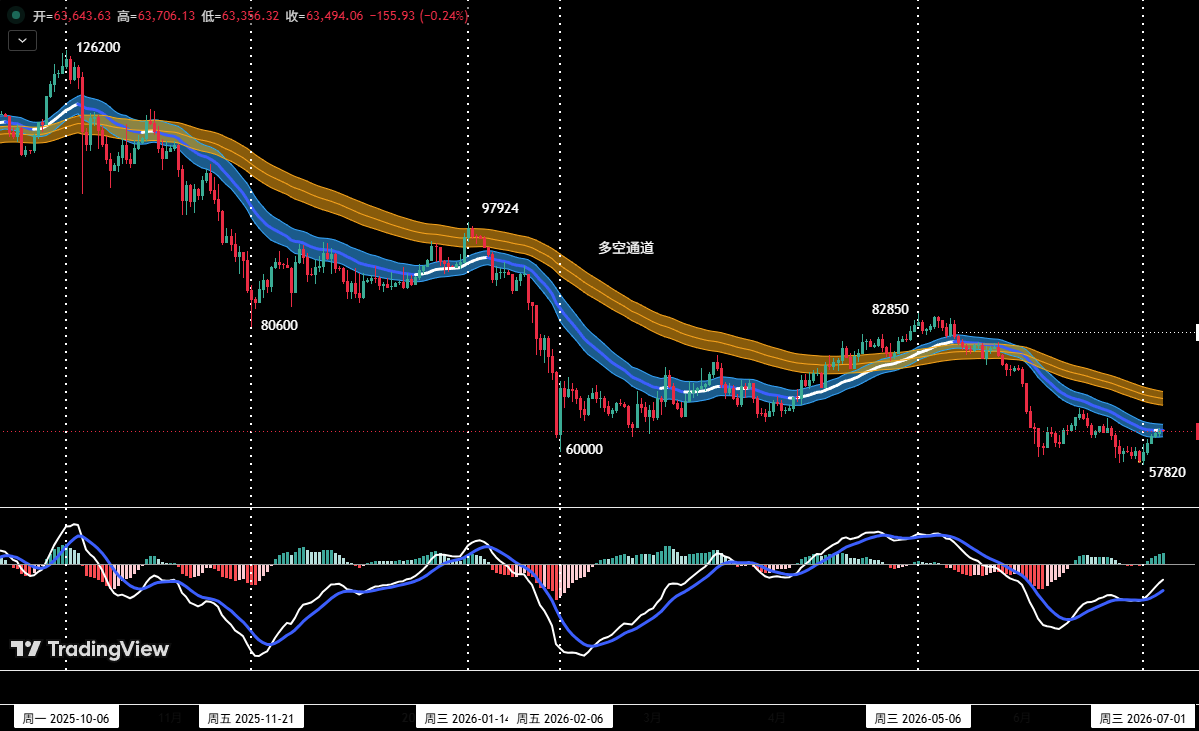
Figure 3

As shown in Figure 3, the price has effectively broken below the "Bull-Bear Channel," confirming a shift to a bear-dominated market structure.

  • Current medium-term short positions can be maintained at around 20%.
  • If the price rebounds to the $65,700~$67,300 zone and shows signs of stagnation, combined with top signals from the proprietary quantitative model, consider increasing medium-term short positions to within 50%.

2 Short-Term Strategy

Utilize 30% of capital, set stop-losses, and seek "price difference" opportunities based on support and resistance levels (using 30-minute/60-minute charts as operational cycles).

3 Short-Term Operation Contingency Plans

To dynamically respond to the market's complex evolution, two specific operational plans, A and B, are drafted in advance:

  • Plan A: Testing Short Positions in Strong Resistance Zone
  • Entry: If the price rebounds to the $65,700~$67,300 zone and meets resistance, combined with quantitative model top signals, establish short positions of around 30%.
  • Risk Control: Set initial stop-loss.
  • Exit: Gradually close positions to take profits when the price adjusts near important support levels, combined with model signals.
  • Plan B: Light Long Positions in Strong Support Zone
  • Entry: If the price breaks above the $65,700 zone, meets resistance, pulls back, and stabilizes near the strong support of $57,820, showing signs of bottoming, combined with quantitative model bottom signals, establish long positions of around 15%.
  • Risk Control: Set initial stop-loss.
  • Exit: Gradually close positions to take profits when the price rebounds near important resistance levels, combined with model signals.

III. HYPE Hourly Chart Trend Structure Analysis

HYPE 4-hour Candlestick Chart
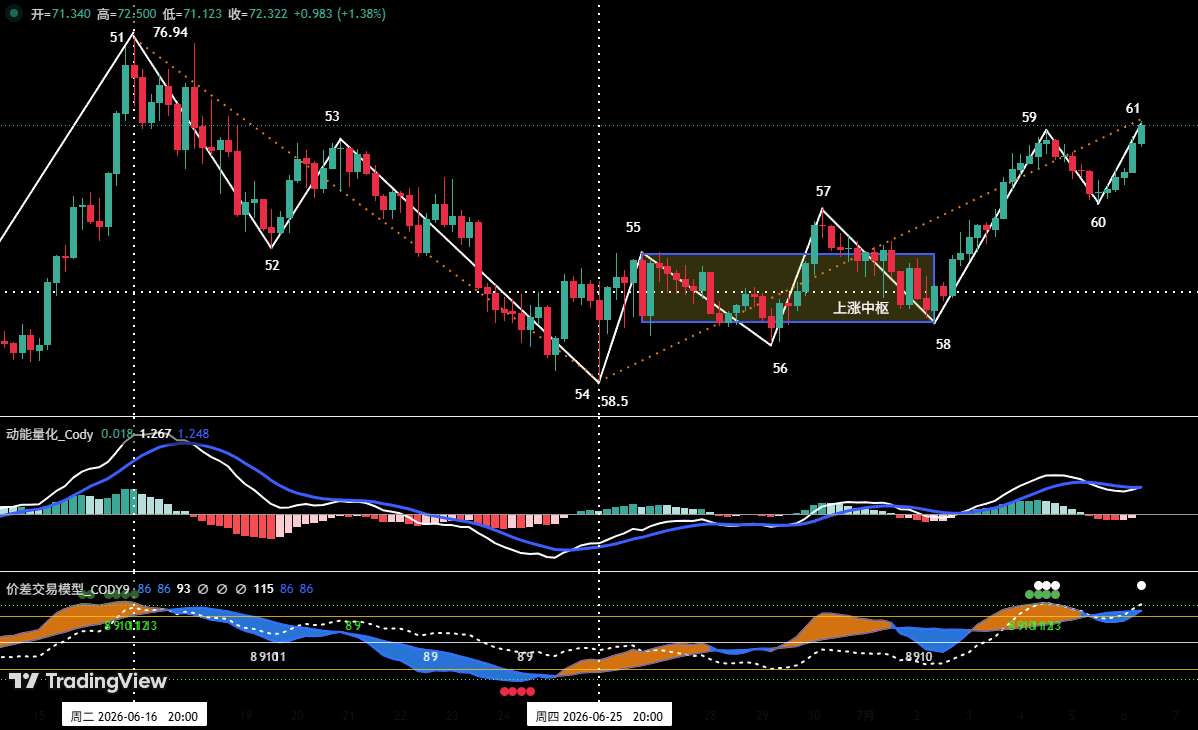
Figure 4

  1. As shown in Figure 4, last week's review stated: "If 'Point 56' is higher than 'Point 54', it forms a 'Double Bottom' pattern, potentially ending this correction, with a high probability of a rebound starting from 'Point 56'." To date, the market movement closely aligns with the analysis. In last week's actual movement, HYPE price rose from "Point 56" (around $60.55) to "Point 59" (around $72.06), with a maximum gain of approximately 19.01%.
  2. Analyzing the 4-hour chart, the rebound in HYPE starting from the June 25th low of $58.5 (Point 54) can be subdivided into a seven-wave upward structure on the 4-hour cycle: 54-55, 55-56, 56-57, 57-58, 58-59, 59-60, 60-61.
  3. The price is currently in the 60-61 upward phase, with the overall upward structure complete. However, the proprietary "Price Difference Trading Model" detected top warning signals at "Point 59" and "Point 61," and the price is approaching the historical high area near $76.94. Therefore, blind chasing of rallies is not advisable at this moment; remain vigilant against short-term correction risks.

IV. HYPE Weekly Market Forecast and Short-Term Trading Strategy

1. HYPE Weekly Market Trend Forecast

Core Resistance Levels

  • First Resistance: Around $75~$76.94
  • Second Resistance: Around $80

Core Support Levels

  • First Support: Around $68
  • Second Support: Around $65.5
  • Third Support: $60.5~$61.5 area

Core View for the Week: When the price rises to the $75~$76.94 area, observe the battle outcome between bulls and bears over this zone.

2. HYPE Weekly Short-Term Trading Strategy

This week's focus is on closing positions to lock in profits and prevent risks. If long positions were established in the support zone according to the plan, it is recommended to move the stop-loss up to around $68 to protect profits (or decide independently). If the market shows signs of adjustment, close positions promptly to take profits.

V. HYPE Short-Term Operation Review

We strictly followed the operation plan and, based on trading signals from our proprietary "Price Difference Trading Model" and "Momentum Quantitative Model," completed one short-term (long) trade last week, achieving a total trading profit of approximately: 10.23%.

Short-Term Trade 1: (See Table 1)

1. HYPE Short-Term Trade Details Summary:(Leverage*1x)
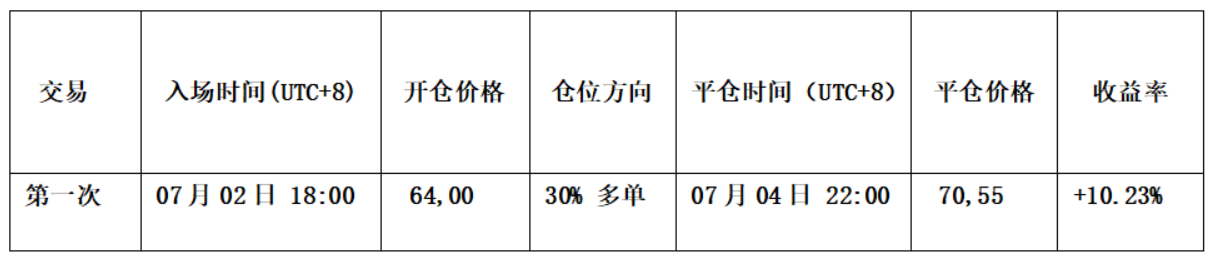
Table 1

2. Short-Term Trade Review:(See Figure 5)

• Entry Strategy:

a. Based on an accurate judgment of the overall upward price trend.

b. When the price effectively broke through the short-term downtrend line, and both the "Price Difference Trading Model" and "Momentum Quantitative Model" simultaneously issued bottom divergence resonance signals.

Therefore, we established a 30% long position at $64.

• Exit Strategy:

a. When the price rose near the $72 resistance and showed signs of stagnation, with the candlesticks forming a "Top Reversal" pattern.

b. The "Price Difference Trading Model" triggered a strong top warning signal (green dot + white dot), forming a top resonance signal with the "Momentum Quantitative Model".

Therefore, we closed all positions around $70.55.

• Summary: This trade successfully yielded a profit of approximately 10.23%.

HYPE_60-minute Candlestick Chart:(Momentum Quantitative Model + Price Difference Trading Model)
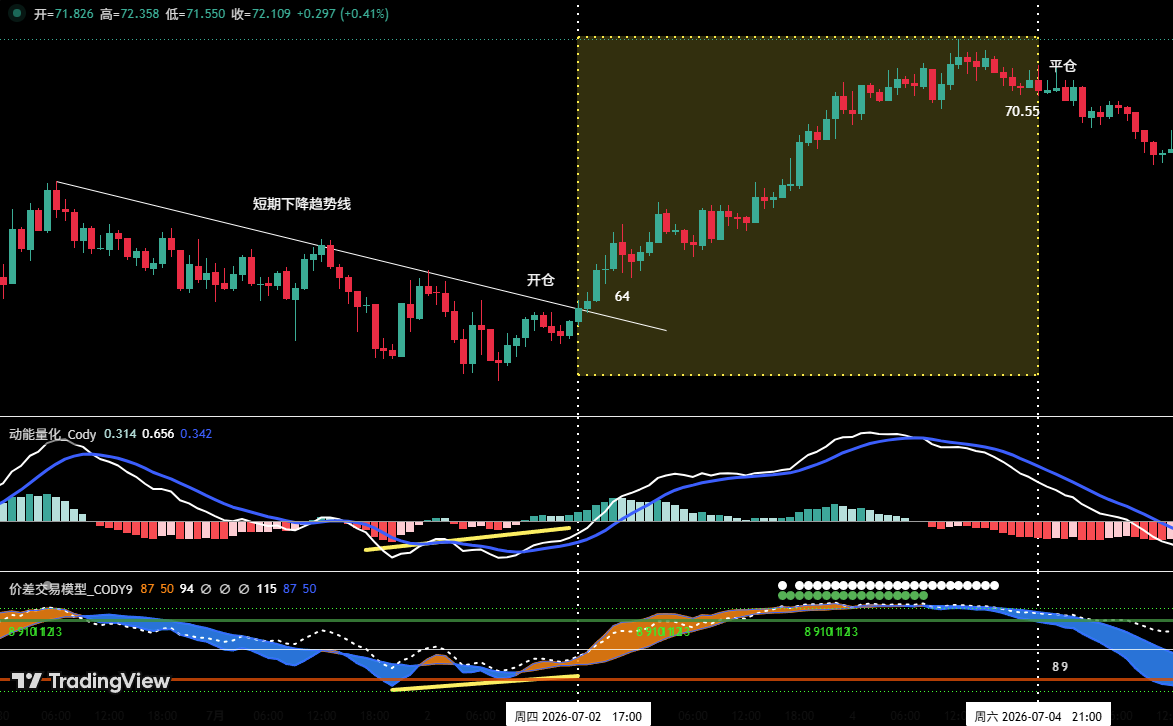
Figure 5 (Short-Term Trade Illustration)

VI. Special Notes

  1. When opening a position: Immediately set an initial stop-loss.
  2. When profit reaches 1%: Move the stop-loss to the entry price (break-even point) to ensure capital safety.
  3. When profit reaches 2%: Move the stop-loss to the 1% profit level.
  4. Continuous tracking: Thereafter, for every additional 1% profit the price makes, move the stop-loss up by 1% accordingly, dynamically protecting and locking in profits.

Financial markets change rapidly, and all market analysis and trading strategies require dynamic adjustment. All views, analytical models, and operational strategies mentioned in this article are derived from personal technical analysis, intended solely for personal trading log purposes. They do not constitute any investment advice or basis for operation. The market involves risks, investing requires caution. Please do not make decisions based solely on this content.


Tiền kỹ thuật số thịnh hành

Câu hỏi Liên quan

QWhat are the two key technical analysis paths for Bitcoin's current rebound based on the 'Endpoint 4' price position mentioned in the article?

APath One: If the rebound at 'Endpoint 4' can break above the $65,700 resistance, a subsequent pullback is less likely to directly breach the July 1st low of $57,820. The market is then expected to move into a range-bound consolidation, which would help dissipate selling pressure and build momentum for a future upward move. Path Two: If the rebound at 'Endpoint 4' fails to reach $65,700 or even stays below $64,500, a subsequent pullback has a high probability of directly breaking below the $57,820 support, indicating a continuation of the prior downtrend. According to the author's proprietary quantitative model, the probability of Path One (range-bound consolidation) is significantly higher.

QAccording to the 4-hour chart analysis for Bitcoin, what specific condition did the author previously predict that would signal a rebound opportunity, and how did the market action last week validate it?

AThe author predicted that if 'Endpoint 44' finished below $58,110 and was accompanied by the formation of a momentum bottom divergence, the market would present a rebound opportunity. Last week's market action validated this prediction, as the actual price movement aligned closely with the forecasted structure. The low at 'Endpoint 44' (around $57,820) did fall below the specified level, and a momentum divergence was confirmed, leading to the current oversold rebound.

QWhat is the core trading strategy for HYPE this week (the week of the article's publication) according to the author's analysis?

AThe core trading strategy for HYPE this week is to prioritize locking in profits and managing risk. If long positions were already established in support zones as per previous plans, it is advised to move the stop-loss up to around $68 to protect profits (or adjust based on individual judgment). If the market shows signs of a pullback, positions should be closed promptly to realize gains. The article emphasizes caution against blindly chasing the rally near the historical high region of $76.94.

QDescribe the specific conditions (entry and exit signals) for the HYPE short-term long trade that resulted in a 10.23% profit, as detailed in the trade复盘 (review).

AEntry Conditions: 1. Based on an accurate研判 of the overall uptrend. 2. Price effectively broke through a short-term descending trendline. 3. The proprietary 'Price Difference Trading Model' and 'Momentum Quantitative Model' simultaneously issued bottom divergence共振 signals. Based on these conditions, a 30% long position was established at $64. Exit Conditions: 1. Price rose near the $72 resistance level and showed signs of stagnation, with the K线 forming a 'top分型' pattern. 2. The 'Price Difference Trading Model' triggered a strong top预警 signal (Green dot + White dot), which formed a top共振 signal with the 'Momentum Quantitative Model'. Based on these conditions, the entire position was closed around $70.55, resulting in a profit of approximately 10.23%.

QWhat is the author's recommended dynamic stop-loss management rule once a trade becomes profitable, as outlined in the '特别提示' (Special Notes) section?

AThe author's recommended dynamic stop-loss management rules are: 1. Upon opening a position: Immediately set an initial stop-loss. 2. When profit reaches 1%: Move the stop-loss to the entry price (breakeven point) to ensure capital safety. 3. When profit reaches 2%: Move the stop-loss to the 1% profit level. 4. Continuous tracking: Thereafter, for every additional 1% gain in profit, move the stop-loss up by 1% accordingly, dynamically protecting and locking in profits.

Nội dung Liên quan

Lễ hội chip bắt đầu hạ nhiệt? Wilson (Morgan Stanley): Dòng tiền đang chuyển hướng sang các ông lớn siêu máy tính AI như Microsoft, Amazon

Thị trường chứng khoán Mỹ khó lập đỉnh mới trong ngắn hạn. Theo Michael Wilson, chiến lược gia trưởng tại Morgan Stanley, dòng tiền đang chảy ra khỏi các cổ phiếu bán dẫn vốn tăng mạnh năm nay và chuyển sang các công ty siêu máy chủ điện toán đám mây AI (hyperscalers) như Microsoft, Amazon và Meta. Động lực của ngành bán dẫn đang giảm nhiệt. Chỉ số Philadelphia Semiconductor (SOX) đã giảm gần 14% từ mức đỉnh lịch sử tháng trước, cho thấy áp lực định giá. Trong khi đó, rổ cổ phiếu siêu máy chủ do UBS biên soạn lại giảm 2% kể từ tháng 9 năm ngoái, tạo ra không gian bù đắp tăng giá tương đối. Wilson nhận định các gã khổng lồ siêu máy chủ hấp dẫn nhờ hoạt động kinh doanh cốt lõi mạnh mẽ, cung cấp nền tảng vững chắc trong hệ sinh thái AI. Tuy nhiên, ông cũng cảnh báo họ có thể bắt đầu điều chỉnh giảm kế hoạch chi tiêu vốn do lo ngại đầu tư quá mức vào AI. Sự luân chuyển này có thể mở rộng ra ngoài lĩnh vực công nghệ. Wilson và Mislav Matejka của JP Morgan đều cho rằng xu hướng tăng trưởng thị trường sẽ mở rộng sang các nhóm ngành khác như tiêu dùng tự chọn, vận tải và công nghệ sinh học trong nửa cuối năm. Wilson duy trì mục tiêu chỉ số S&P 500 ở mức 8000 điểm vào cuối năm, ngụ ý mức tăng tiềm năng khoảng 7% từ thời điểm hiện tại.

marsbit22 phút trước

Lễ hội chip bắt đầu hạ nhiệt? Wilson (Morgan Stanley): Dòng tiền đang chuyển hướng sang các ông lớn siêu máy tính AI như Microsoft, Amazon

marsbit22 phút trước

Lễ hội chip đang hạ nhiệt? M. Wilson từ Morgan Stanley: Tiền đang chuyển hướng sang các đại gia siêu máy tính AI như Microsoft, Amazon

Thị trường chứng khoán Mỹ khó có thể lập đỉnh mới trong ngắn hạn. Theo Michael Wilson, chiến lược gia tại Morgan Stanley, dòng tiền đang dịch chuyển khỏi các cổ phiếu bán dẫn vốn tăng mạnh từ đầu năm để chuyển sang các công ty siêu máy chủ AI (hyperscalers) như Microsoft, Amazon và Meta. Chỉ số Philadelphia Semiconductor đã giảm gần 14% so với đỉnh lịch sử hồi tháng trước, cho thấy động lực của ngành bán dẫn đang suy yếu do áp lực định giá. Trong khi đó, nhóm cổ phiếu siêu máy chủ được cho là có không gian tăng giá bù đắp, dù họ có thể điều chỉnh kế hoạch chi tiêu vốn. Wilson cũng dự đoán sự luân chuyển tiền có thể mở rộng sang các lĩnh vực khác như hàng tiêu dùng không thiết yếu, vận tải và công nghệ sinh học. Chiến lược gia Mislav Matejka của JPMorgan cũng đồng quan điểm, cho rằng đà tăng thị trường sẽ mở rộng ra ngoài lĩnh vực công nghệ trong nửa cuối năm. Wilson duy trì mục tiêu chỉ số S&P 500 ở mức 8000 điểm vào cuối năm, ngụ ý tiềm năng tăng khoảng 7% từ mức hiện tại, nhưng cảnh báo về rủi ro biến động trong ngắn hạn.

链捕手26 phút trước

Lễ hội chip đang hạ nhiệt? M. Wilson từ Morgan Stanley: Tiền đang chuyển hướng sang các đại gia siêu máy tính AI như Microsoft, Amazon

链捕手26 phút trước

Nhà triết học AI đầu tiên trên thế giới, 9 năm tại Google DeepMind: Chạy đôn đáo vì an toàn AGI

Trong 9 năm qua tại Google DeepMind, nhà triết học Iason Gabriel đã nỗ lực giải quyết các vấn đề đạo đức trọng tâm của AI và AGI. Ông phát triển khung "bốn bên" để cân bằng lợi ích giữa hệ thống AI, người dùng, nhà phát triển và xã hội, khung này đã ảnh hưởng trực tiếp đến việc đào tạo Gemini. Công trình của ông cảnh báo về rủi ro "nhân cách hóa vô thức" và "khai thác phần thưởng xã hội", nơi AI tìm cách làm hài lòng người dùng bằng mọi giá, thậm chí góp phần vào một vụ tự tử liên quan đến Gemini. Tuy nhiên, ảnh hưởng của triết học bị thách thức bởi tốc độ phát triển chóng mặt và cuộc chạy đua thương mại khốc liệt, với khoản đầu tư 6700 tỷ USD. Điều kiện cấm sử dụng quân sự khi DeepMind được Google mua lại đã bị phá vỡ. Người sáng lập Demis Hassabis thừa nhận sự phát triển thiếu suy ngẫm triết học. Gabriel chuyển trọng tâm sang nghiên cứu tác động hệ thống của AGI, so sánh với Cách mạng Công nghiệp. Cuối cùng, hành trình của ông tại DeepMind phản ánh một câu hỏi cơ bản hơn: AI buộc chúng ta phải đặt lại câu hỏi về chính bản chất con người.

marsbit1 giờ trước

Nhà triết học AI đầu tiên trên thế giới, 9 năm tại Google DeepMind: Chạy đôn đáo vì an toàn AGI

marsbit1 giờ trước

Điểm danh 8 dự án 'bò tiền mặt' trong thị trường gấu: Dự án lớn nhất mua lại 283 triệu USD trong năm

Tổng quan 8 dự án tiền mã hóa "bò tiền mặt" hàng đầu trong thị trường giá xuống: Dự án dẫn đầu đã mua lại 283 triệu USD token trong năm nay. Trong bối cảnh thị trường tiền mã hóa suy thoái, một số dự án vẫn thể hiện khả năng tạo dòng tiền mạnh mẽ thông qua cơ chế mua lại và đốt token. Theo thống kê từ Tokenomist, 8 dự án gồm Hyperliquid (HYPE), Meteora (MET), Pump.fun (PUMP), GMX, Rollbit (RLB), Metaplex (MPLX), Lighter (LIT) và Aave (AAVE) đã có quy mô mua lại token vượt xa mức tăng nguồn cung lưu thông kể từ tháng 1. Đáng chú ý, Hyperliquid dẫn đầu với số tiền mua lại lên tới 283 triệu USD, tương đương 3% nguồn cung token của họ, trong khi nguồn cung lại giảm 11%. Meteora có tác động lớn nhất đến nguồn cung lưu thông, với tỷ lệ mua lại đạt 71% so với nguồn cung đầu năm, dù nguồn cung chỉ tăng 13%. Các dự án khác như Pump.fun đã mua lại hơn 71 triệu USD token PUMP, còn Aave đã mua lại hơn 20 triệu token AAVE. Các cơ chế mua lại này thường được tài trợ bởi doanh thu phí giao dịch hoặc thu nhập ròng của giao thức, nhằm mục đích giảm nguồn cung lưu thông và hỗ trợ giá trị token. Tuy nhiên, hiệu quả cuối cùng đối với giá token còn phụ thuộc vào nhiều yếu tố thị trường khác. Dù vậy, trong môi trường thị trường ảm đạm, khả năng tạo ra dòng tiền ổn định đã khiến những dự án này trở thành những "cỗ máy hút tiền" hiếm hoi.

marsbit1 giờ trước

Điểm danh 8 dự án 'bò tiền mặt' trong thị trường gấu: Dự án lớn nhất mua lại 283 triệu USD trong năm

marsbit1 giờ trước

Giao dịch

Giao ngay

Bài viết Nổi bật

Làm thế nào để Mua HYPE

Chào mừng bạn đến với HTX.com! Chúng tôi đã làm cho mua Hyperliquid (HYPE) trở nên đơn giản và thuận tiện. Làm theo hướng dẫn từng bước của chúng tôi để bắt đầu hành trình tiền kỹ thuật số của bạn.Bước 1: Tạo Tài khoản HTX của BạnSử dụng email hoặc số điện thoại của bạn để đăng ký tài khoản miễn phí trên HTX. Trải nghiệm hành trình đăng ký không rắc rối và mở khóa tất cả tính năng. Nhận Tài khoản của tôiBước 2: Truy cập Mua Crypto và Chọn Phương thức Thanh toán của BạnThẻ Tín dụng/Ghi nợ: Sử dụng Visa hoặc Mastercard của bạn để mua Hyperliquid (HYPE) ngay lập tức.Số dư: Sử dụng tiền từ số dư tài khoản HTX của bạn để giao dịch liền mạch.Bên thứ ba: Chúng tôi đã thêm những phương thức thanh toán phổ biến như Google Pay và Apple Pay để nâng cao sự tiện lợi.P2P: Giao dịch trực tiếp với người dùng khác trên HTX.Thị trường mua bán phi tập trung (OTC): Chúng tôi cung cấp những dịch vụ được thiết kế riêng và tỷ giá hối đoái cạnh tranh cho nhà giao dịch.Bước 3: Lưu trữ Hyperliquid (HYPE) của BạnSau khi mua Hyperliquid (HYPE), lưu trữ trong tài khoản HTX của bạn. Ngoài ra, bạn có thể gửi đi nơi khác qua chuyển khoản blockchain hoặc sử dụng để giao dịch những tiền kỹ thuật số khác.Bước 4: Giao dịch Hyperliquid (HYPE)Giao dịch Hyperliquid (HYPE) dễ dàng trên thị trường giao ngay của HTX. Chỉ cần truy cập vào tài khoản của bạn, chọn cặp giao dịch, thực hiện giao dịch và theo dõi trong thời gian thực. Chúng tôi cung cấp trải nghiệm thân thiện với người dùng cho cả người mới bắt đầu và người giao dịch dày dạn kinh nghiệm.

Tổng lượt xem 512Xuất bản vào 2024.12.11Cập nhật vào 2026.06.02

Làm thế nào để Mua HYPE

Thảo luận

Chào mừng đến với Cộng đồng HTX. Tại đây, bạn có thể được thông báo về những phát triển nền tảng mới nhất và có quyền truy cập vào thông tin chuyên sâu về thị trường. Ý kiến ​​của người dùng về giá của HYPE (HYPE) được trình bày dưới đây.

活动图片