Executive Summary
- Bitcoin has entered a correction phase, trading -11% below its ATH of $108k but remaining above key support levels, retaining a constructive market structure.
- Z-Score analysis suggests cyclical highs typically align with various metrics trading 1.5 to 2.0σ above the mean, offering a framework to help navigate bullish market phases.
- Bitcoin's current price is around 10% above the Short-Term Holders' cost basis of $88.4k, underscoring a potential risk of downside if momentum stalls and price trades below this level.
- Unrealized losses are concentrated among short-term holders, with 2.0–3.5M BTC held underwater, reflecting moderate stress in the market.
- Relative Unrealized Losses peaked at 4.3% during Q3 2024, significantly lower than prior cycles driven by external shocks, highlighting a more spot-driven and patient market.
Evolving Peaks
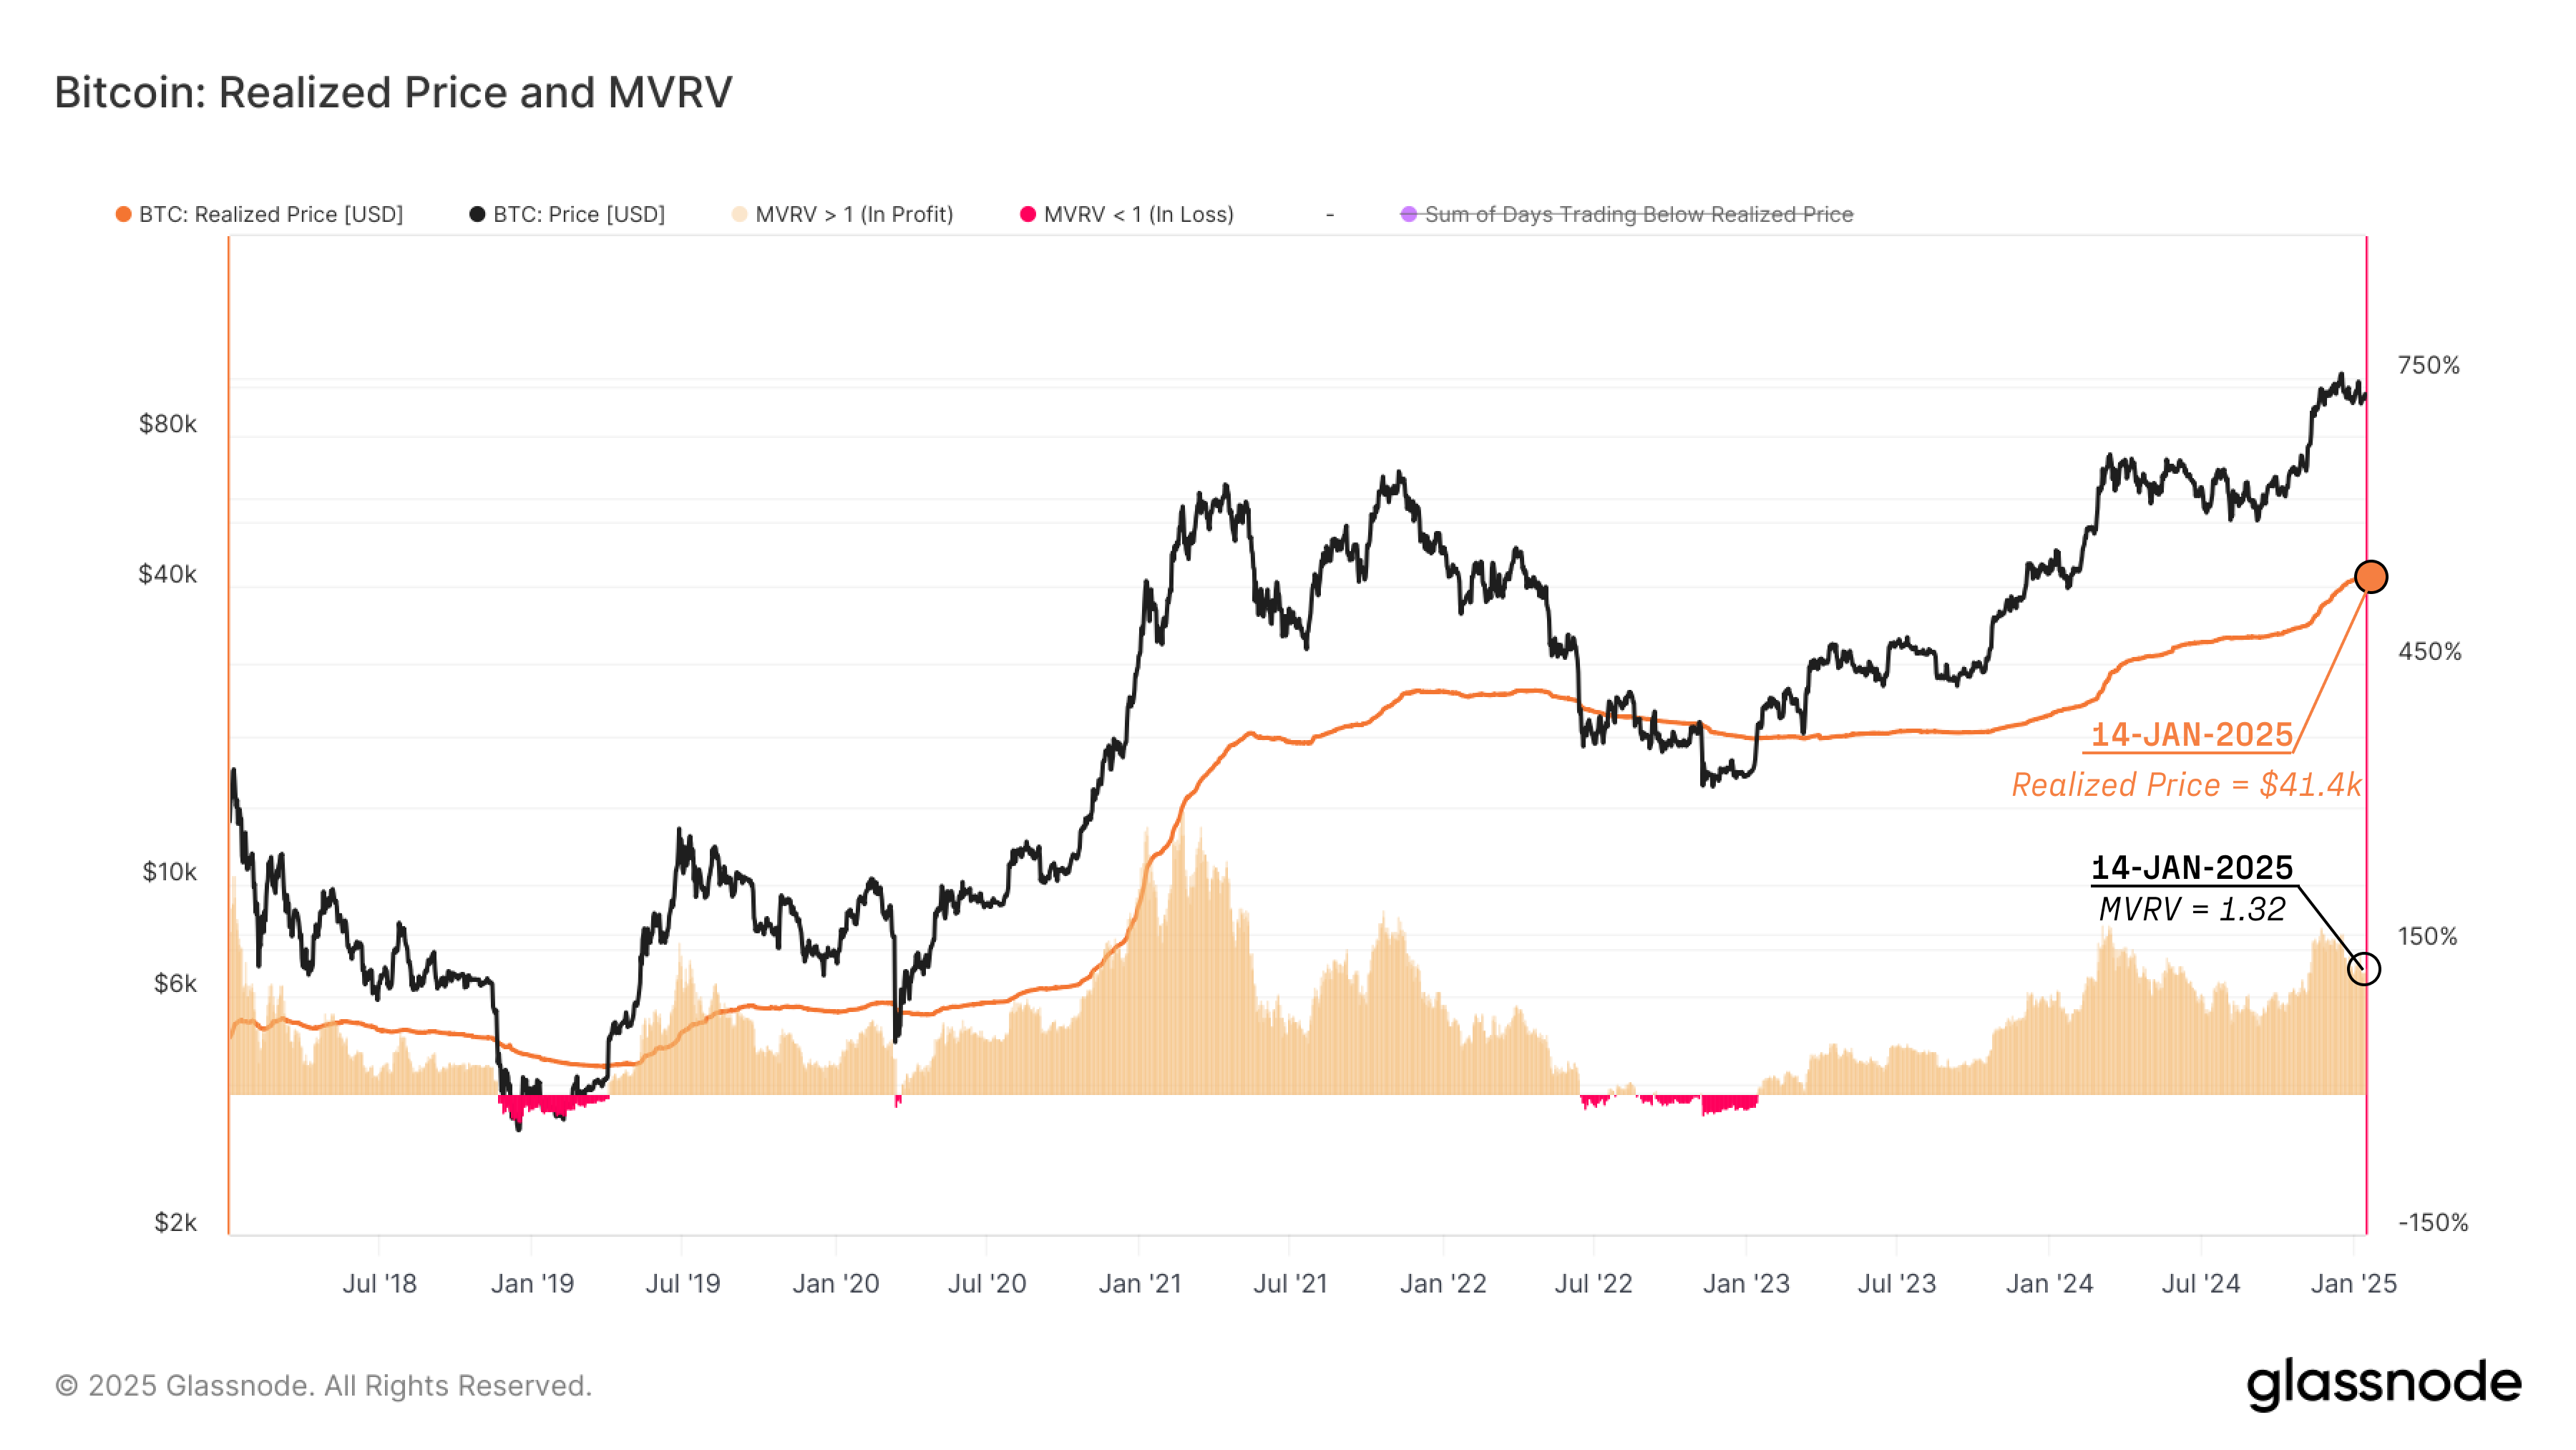
The Realized Price reflects the average price at which all Bitcoins last moved on-chain, thus representing the market's aggregate cost basis. The MVRV Ratio is the ratio between the spot price, and the realized price, and it gauges the magnitude of unrealized profit held on average. Values above 1 signal an average unrealized profit, and trading below 1 indicate an unrealized loss.
The MVRV ratio is currently trading at 1.32, indicating the average unit of BTC is holding an unrealized profit of 32%. This structure is similar to post-ATH in mid-April 2024, suggesting an overall undertone of positive sentiment despite the market correction.
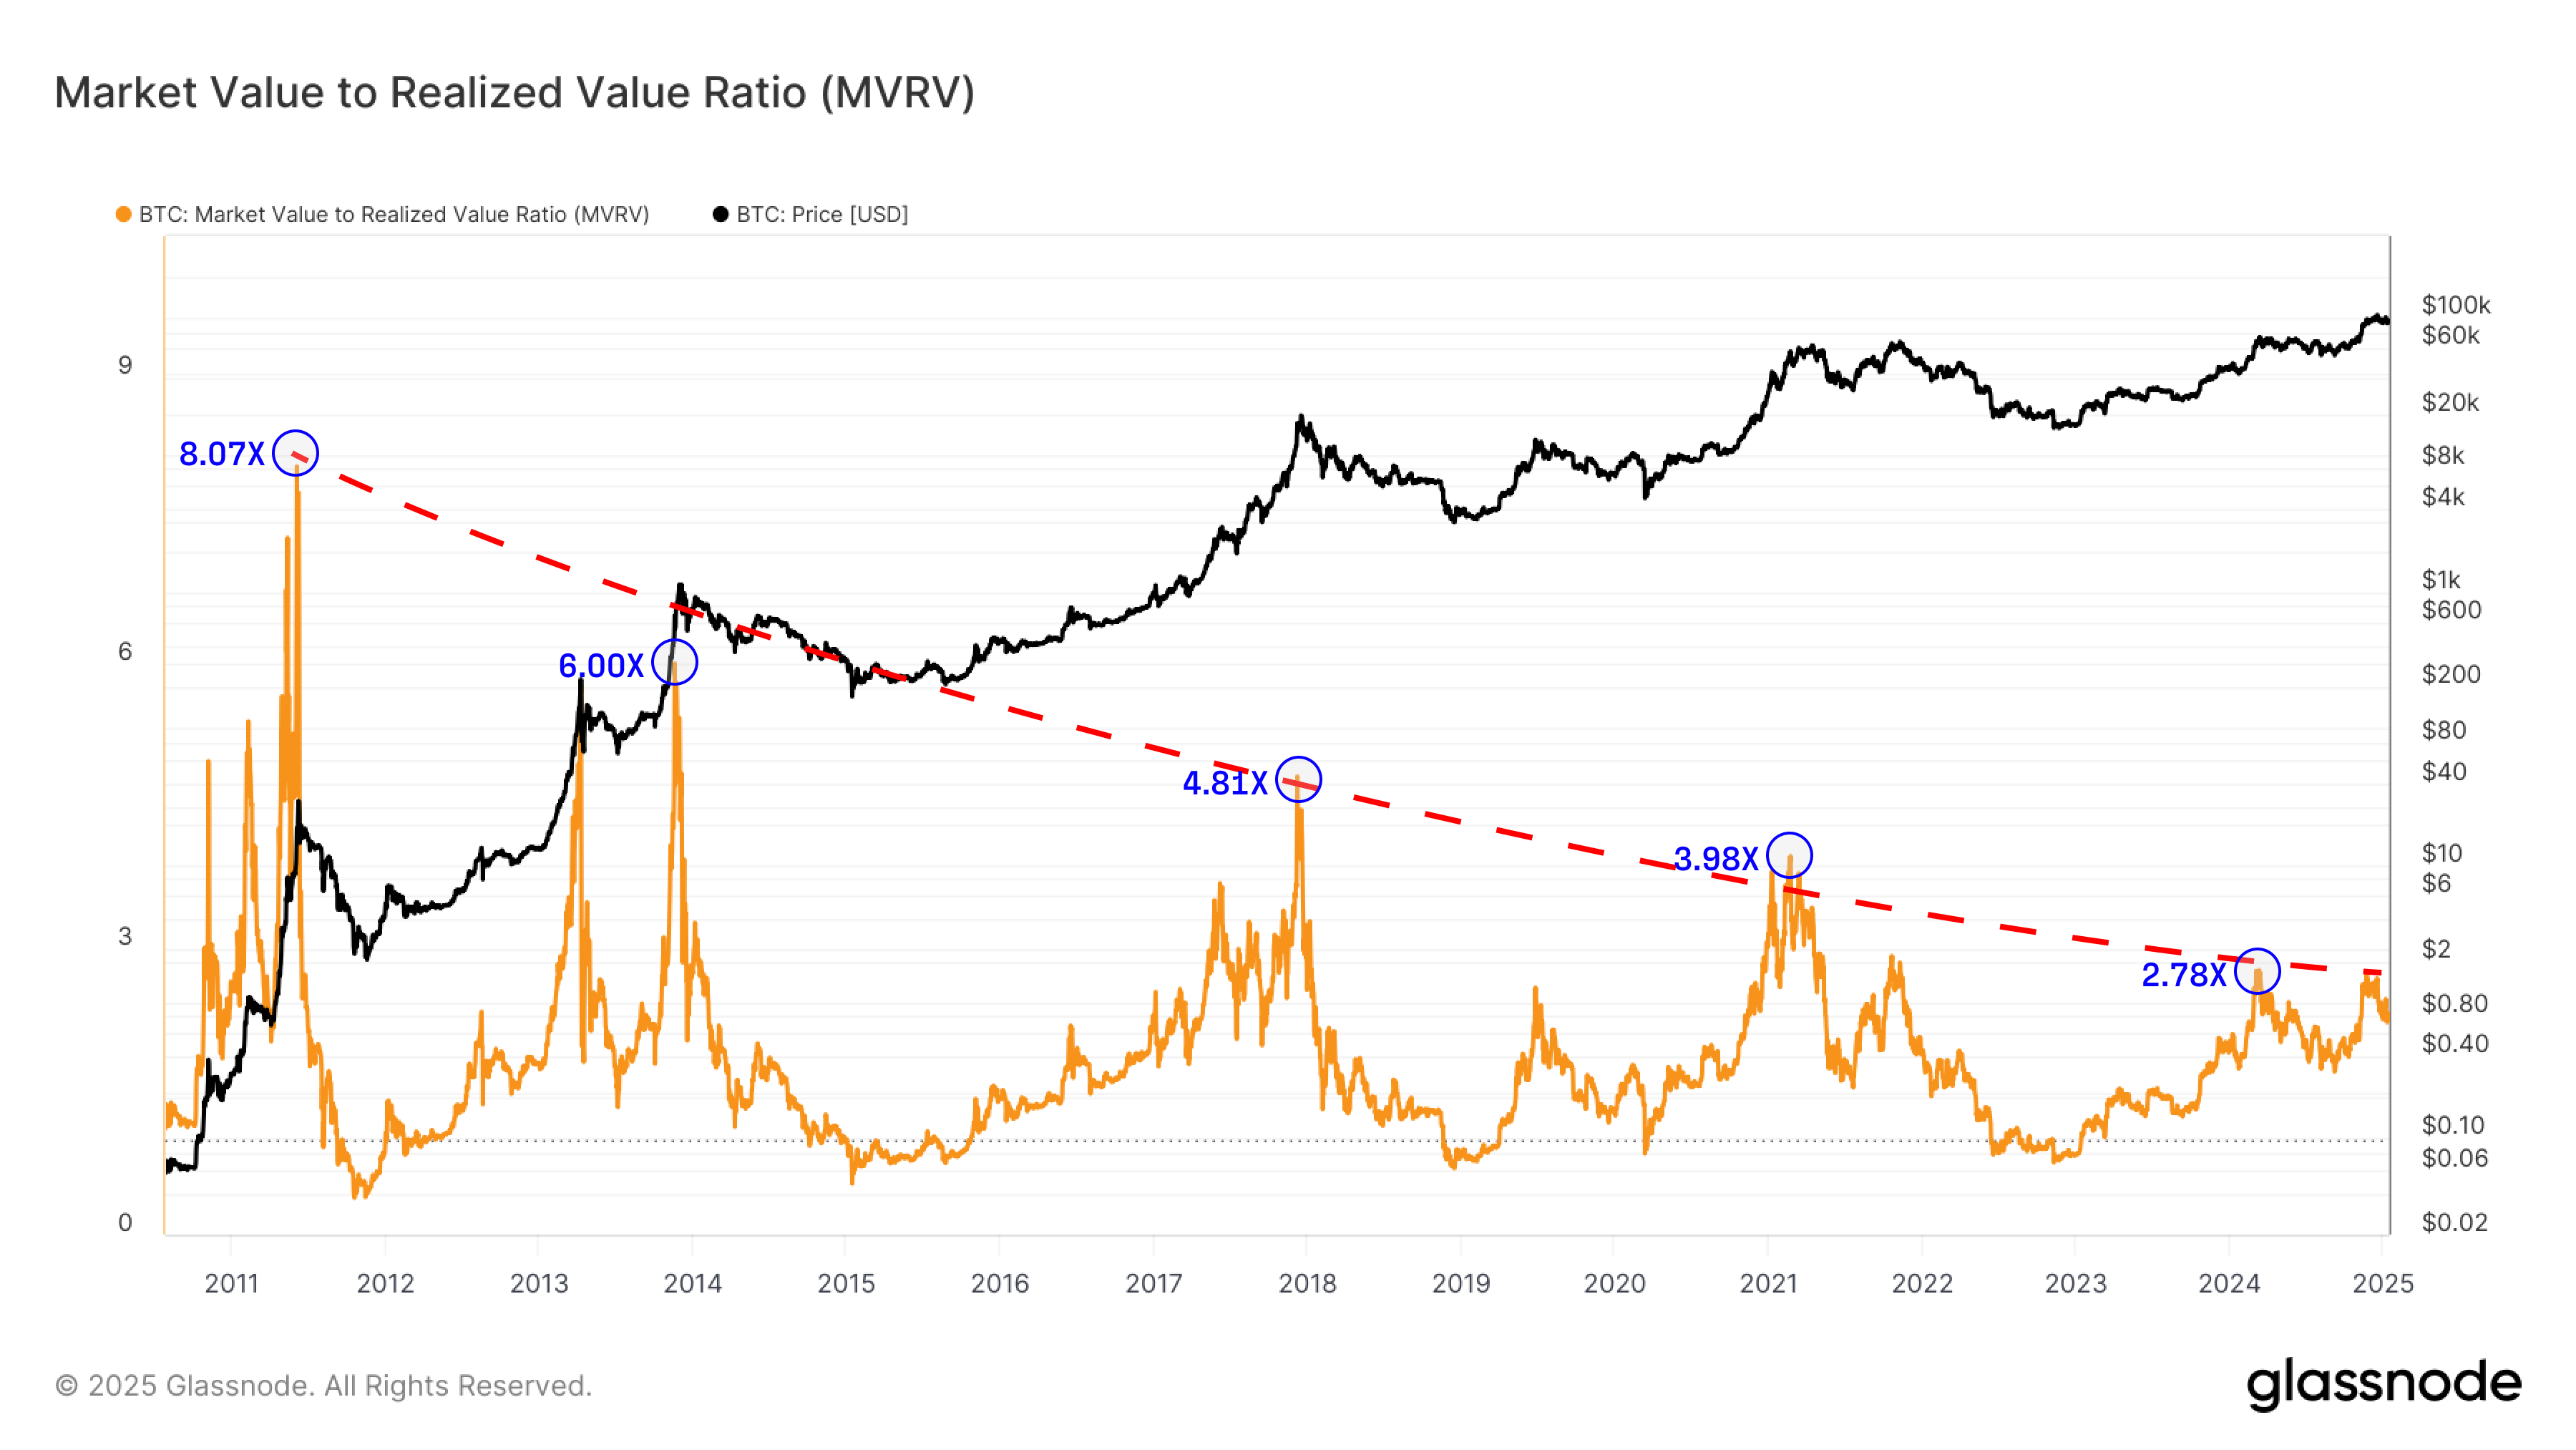
Over the years, Bitcoin's market has matured, which is accompanied by a cyclical decay in the peak values of MVRV near cyclical tops. This reflects an overall dampening of speculative extremes as the asset grows in size.
Each market cycle has seen progressively lower MVRV highs, signalling lower average unrealized profit multiples being reached:
- 2011: 8.07x
- 2014: 6.00x
- 2018: 4.81x
- 2021: 3.98x
- 2024: 2.78x (to date)
This decline describes a gradual reduction in volatility and speculative intensity as the market grows in scale and liquidity. It also suggests that, whilst Bitcoin remains cyclical, each peak becomes relatively less exaggerated, aligning with a more mature and efficient market structure.
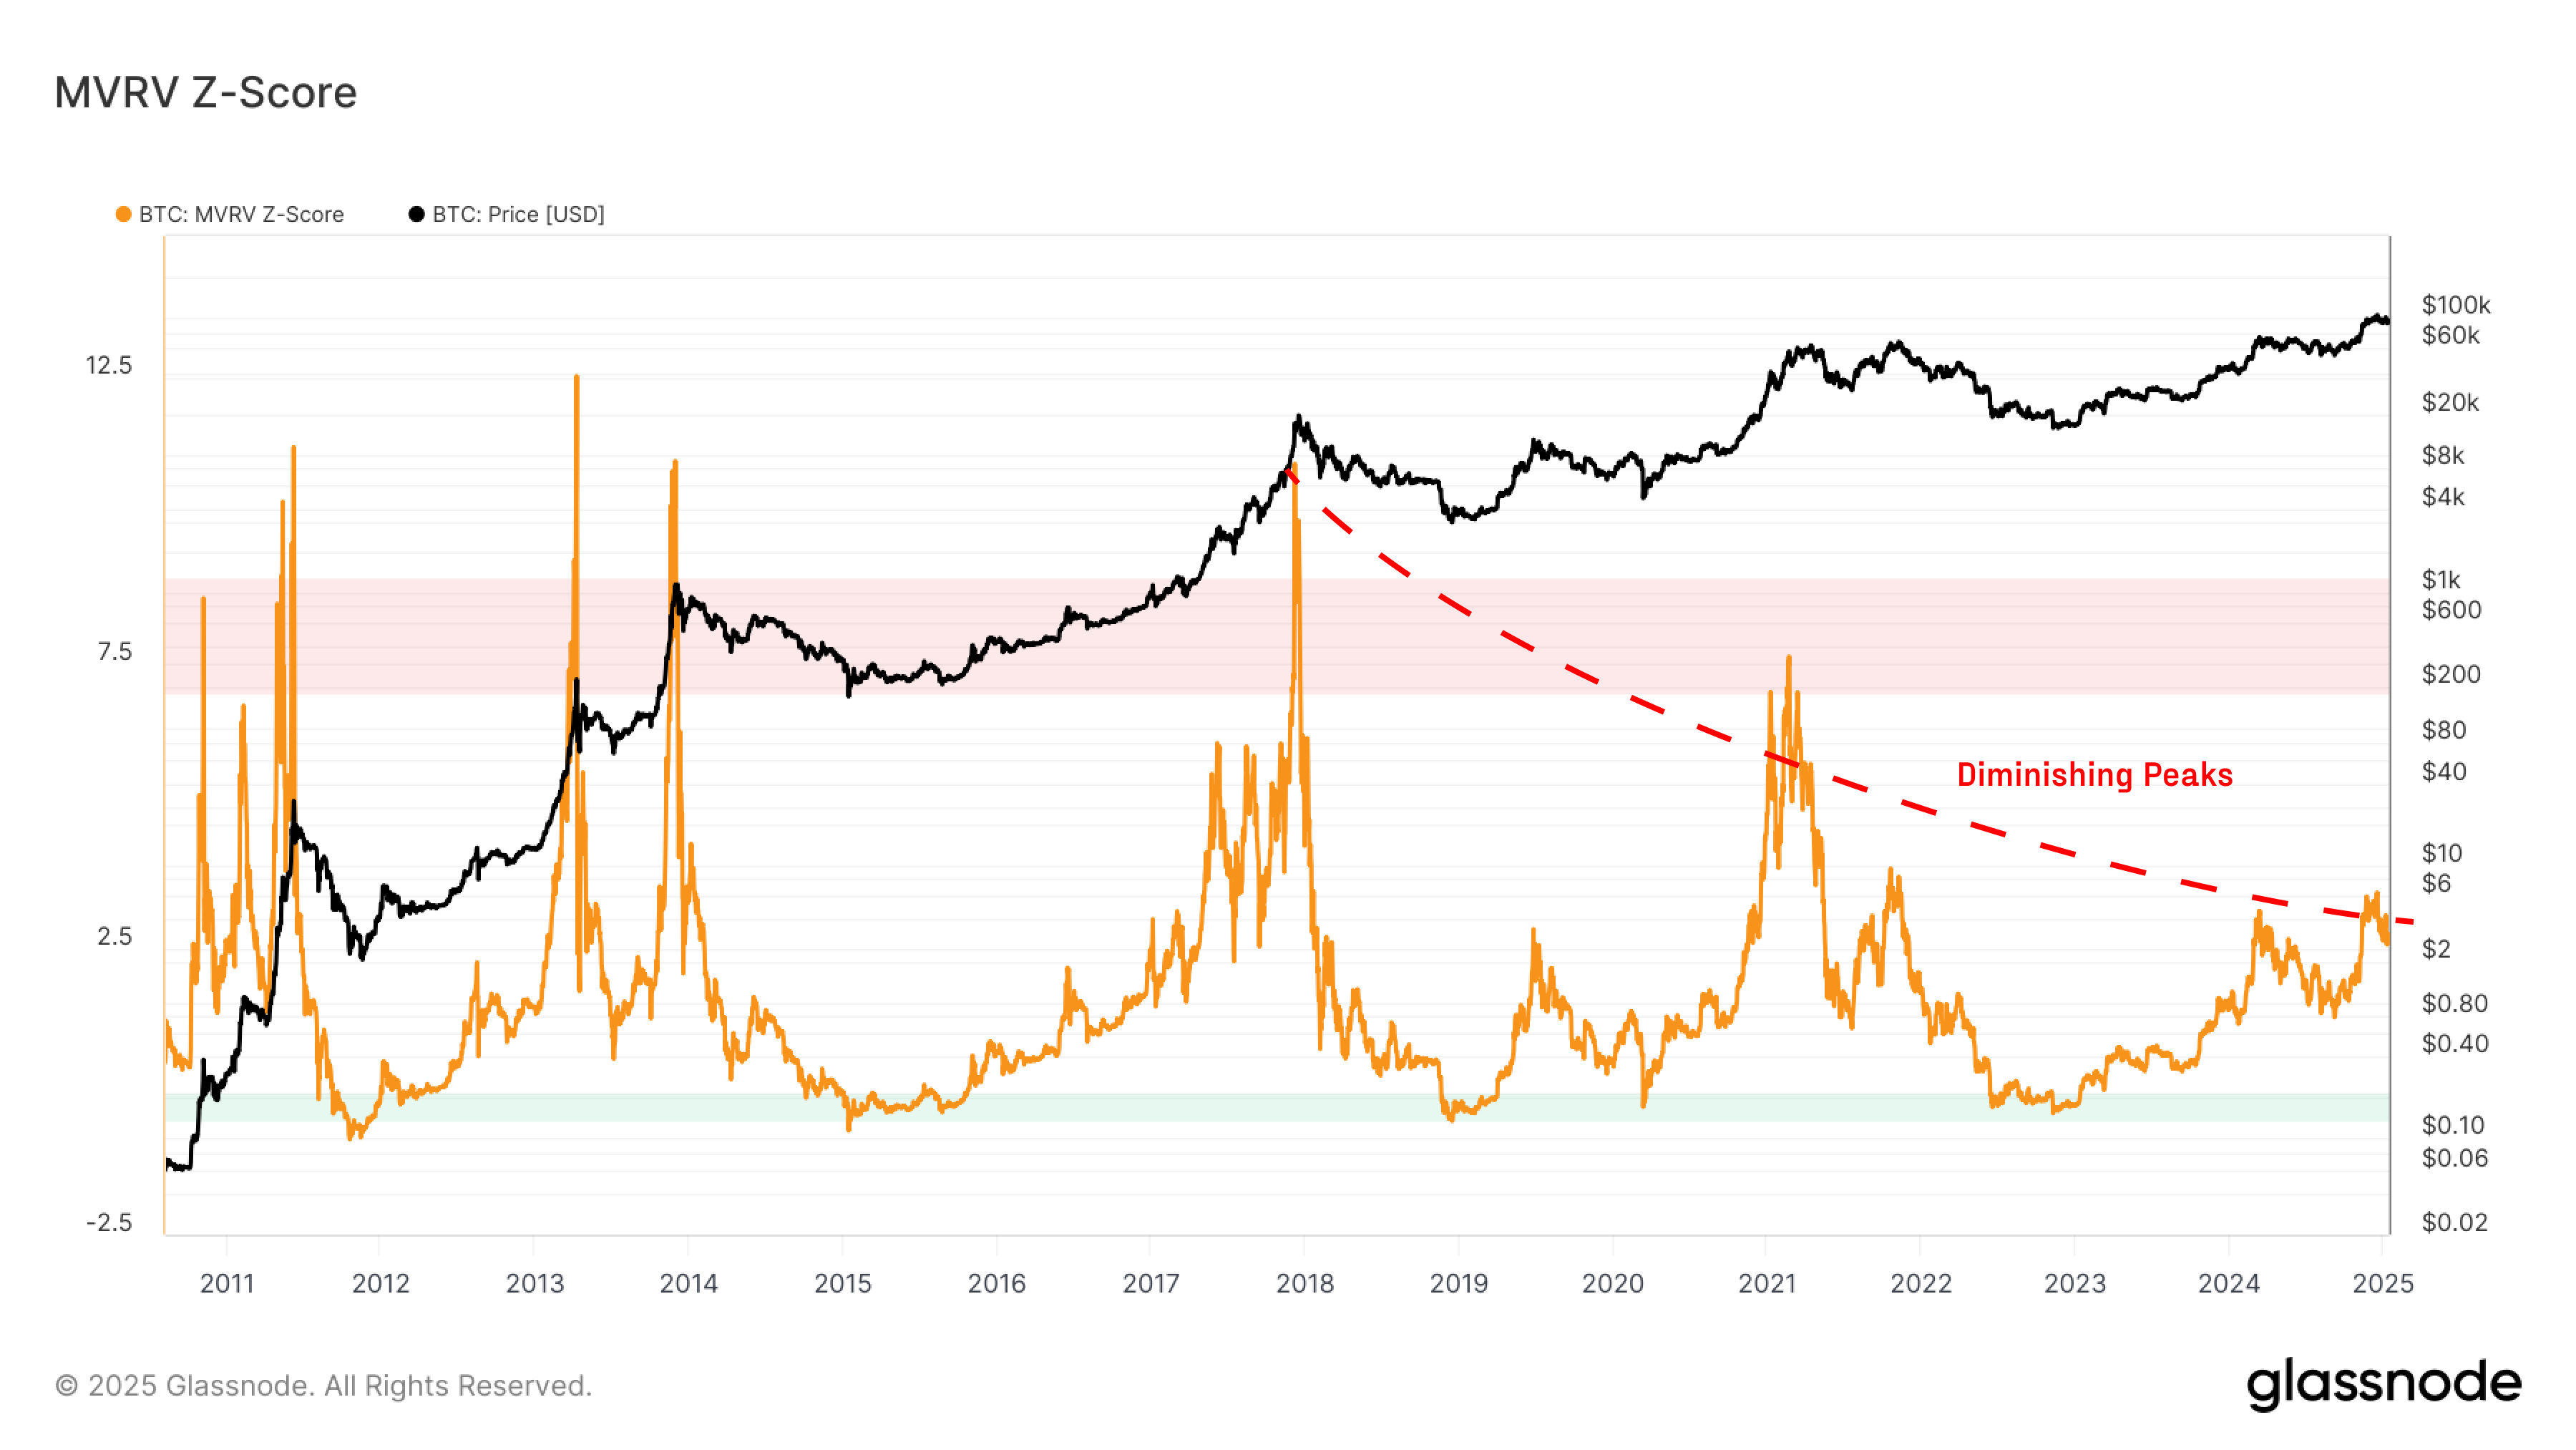
To account for the diminishing peaks in MVRV over successive cycles, we can employ statistical methods to normalize its oscillating range. One such widely accepted approach in financial time series analysis is the Z-Score, calculated using the formula:
Z-Score = (X - μ) / σ
Where:
- X is the observed value,
- μ is the mean,
- σ is the standard deviation.
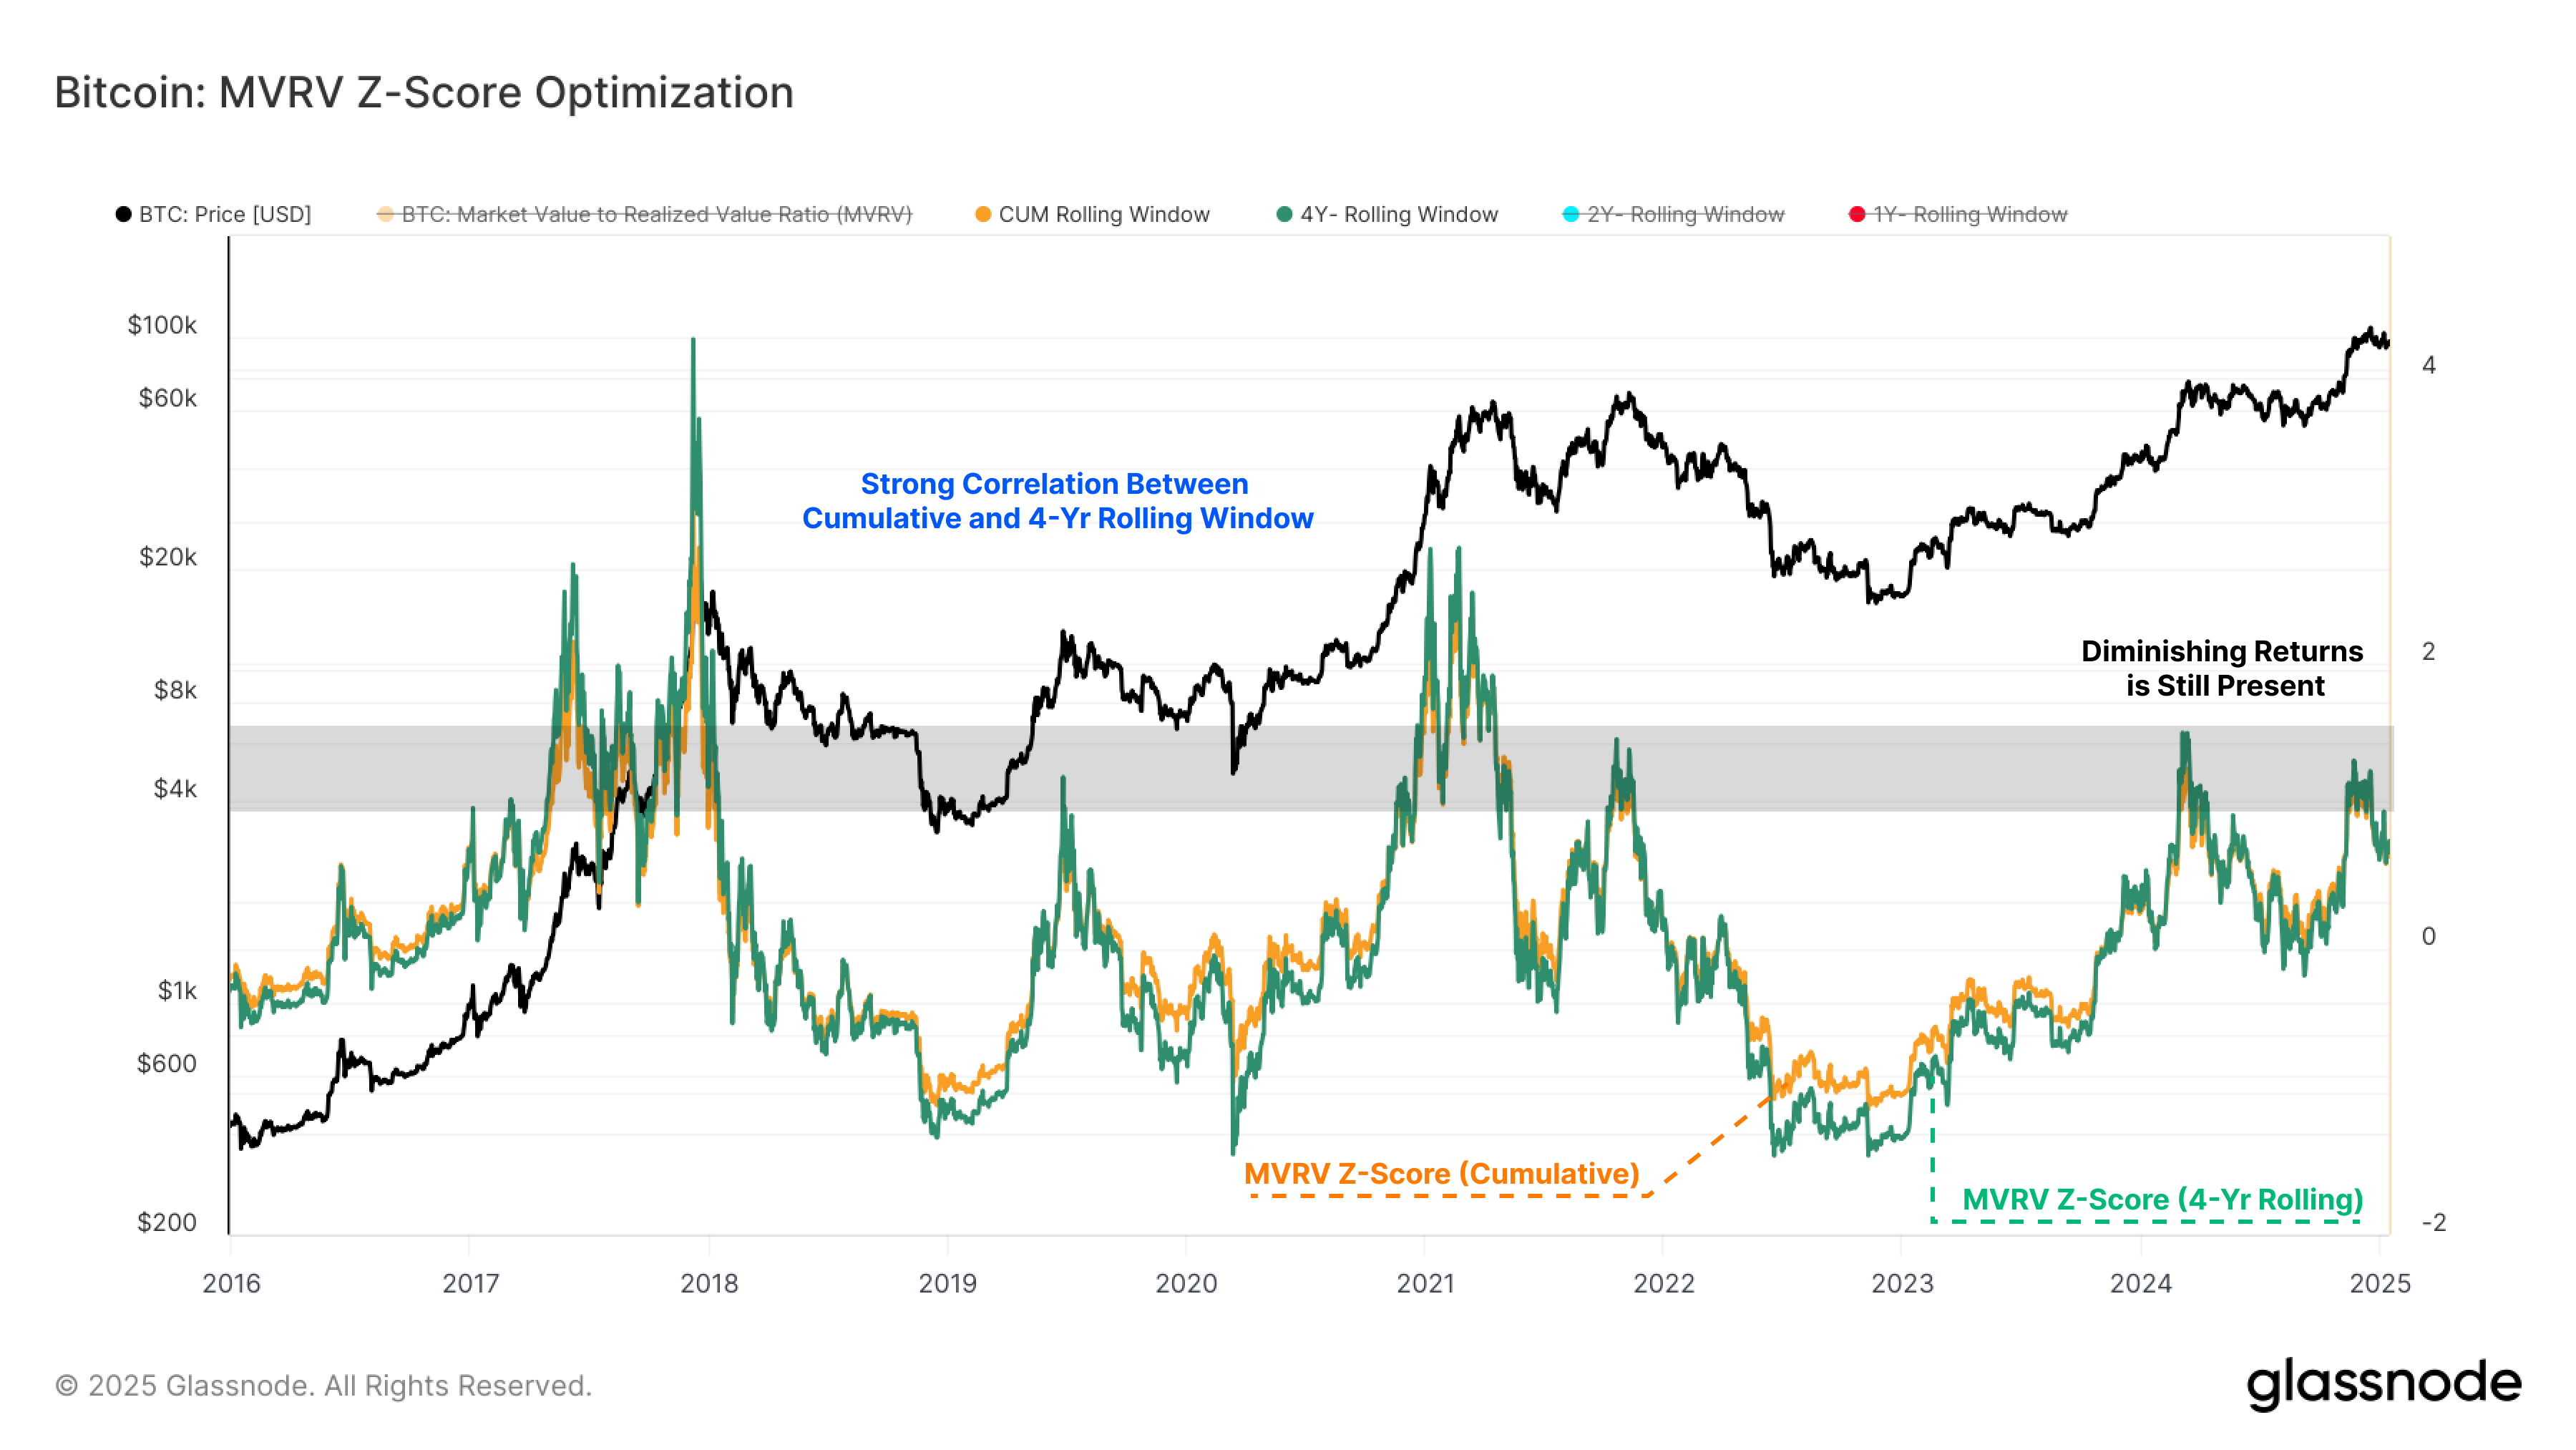
In calculating the Z-Score, we can either use the entire historical dataset for a cumulative view or adopt a shorter rolling window to better capture the dynamic nature of financial cycles and diminishing peaks in MVRV.
Using the entire historical data for the MVRV Z-Score transformation can lead to some distorted results, as earlier cycles with much higher peaks skew the mean and standard deviation, making them less reflective of current market conditions.
Therefore, in an attempt to account for these effects, we have optimized the rolling window by reducing its length and thus using more recent market history as our benchmark.
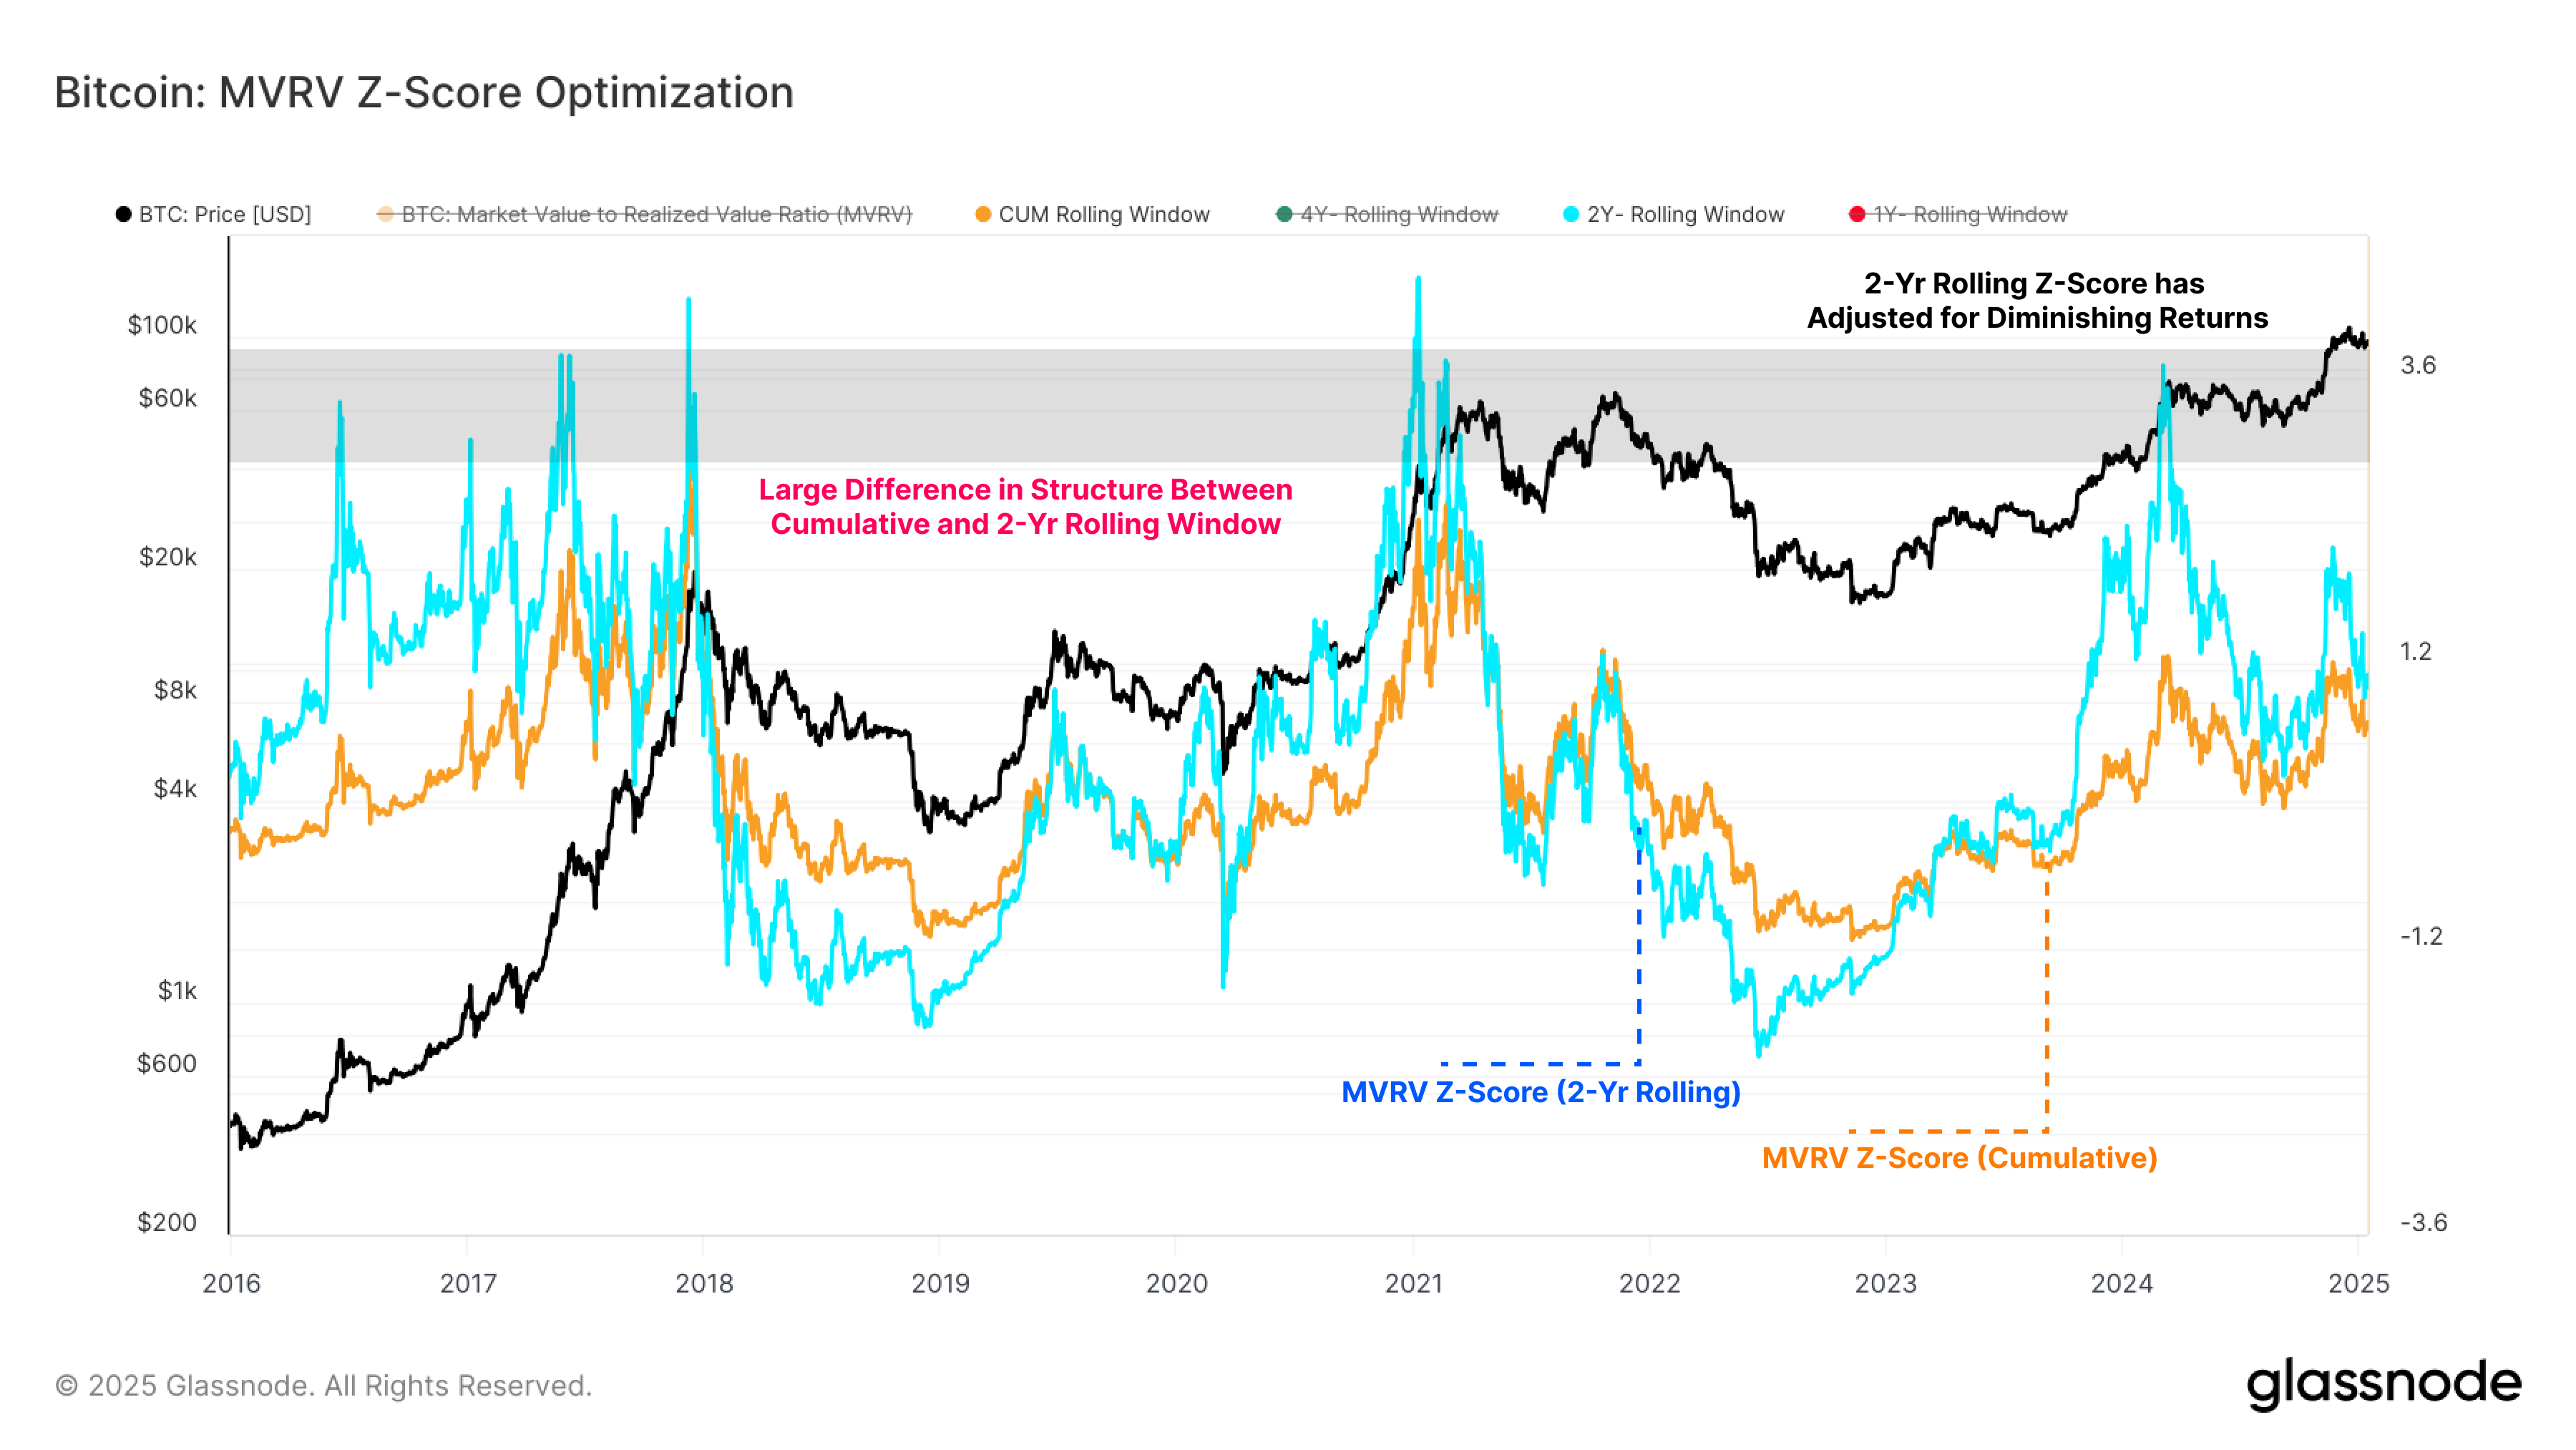
The chart below compares the cumulative Z-Score with a version calculated using a 4-year rolling window. Despite this attempt to adapt to the dynamic nature of market cycles, the results remain nearly identical, and the issue of decaying peaks in MVRV persists unresolved.
Moving to a 2-year rolling window for the Z-Score calculation (blue), the peak observed in the most recent cycle ATH in March 2024 aligns closely with the peak ranges of the previous two cycles.
In this instance, we have now adjusted for the diminishing MVRV peaks. However, significant market highs in Q4 2015, Q3 2019, and Q2 2023 are not flagged by the 2-year rolling window Z-Score, suggesting there may be further optimization potential.
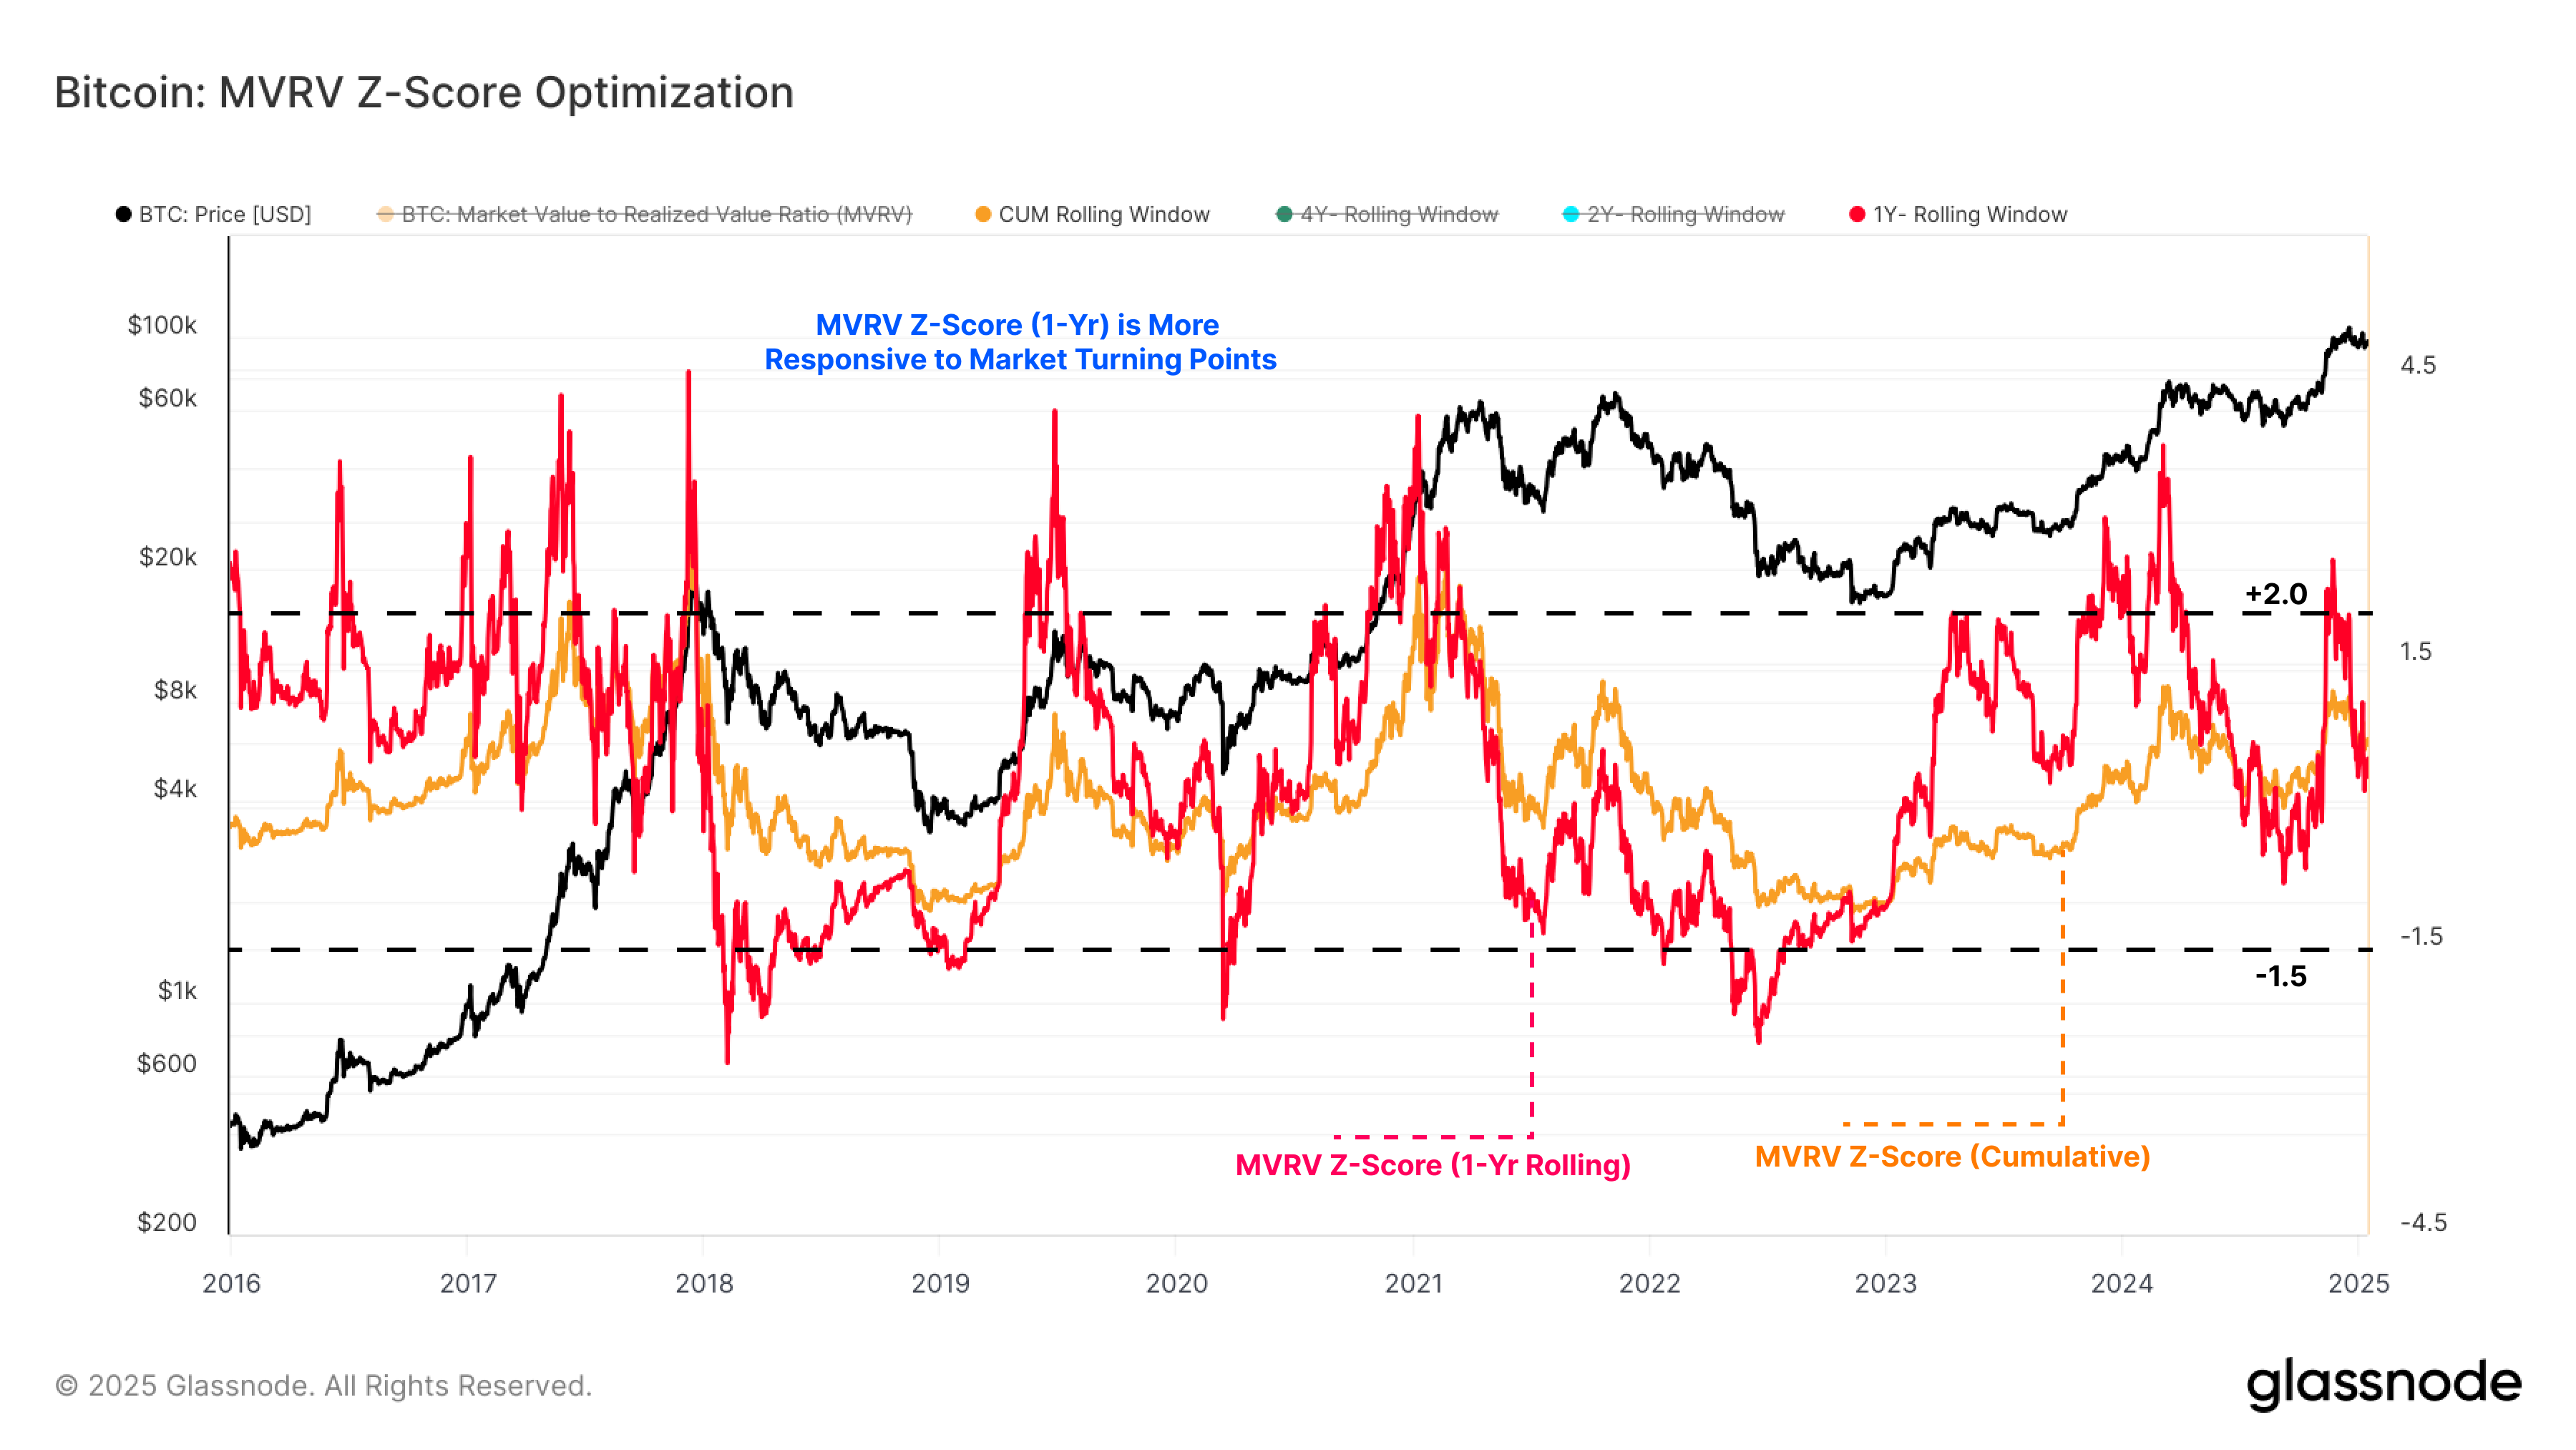
Finally, we have applied a 1-year rolling window to the Z-Score calculation, resulting in a more refined and promising transformation. This approach works to identify both the mid-cycle and late-cycle peaks on a similar scale, offering a clearer representation of near-term market dynamics.
This 1yr MVRV Z-score reveals that cyclical bulls consistently reach local and global peaks 2σ range, where investor profitability has increased significantly over a relatively short period of time. During bear market phases, local and global lows are captured when MVRV trades -1.5σ from the mean.
This improved MVRV Z-Score may provide a more responsive framework for identifying key market turning points throughout the cycle and helps adjust for the overall diminishing peaks near the extremes.
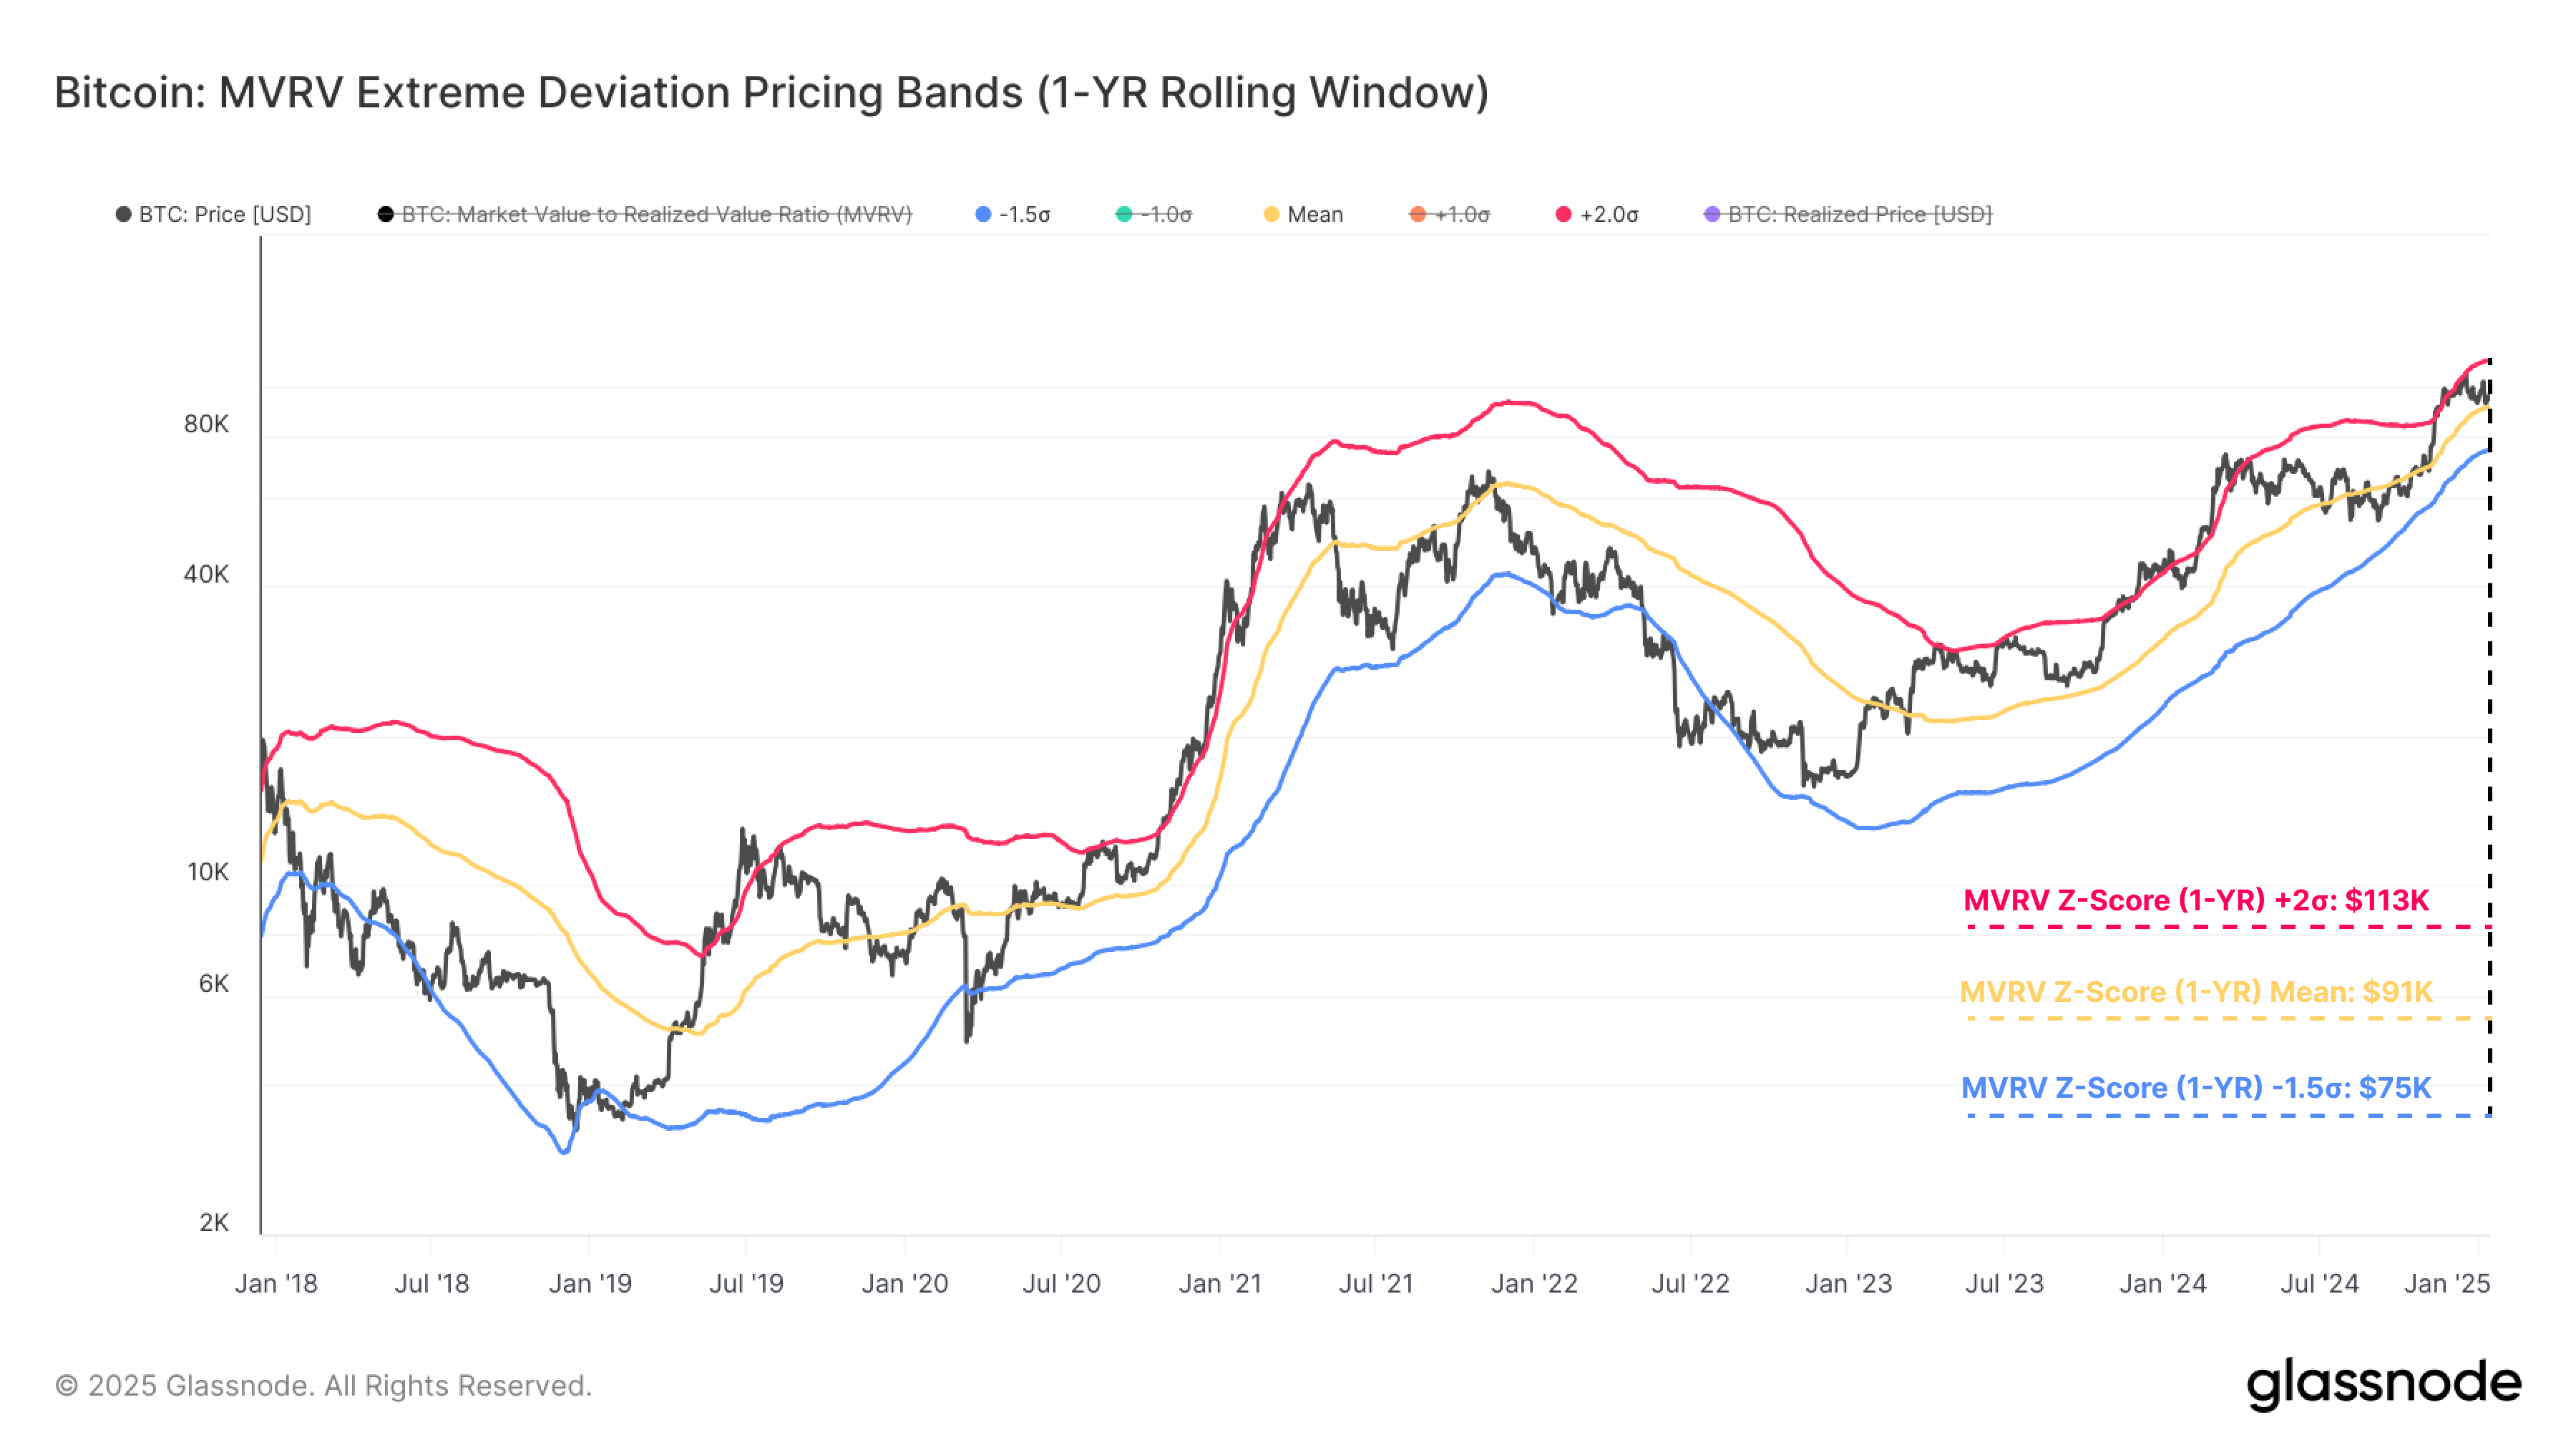
Now that we have optimized the rolling window to 1yr, we can extend this framework to back-calculate the threshold price levels which would define these near-term peaks and troughs.
Bull markets are characterized by prices trading between the 1-year mean, and peaking around 2σ above it. Conversely, bear markets see prices remain below the mean, with significant lows occurring near -1.5σ. This structured approach allows for a clearer delineation of market phases.
Currently, Bitcoin is trading at $94,398, positioned above the 1-year mean of $90.9k but below the +2σ threshold at $112.6k. This suggests the market remains in a bullish phase, though it has retreated slightly from recent euphoric levels, which were above the upper band at the time.
Assessing The Correction
With the 1-year MVRV Z-Score model showing the market cooling off from a powerful rally, we can now assess the state of investor profitability by measuring the unrealized losses held. This helps to gauge market participant incentives and identify key areas of risk to keep an eye on.
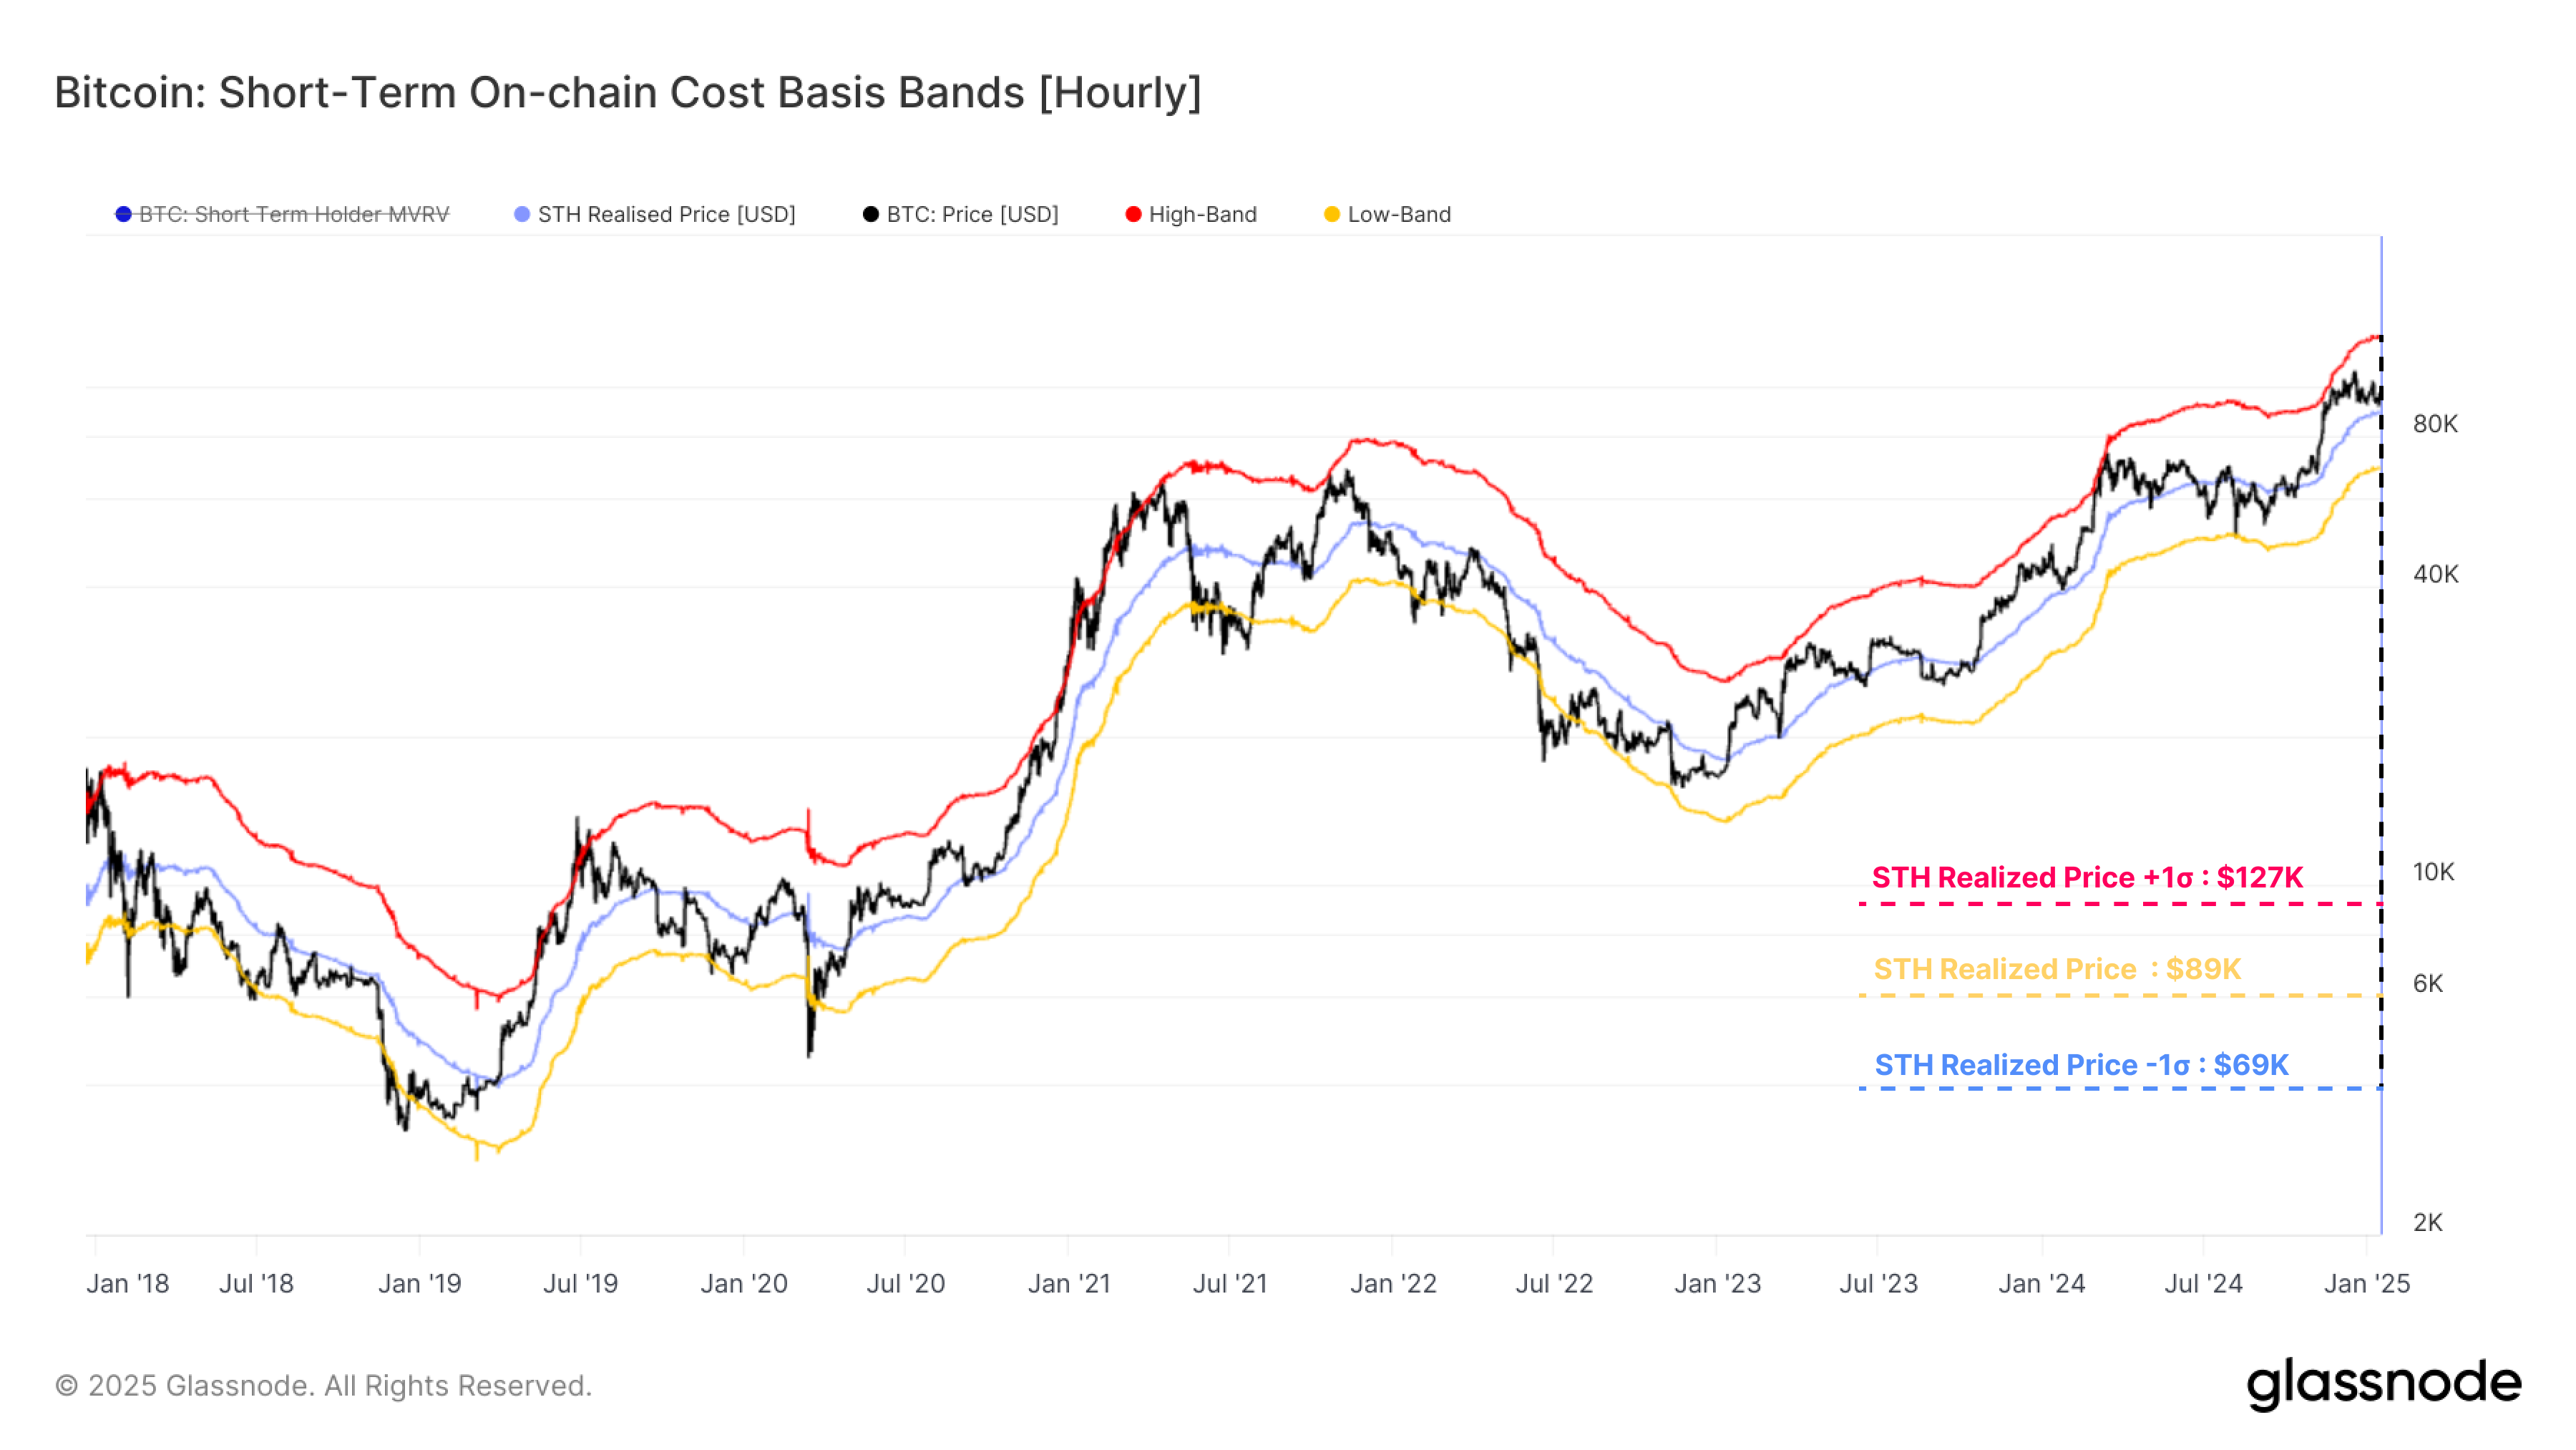
First, by analyzing the Entity-Adjusted Cost Basis Distribution of the circulating supply, it becomes clear that all unrealized losses are concentrated among short-term holders—investors who acquired their coins in the last 155-days, near the market peak.
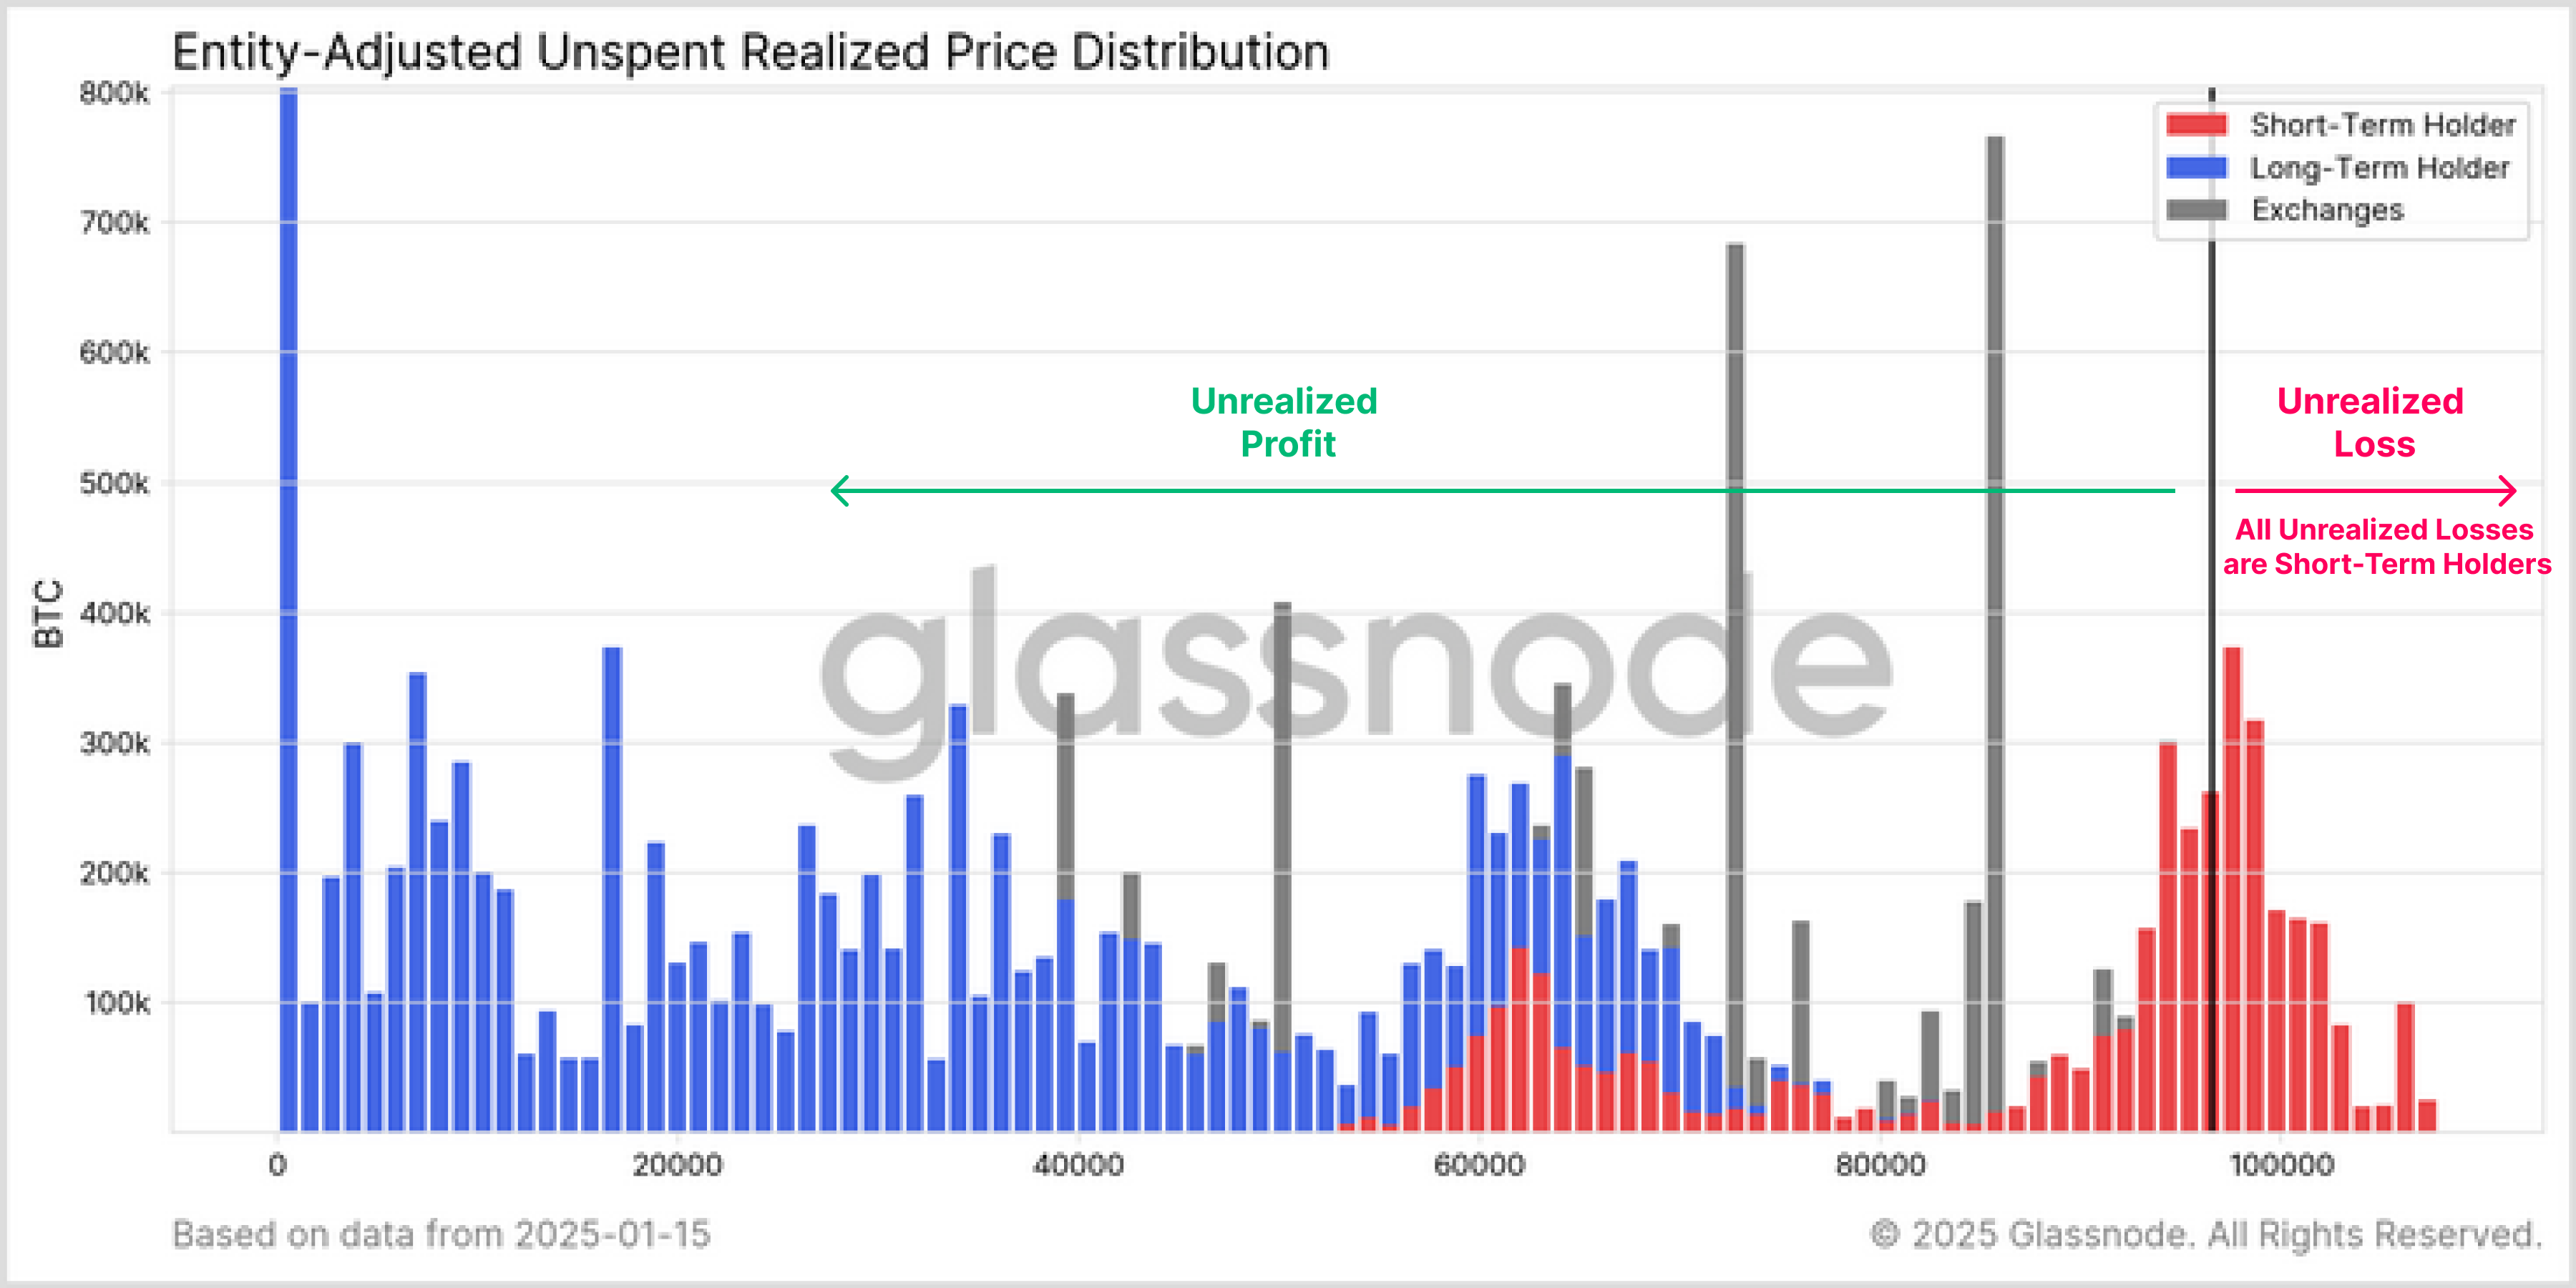
Focusing on short-term holders as potential sellers under pressure, if the current market drawdown deepens, we can look for areas where unrealized losses may become severe.
The average Short-Term Holder cost basis is currently trading at $88.4k. Based on a similar statistical approach covered above, we have also displayed a high ($125.5k) and low ($68.5k) band, representing typical limits of price action during bull and bear markets.
The spot price is currently trading 9.2% above the Short-Term Holder cost basis, indicating that the market is still within the norms of a typical bull market. However, if the market fails to regain upward momentum, there is a heightened chance that falling below the STH cost basis could precipitate near-term stress, and potentially additional sell-side out should investors start to panic.
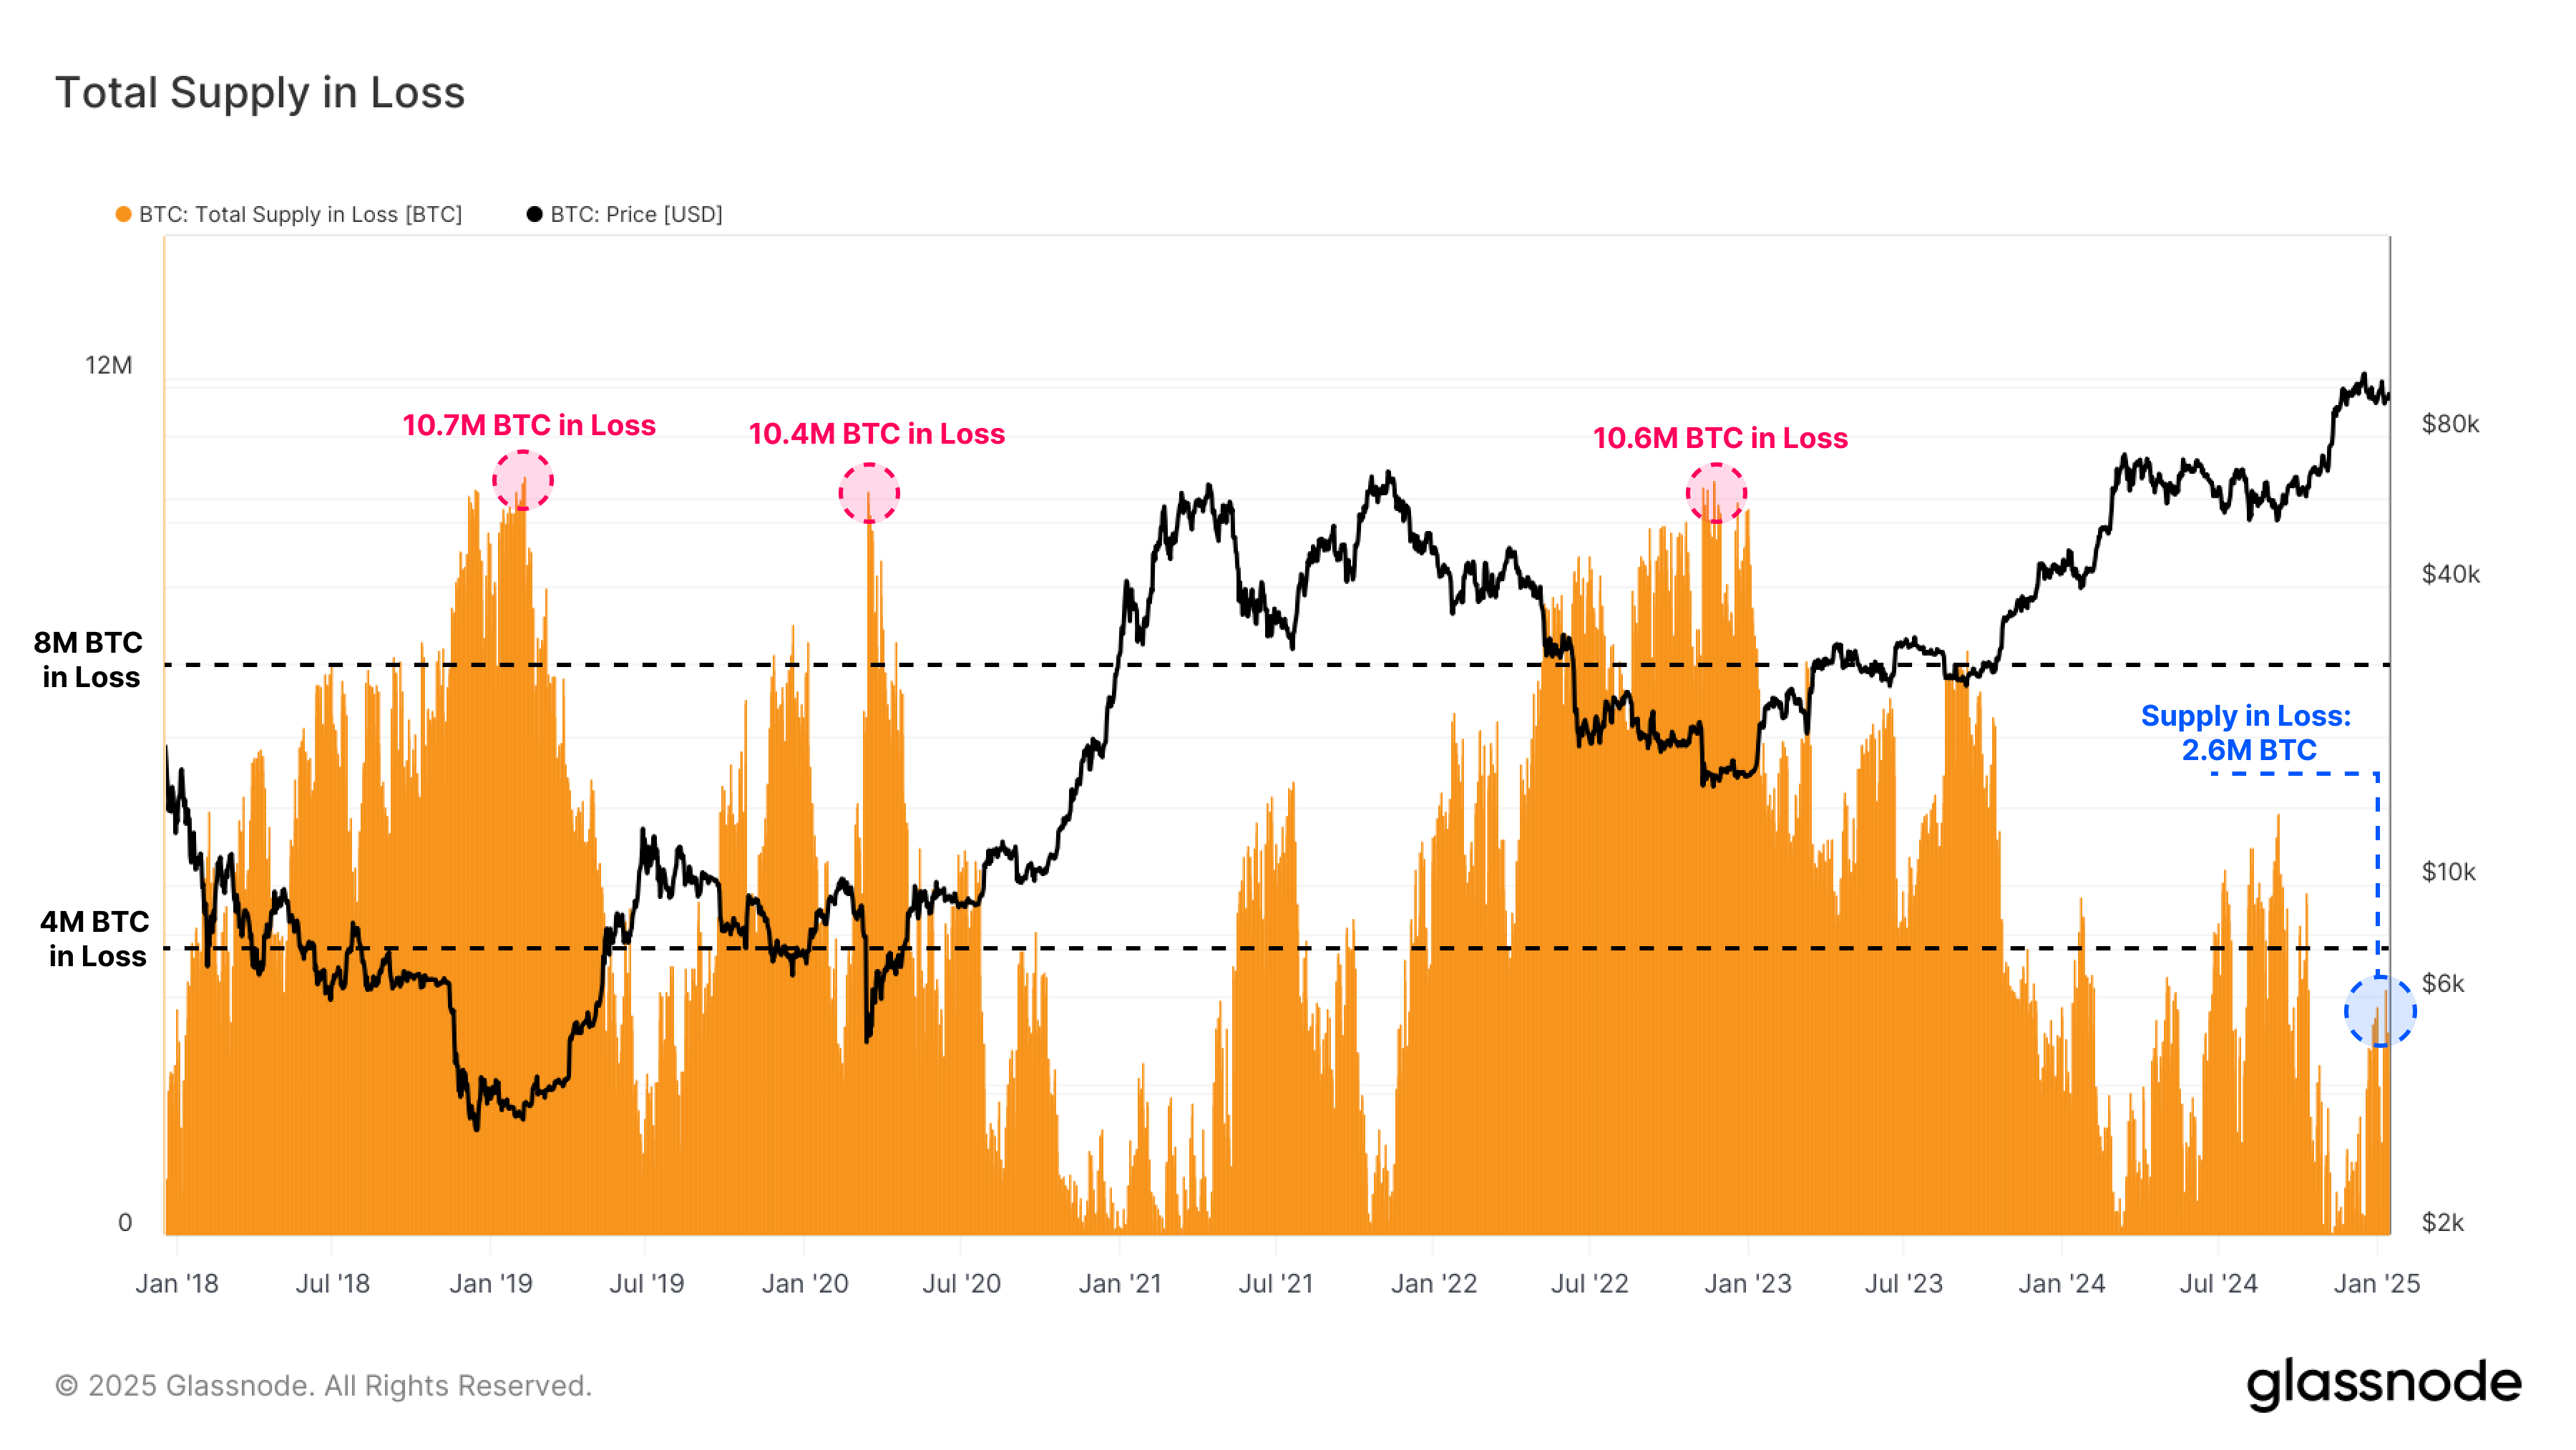
In order to better gauge the degree of stress experienced, we can assess the BTC supply, which is currently in a state of unrealized loss. From a historical perspective, over the last 10 years, we can observe that:
- During bull markets, the number of coins underwater has typically remained below 4 million.
- Early bear market stages have been marked by 4–8 million coins held in loss.
This week, the volatility in the market pushed between 2.0 and 3.5 million coins into loss. While significant, this range is still lower than the 4 million coins in loss during the local market low set between July and September 2024. This suggests that the current market is likely in a less distressed state than it was during the previous corrective phase.
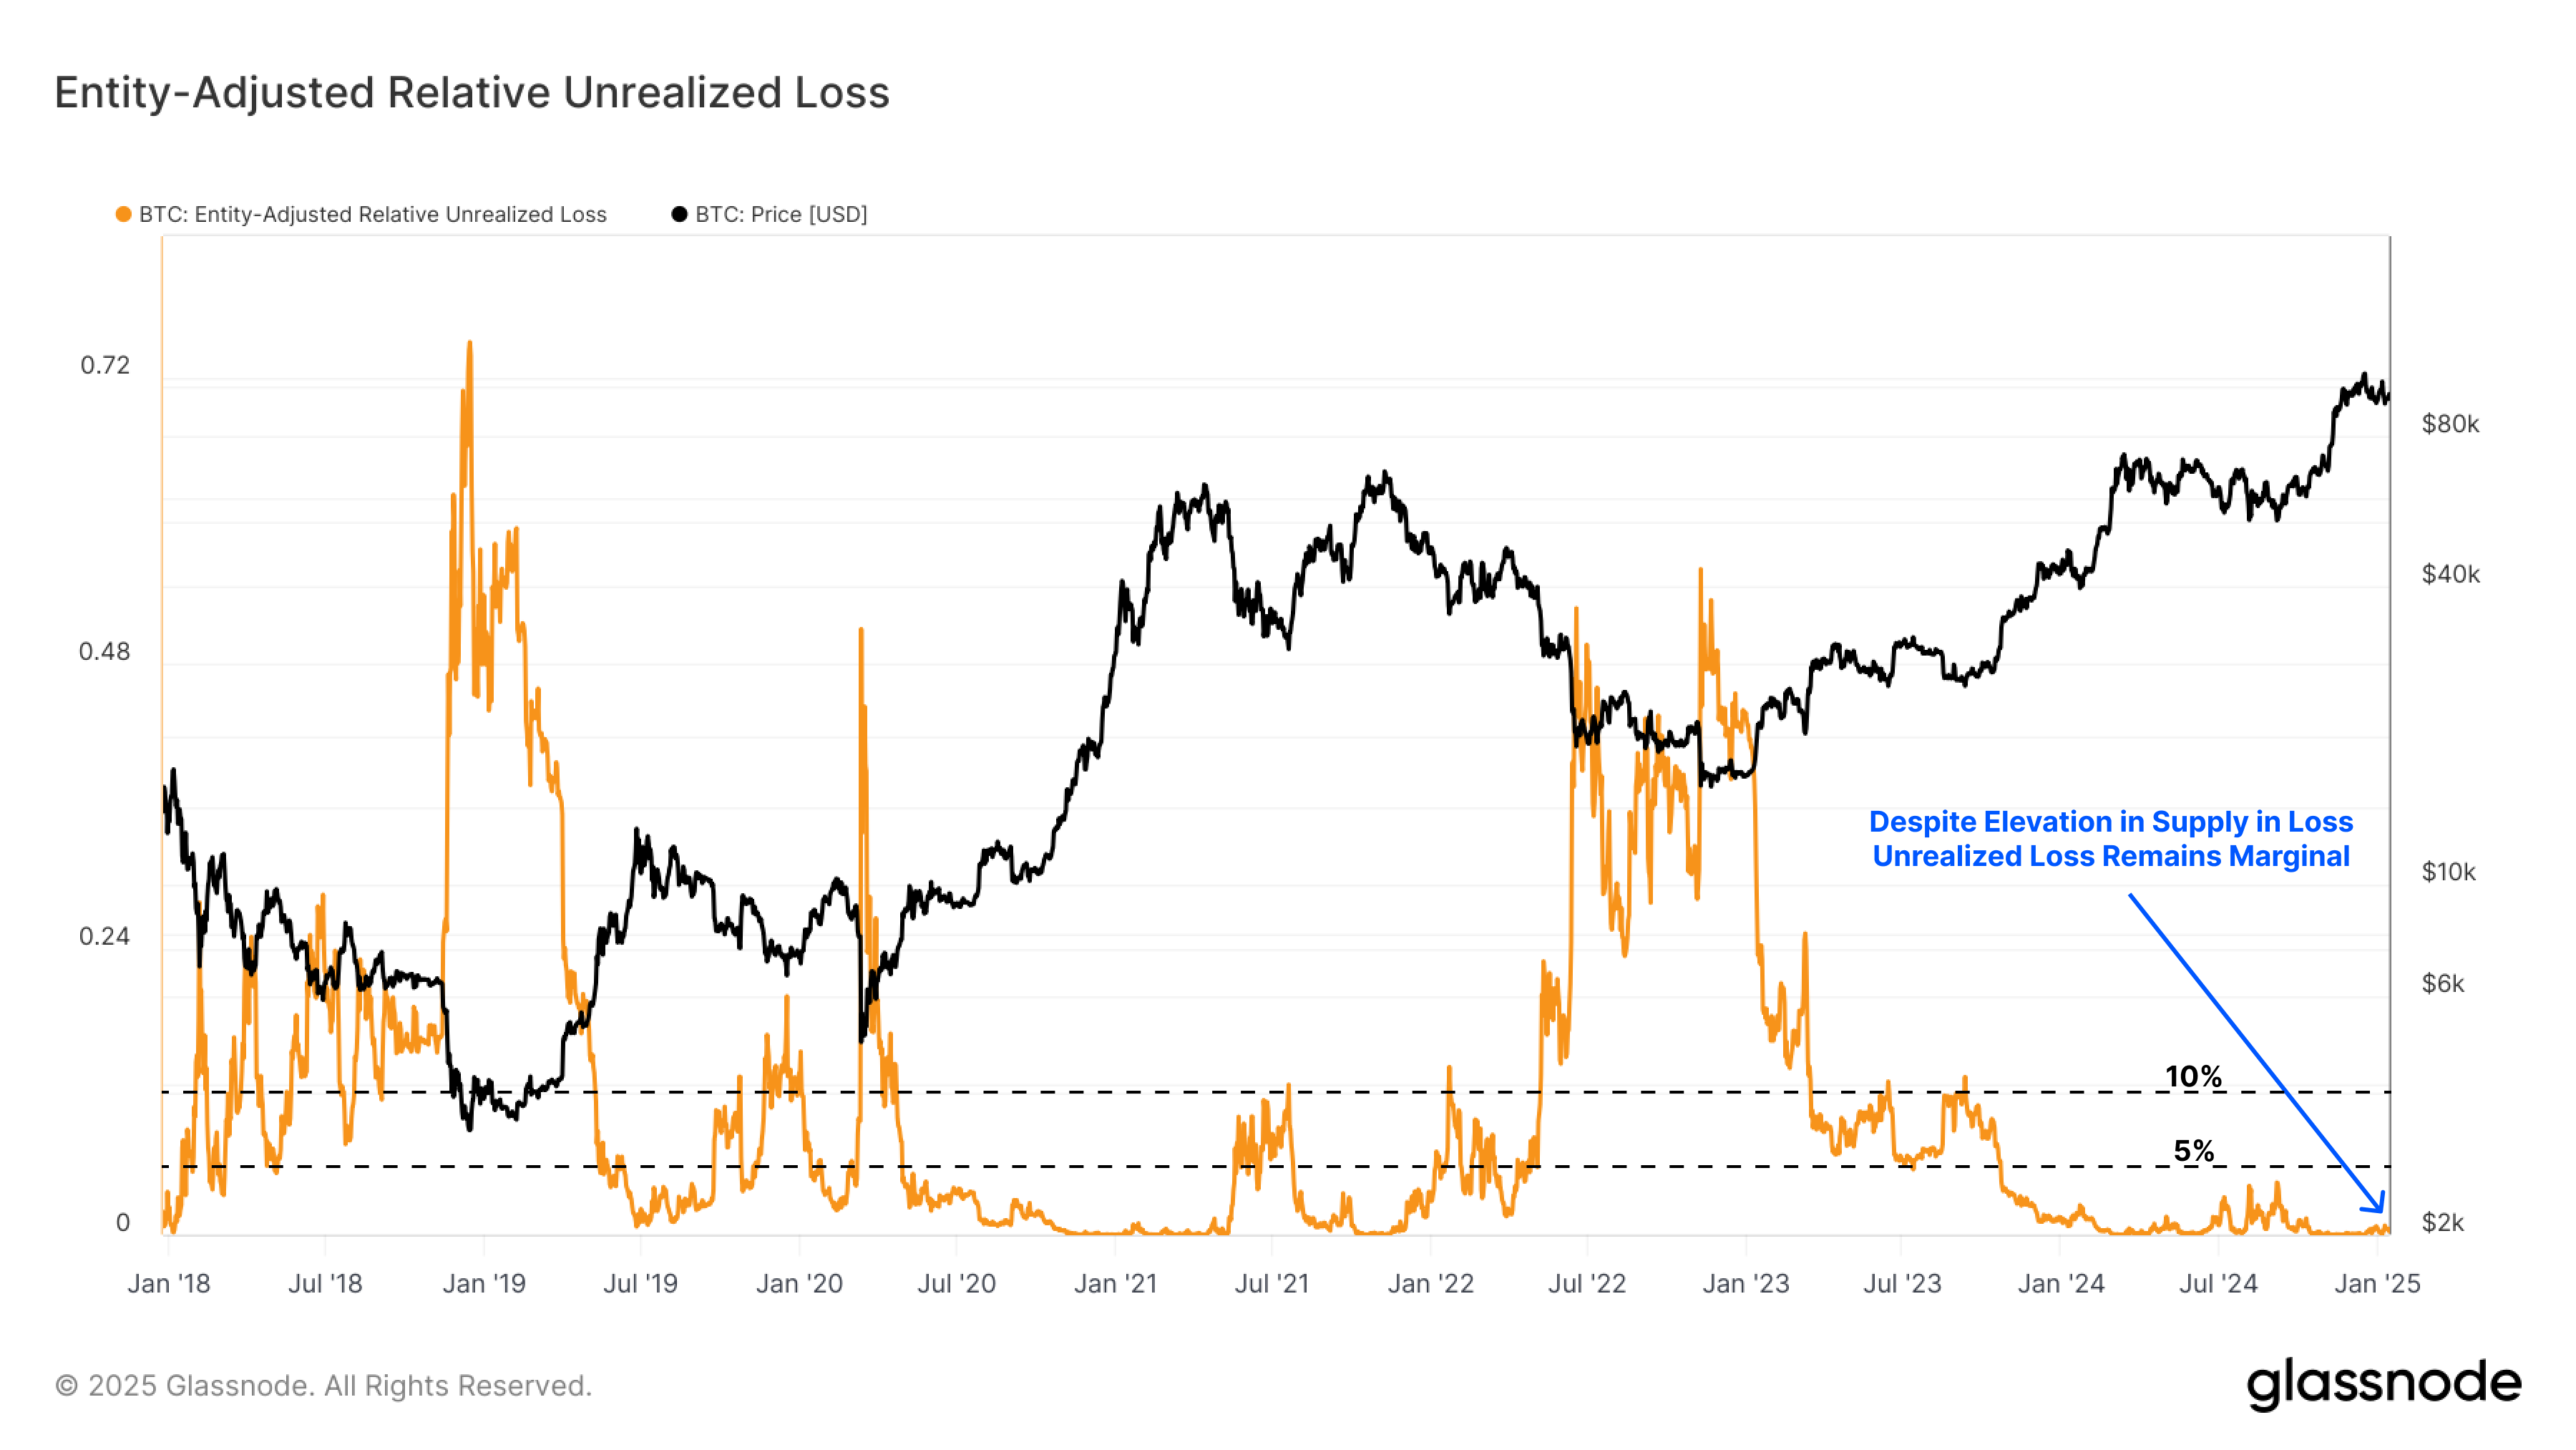
Another dimension for measuring pain in the market is the Relative Unrealized Loss metric, which measures the ratio of unrealized losses (in USD) relative to the market capitalization. Reviewing recent cycles highlights parallels between the current market and the 2016–17 bull market.
Unlike the 2019–22 cycle, where external shocks like the COVID-19 pandemic and the China mining ban pushed the Relative Unrealized Loss to levels exceeding 10%, the Q3 2024 consolidation phase only pushed this metric to ~4.3%.
It could be argued that the current market cycle has experienced less acute stress, likely due to shallower drawdowns, reduced volatility, and the new spot demand brought in via the ETFs, as well as institutional investors.
Conclusion
Bitcoin has entered a correction phase and is trading 11.1% below its ATH of $108k. However, the spot price is still trading above several key support levels, suggesting the bullish market structure remains intact for now. This is compounded by the relatively light levels of distress in the market, as measured by historically small unrealized losses held by market participants.
We also showed how an optimized MVRV z-score using a 1-year rolling window provides a framework to navigate near-term bullish and bearish market phases. According to this model, we are also still within bullish territory, although the Short-Term Holder cost basis remains $88.4k is a key level to watch for maintaining constructive sentiment.
Disclaimer: This report does not provide any investment advice. All data is provided for information and educational purposes only. No investment decision shall be based on the information provided here and you are solely responsible for your own investment decisions.
Exchange balances presented are derived from Glassnode’s comprehensive database of address labels, which are amassed through both officially published exchange information and proprietary clustering algorithms. While we strive to ensure the utmost accuracy in representing exchange balances, it is important to note that these figures might not always encapsulate the entirety of an exchange’s reserves, particularly when exchanges refrain from disclosing their official addresses. We urge users to exercise caution and discretion when utilizing these metrics. Glassnode shall not be held responsible for any discrepancies or potential inaccuracies. Please read our Transparency Notice when using exchange data.
- Join our Telegram channel.
- For on-chain metrics, dashboards, and alerts, visit Glassnode Studio.