The US stock market has seen a solid year so far. The Nasdaq Composite was up 31.7%, its best first half performance since 1983. Similarly, the 15.9% gain for the S&P 500 Index (SPX) was its best first half since 2019. This shows that the demand for risky assets is still maintained.
In the crypto market, Bitcoin (BTC) has led the recovery, gaining 20% in Q2 2023. An encouraging sign is that the rise has not tempted Bitcoin holders to take profits. Glassnode 's Liquidation supply change index is near a cycle high, showing holders confidence.
Usually, the leader is the first to exit a bear market. If the rally holds, traders' sentiment will improve and they begin to consider other buying opportunities. After Bitcoin's rally, altcoins have begun to show signs of life. If this trend continues, a number of altcoins could surge in the next few weeks.
Will the US stock market continue to move higher? Will Bitcoin and major altcoins continue to recover? Let's analyze the charts to find out.
The S&P 500 Index (SPX) bounced off a breakout of 4,325 on June 26, showing that bulls have flipped this level into support.
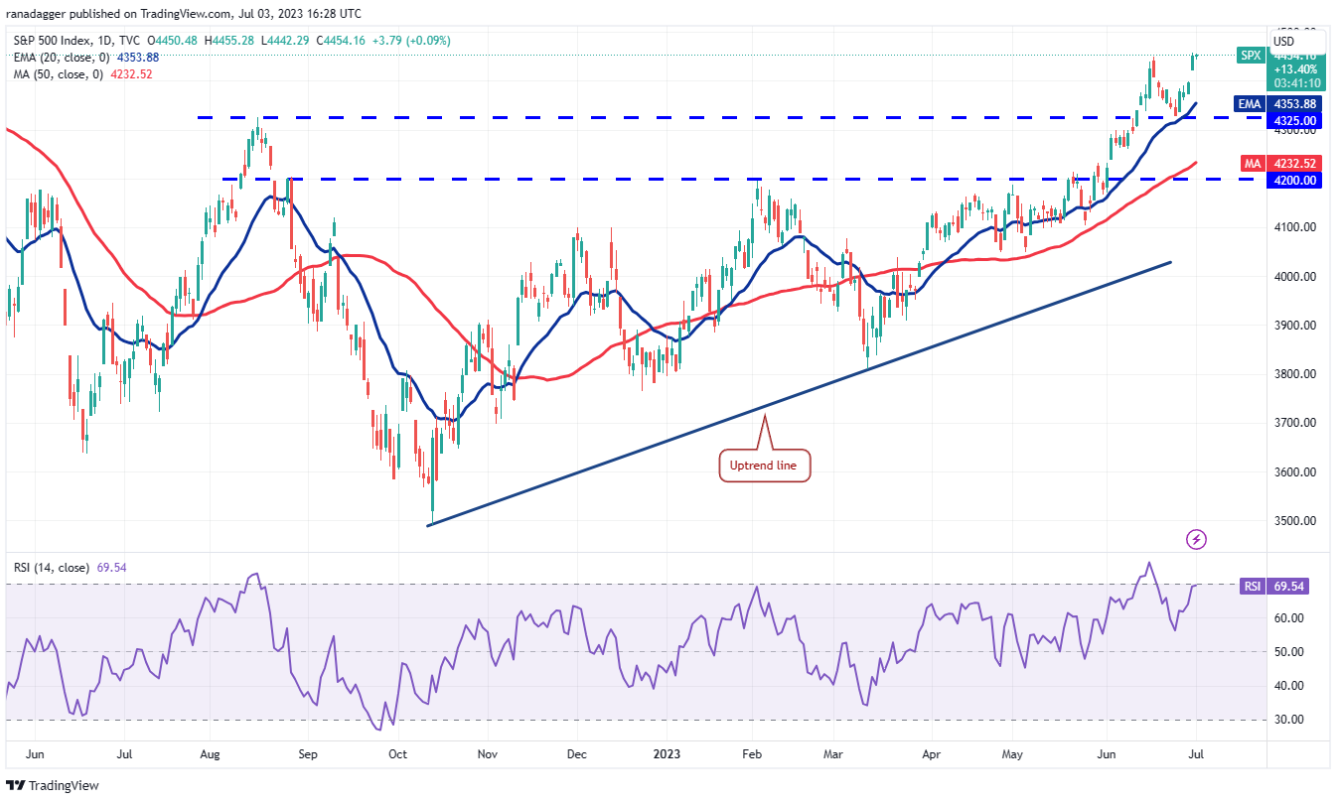
SPX Daily Chart | Source: TradingView
Buyers continued to buy at higher levels, pushing the index past the nearest resistance at 4,448. This indicates a resumption of the uptrend. The bears are likely to pose a strong challenge at 4,500, but the likelihood of holding this level is low. If the index breaks through this resistance, the rally can reach 4,650.
If the bulls want to stop the rally, they will have to quickly drag the price below 4.325. If they do, selling might increase and the index could plummet to 4,200.
The bulls pushed the US Dollar Index (DXY) above the 20-day exponential moving Medium (EMA) of 103 on June 28, showing strength.
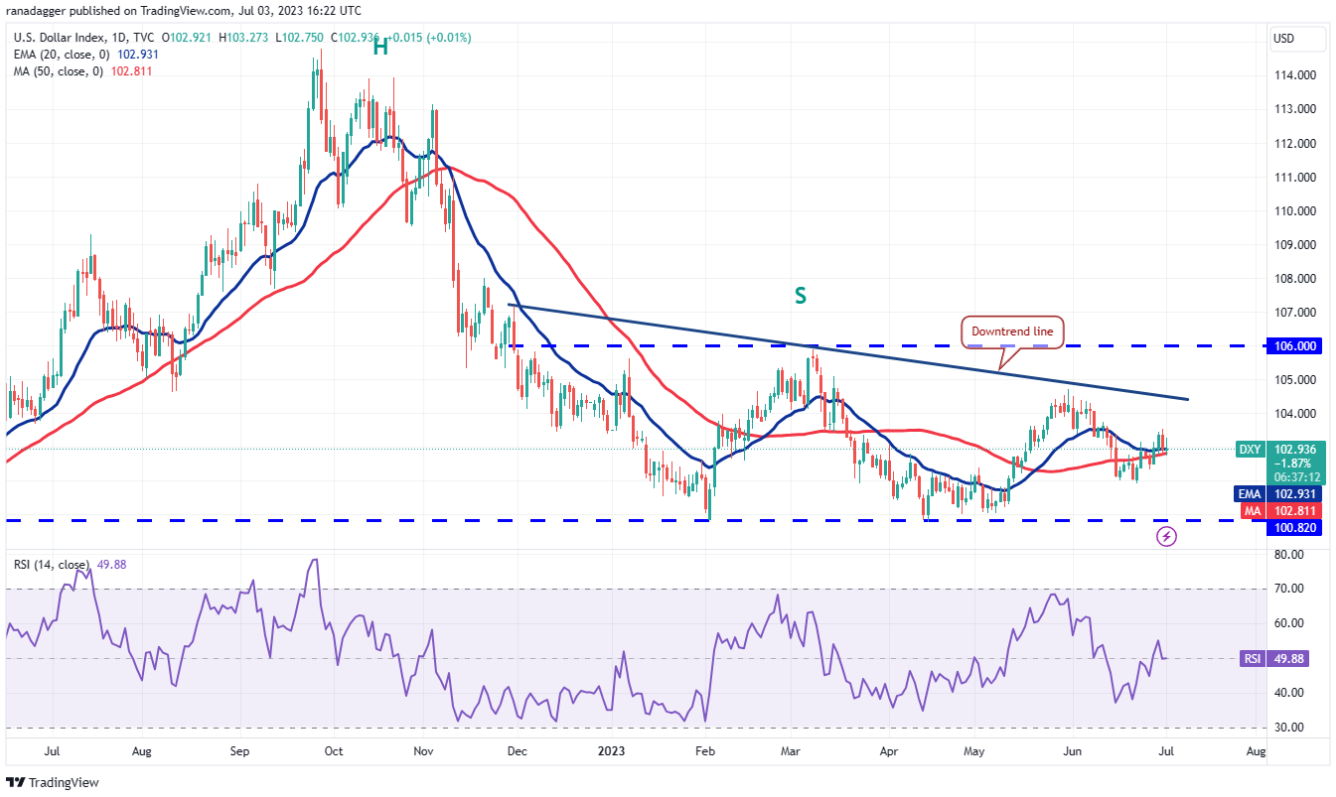
Daily DXY Chart | Source: TradingView
The bears attempted to drag the price back below the moving Medium on June 30, but the bulls failed to ease. This shows that the lower levels are attracting buyers. The bulls will then attempt to push the price above the downtrend line.
Contrary to this assumption, if the price turns down and breaks below the moving Medium , it shows that bears are selling on minor rallies. That could drag the price down to the nearest support at 102.
The long wick on Bitcoin's July 2 candlestick shows that bulls are buying the intraday dips. Buyers will attempt to strengthen their position by pushing and sustaining the price above the $31,000 resistance.
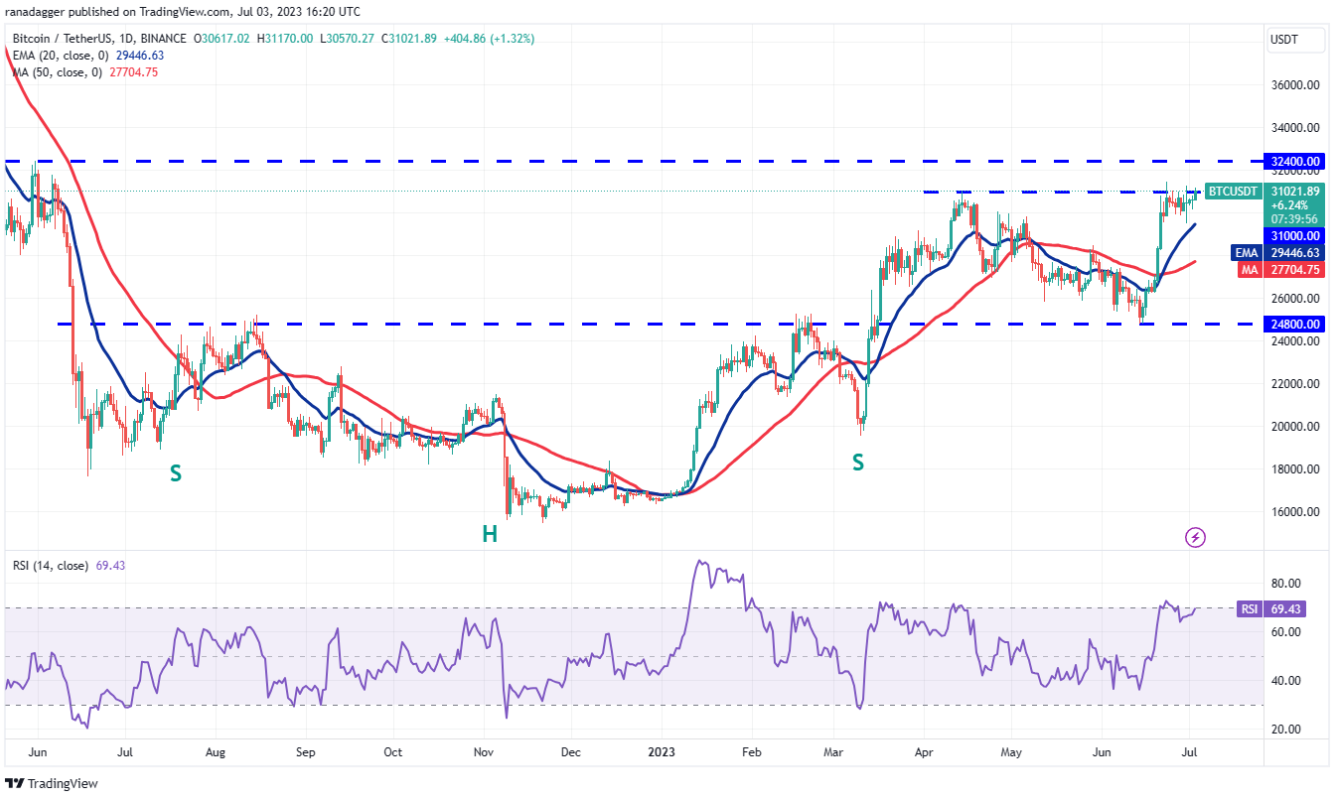
BTC/USDT Daily Chart | Source: TradingView
If they do, the BTC/USDT pair can pick up momentum and start moving north towards $40,000. The $32,400 level could act as a minor hurdle, but it is likely to be crossed.
The bullish 20-day EMA ($29,446) and the relative strength index (RSI) near the overbought zone suggest an advantage for the buyers. Sellers will have to drop below the 20-day EMA to gain the upper hand in the near term. After that, the pair can drop to the 50-day simple moving Medium (SMA) of $27,704.
The bears attempted to drag Ether (ETH) towards the 20-day EMA ($1.866) on July 2, but the long tail on the bar shows that the bulls are buying on a slight dip.
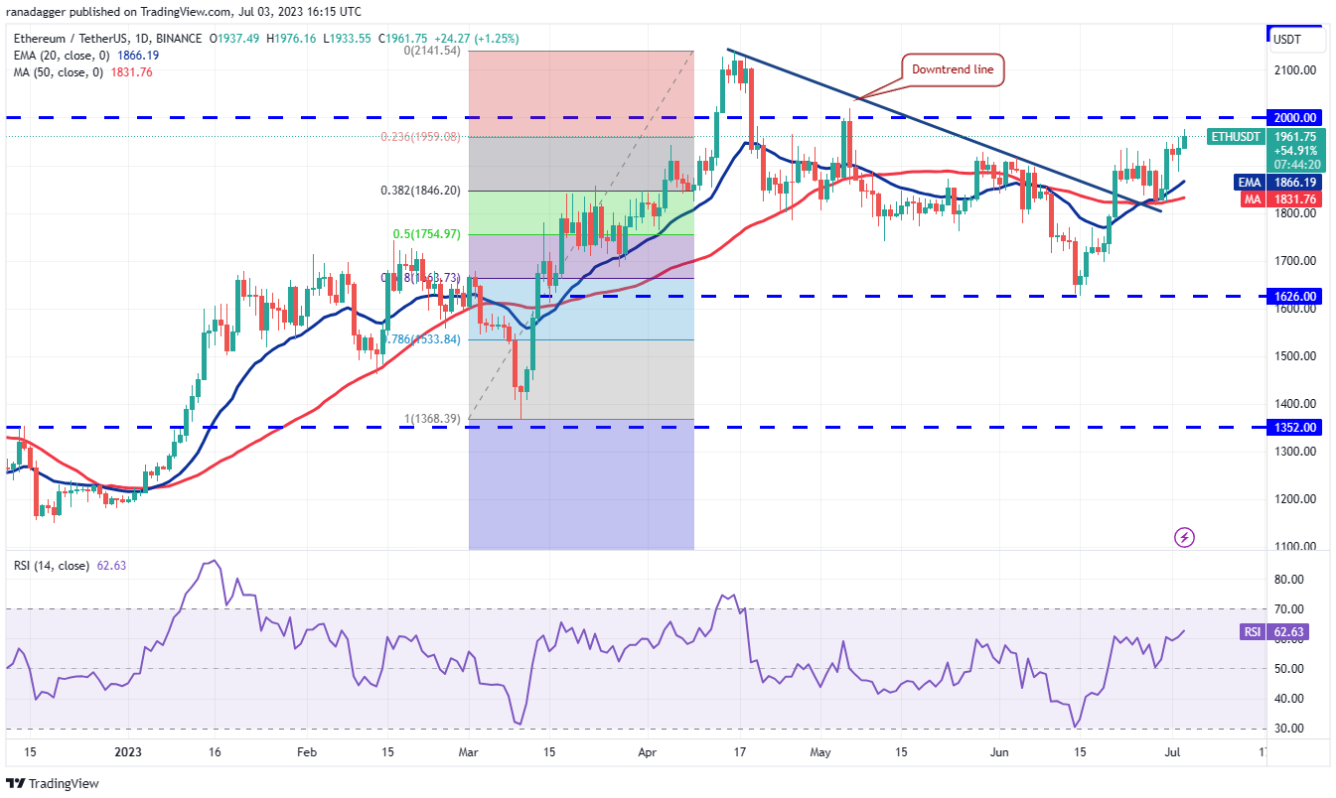
ETH/USDT Daily Chart | Source: TradingView
The 20-day EMA has turned up and the RSI is above 62, showing that the bulls have the upper hand. There is a minor resistance at $2,000, but that level is likely to be crossed. Thereafter, the ETH/USDT pair can rally to the overhead resistance area between $2,142 and $2,200. Sellers are expected to defend this zone aggressively.
This positive view will be invalidated in the near term if the price turns down from $2,000 and drops below the moving Medium . After that, the pair could continue the range-bound action between $1,626 and $2,000 for some time.
BNB (BNB) rose above the 20-day EMA ($245) on July 1, showing that selling pressure is easing.
BNB/USDT Daily Chart | Source: TradingView
The 20-day EMA has flattened out and the RSI has climbed near the midpoint, suggesting that the BNB/USDT pair could consolidate between $220 and $265 for a few more days. If the price sustains above the 20-day EMA, the pair can climb to the overhead resistance of $265. The bears are expected to fiercely defend this level.
Additionally, if the price turns down and breaks below the 20-day EMA, it shows that any attempt to recover is met with strong selling pressure. After that, the pair can drop to the strong support at $220.
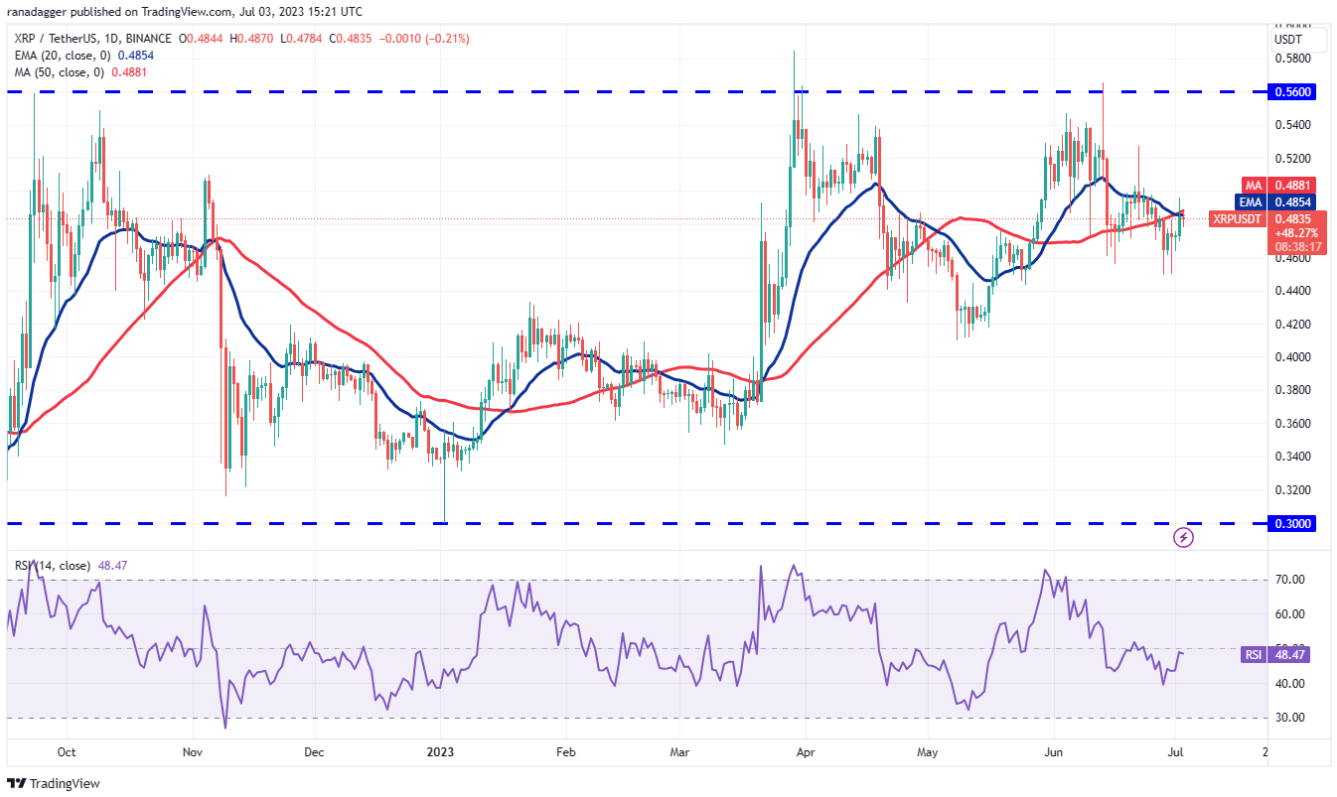
The bulls are attempting to push XRP (XRP) above the 20-day EMA ($0.48), but the bears are actively defending this level.

XRP/USDT Daily Chart | Source: TradingView
If the buyers do not allow the price to slide much below the current levels, the possibility of a breakout above the 20-day EMA increases. After that, the XRP/USDT pair can start moving north towards $0.53 and above it $0.58.
Conversely, if the price turns down sharply from the current levels, it will show strong selling near the 20-day EMA. The bears will have to drop below $0.44 to gain the upper hand. After that, the pair can drop to $0.41.
The bears successfully defended the $0.30 resistance on June 30, but they were unable to sustain Cardano (ADA) below the 20-day EMA ($0.29). This shows that every small pullback is buying.
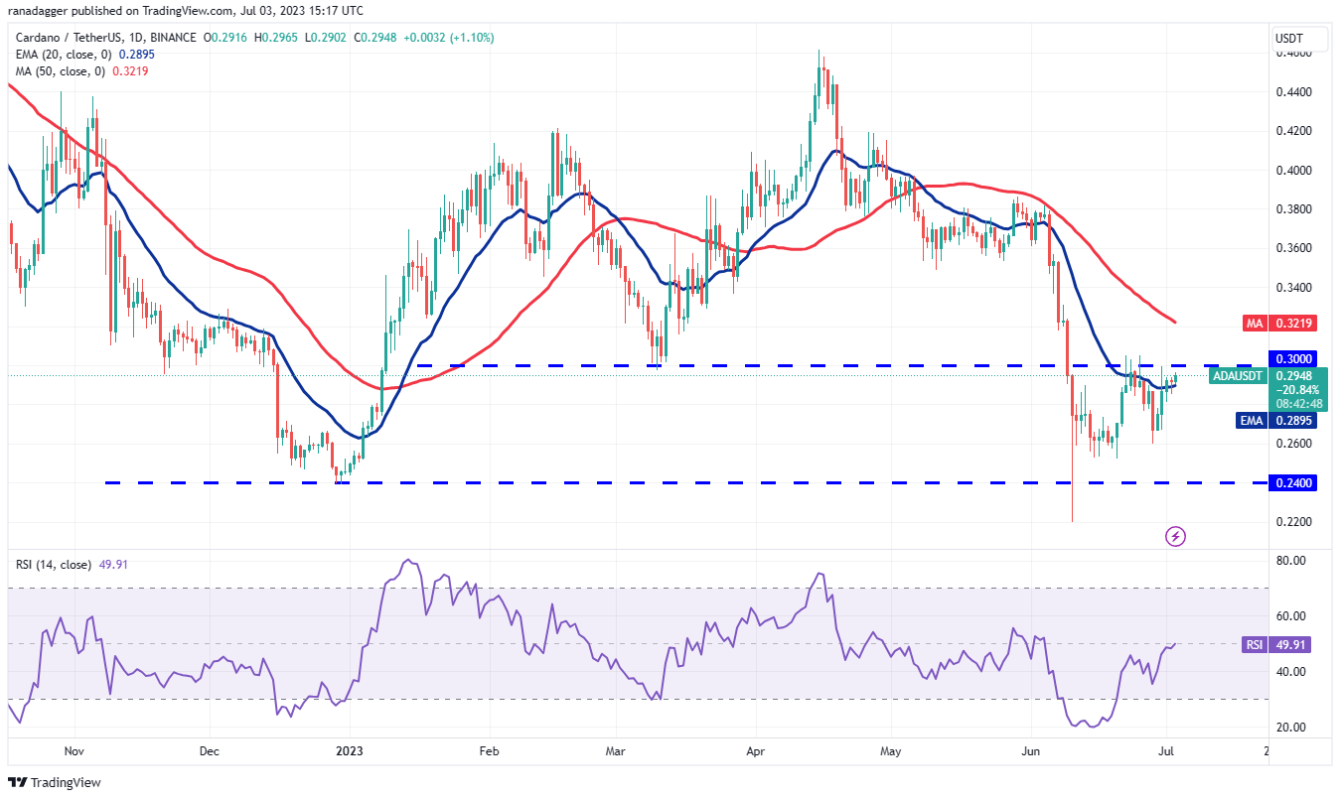
Daily ADA/USDT Chart | Source: TradingView
The 20-day EMA has turned flat and the RSI is near the midpoint, suggesting that the bears may be losing control. Buyers will try to strengthen their position by pushing the price above $0.3. If they can succeed, it will signal the start of a strong rally. The 50-day SMA ($0.32) could act as a hurdle, but it is likely to be crossed.
This positive view will be invalidated in the near term if the price turns down sharply from the current levels. That could keep the pair in the $0.30 to $0.24 range for a while longer.
Dogecoin (DOGE) surged past the $0.07 resistance on July 1, but the long wick on the candle bar shows selling at higher levels.
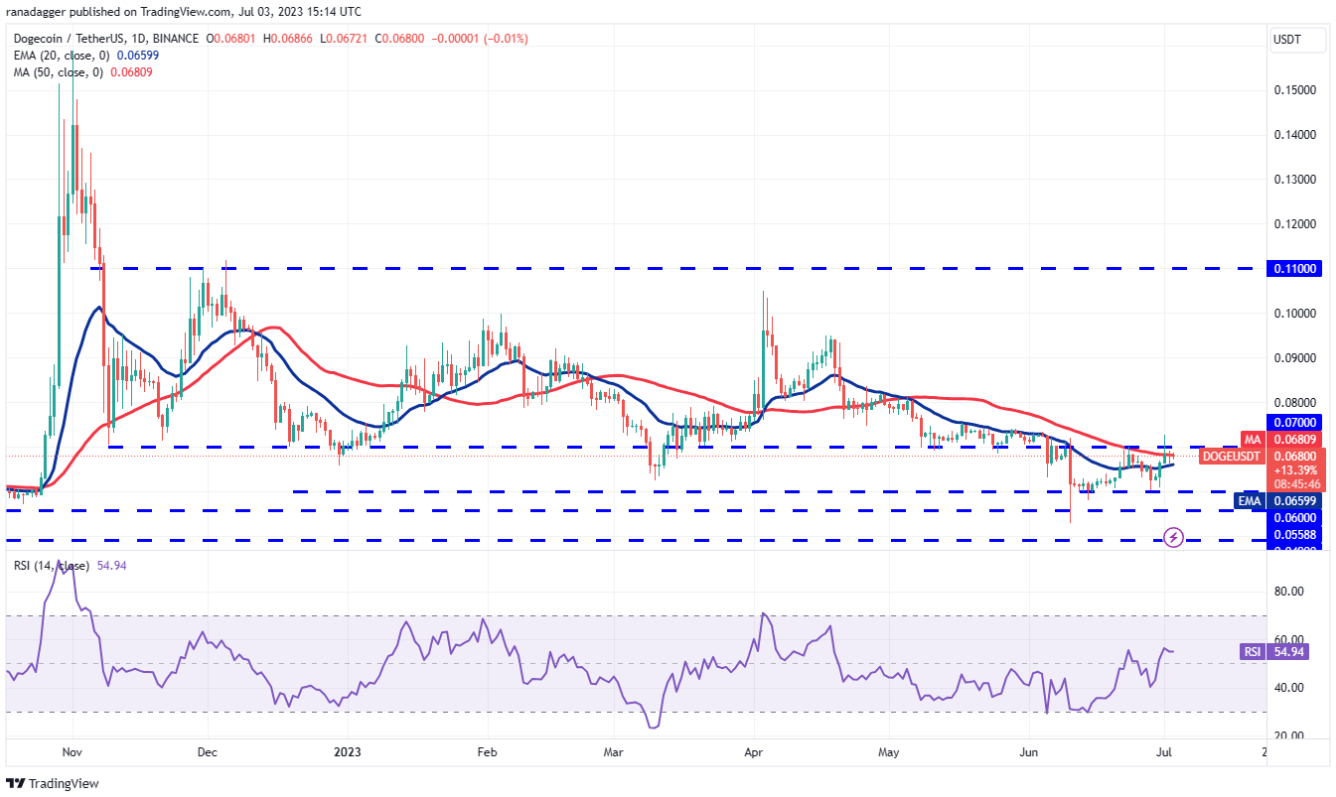
Daily DOGE/USDT Chart | Source: TradingView
The inability to sustain the price above the overhead resistance suggests that the DOGE/USDT pair remains stuck in the $0.06 to $0.07 range. Buyers will have to push and sustain the price above $0.07 to signal the start of a sustained recovery. After that, the pair can rise to $0.08.
On the downside, $0.06 remains the key support to watch out for. A break and close below this level could open the door for a further drop to $0.05.
Solana (SOL) has been trading between the 20-day EMA ($17.61) and the downtrend line for the past three days. This shows that the bears are selling near the downtrend line and the bulls are buying at the lows.
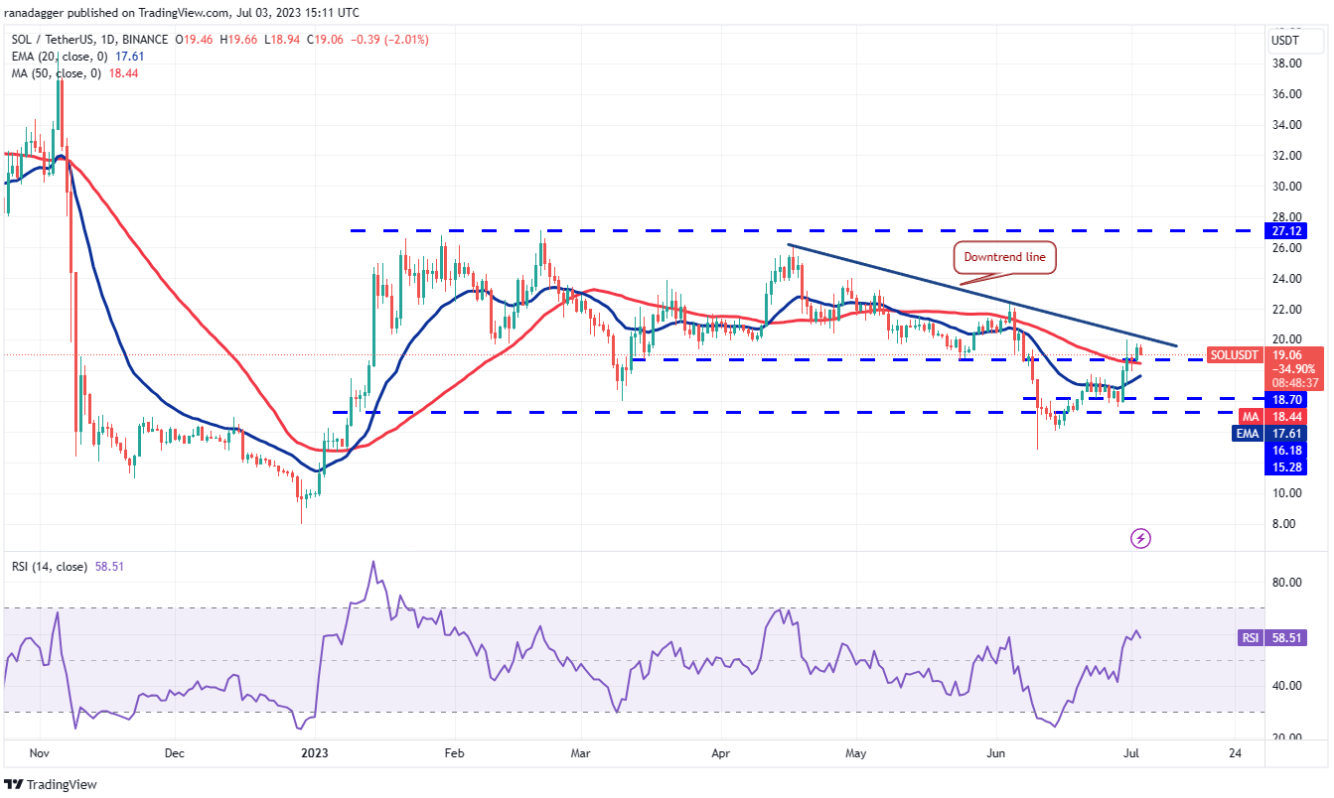
Daily SOL/USDT Chart | Source: TradingView
The 20-day EMA has started sloping up and the RSI has risen to the positive zone, showing that the bulls are in the lead. That increases the possibility of a breakout above the downtrend line. If that happens, the SOL/USDT pair can rally to $22 and then to $24.
If the price declines sharply from current levels and breaks below the 20-day EMA, it shows that sentiment remains negative and traders are selling as prices rise. That can push the pair down to the $16.18-$15.28 support area.
Litecoin (LTC) broke through the $106 resistance on June 30 and the bulls managed to sustain the price above it.
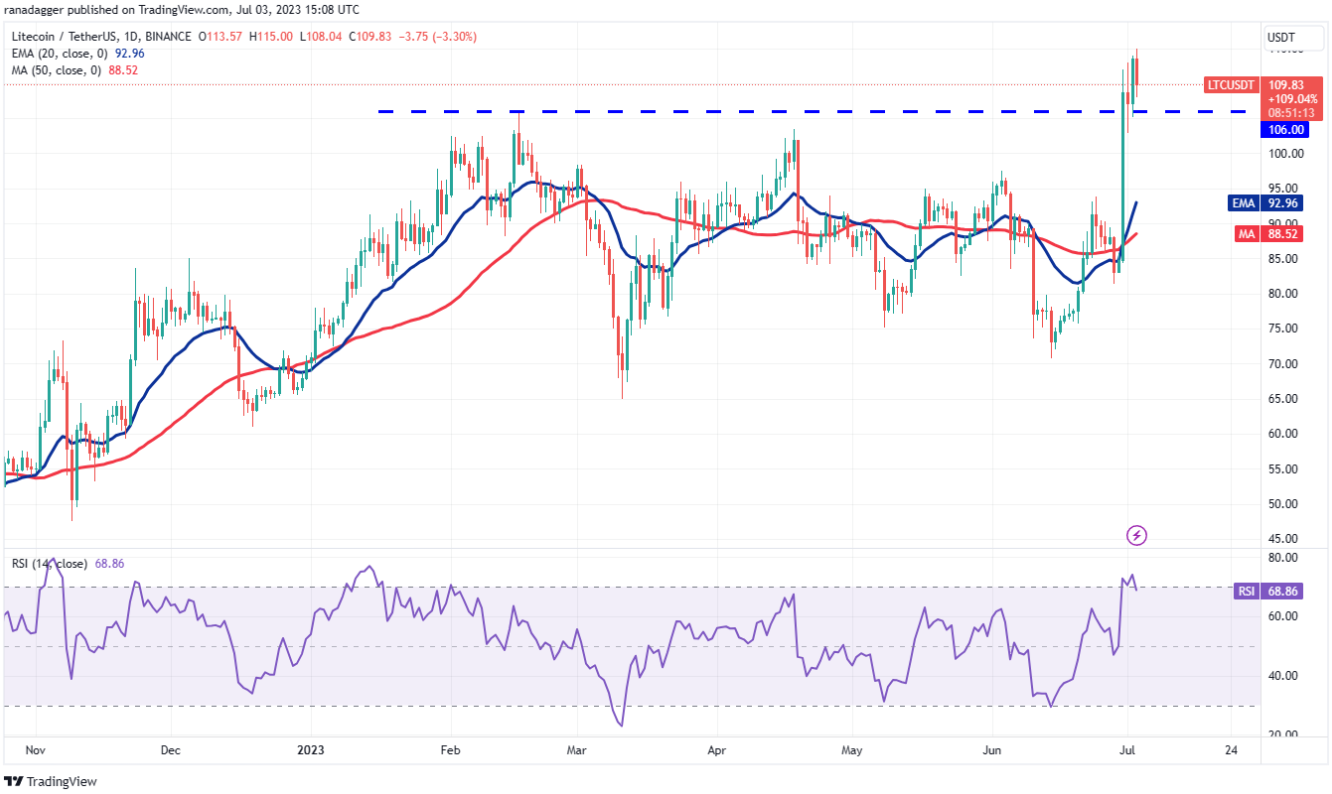
LTC/USDT Daily Chart | Source: TradingView
However, the bears have not given up yet and they are attempting to halt the upside at the next resistance at $115. If the bulls sustain the price above $106, it will raise the prospect of a continuation of the uptrend. After that, the LTC/USDT pair can spike to the overhead zone between $134 and $144.
The first support on the downside is at $106. If this level gives way, it will indicate that the short-term bulls may be taking profits. That can drag the price down to the 20-day EMA ($93).