XRP в настоящее время торгуется около $1,3, сталкиваясь с устойчивым сопротивлением из-за большого объёма предложения в зоне $1,9–$2,2, где сосредоточены значительные объёмы покупок 2024–2025 годов. Ежедневные реализованные убытки составляют от $20 до $110 миллионов, а около 56% монет находятся «под водой», что создает постоянное давление на продажи.
69% предложения XRP хранится в кошельках менее года, при этом 36,9% сосредоточено в группе 6–12 месяцев. Эти держатели склонны к продажам при приближении к точке безубыточности, что ограничивает восстановление цены. Хотя устойчивый спрос на более низких уровнях предотвращает обвалы, процесс восстановления замедляется, превращаясь в постепенное поглощение предложения и формирование более стабильной ценовой основы.
XRP в настоящее время держится около $1,3, что отражает сохраняющуюся слабость после неудачной попытки вернуться к уровням выше $2. Однако давление глубже, чем просто цена, поскольку дисбалансы в позиционировании продолжают сокращаться.
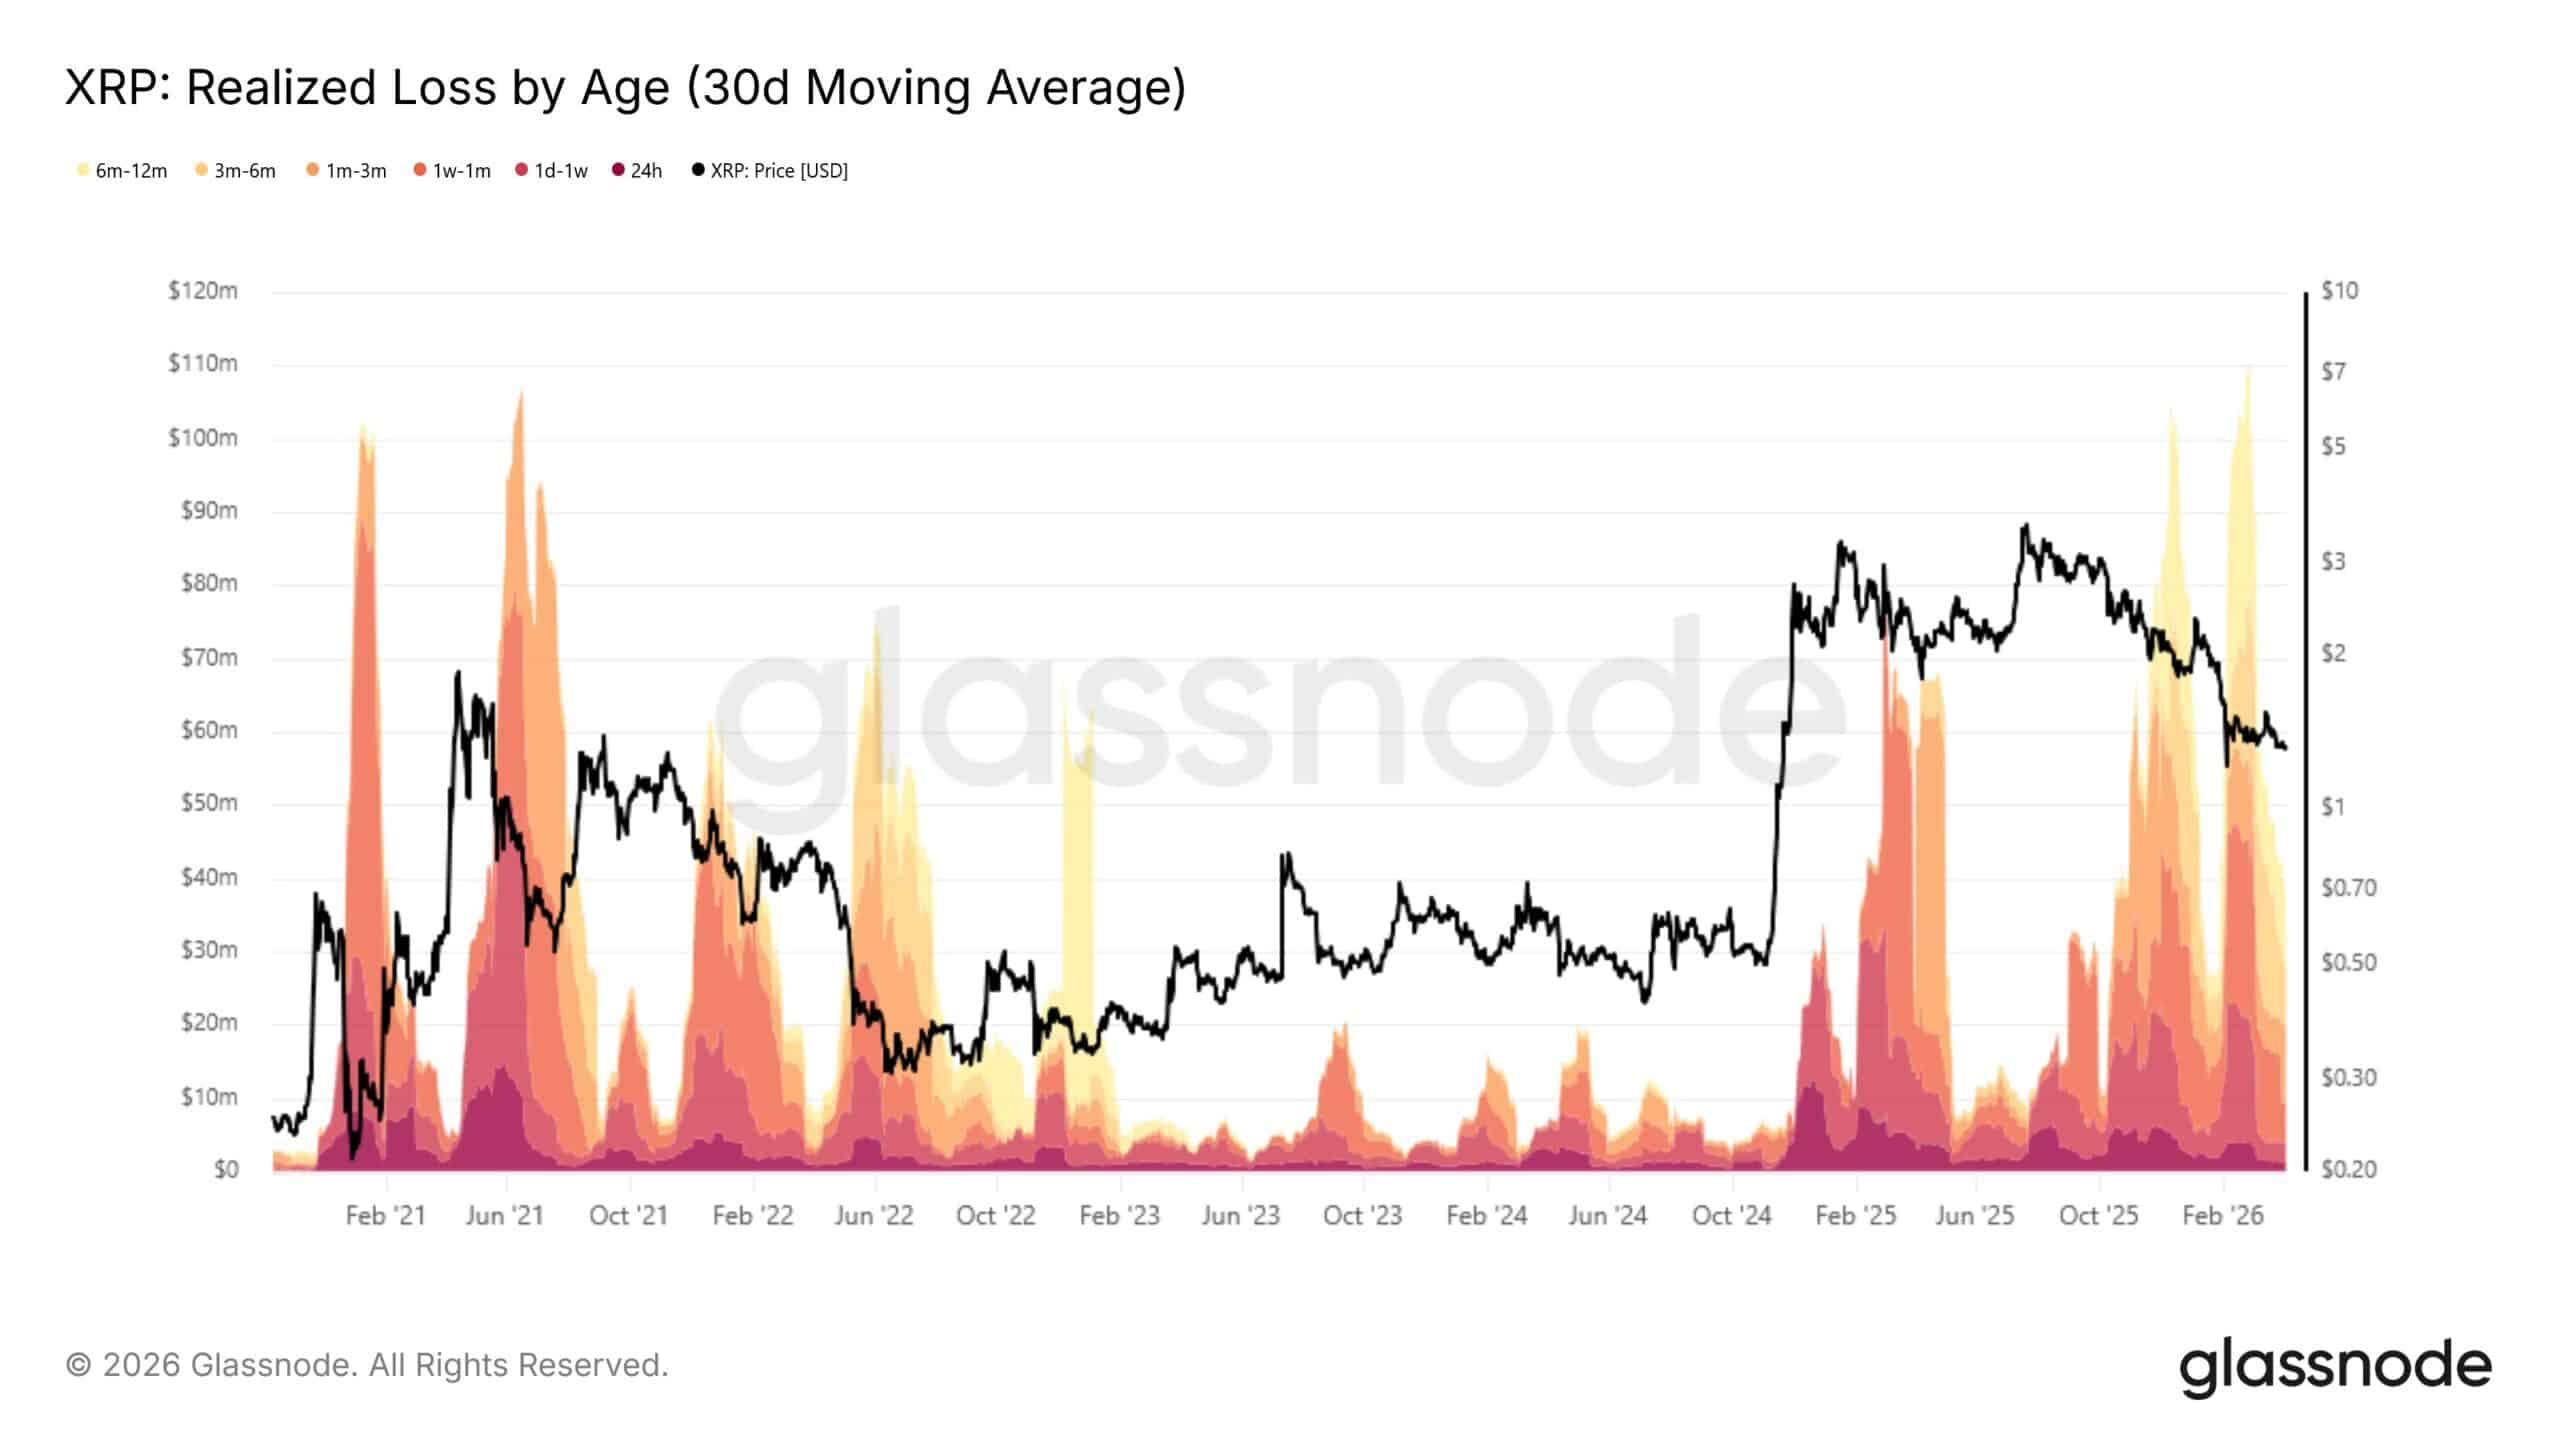
Во время ралли 2025 года к $3,66 значительные притоки средств от розничных инвесторов увеличили exposure краткосрочных держателей, что теперь провоцирует реактивную продажу. По мере снижения цен с конца 2024 года реализованные убытки ускорились, стабильно составляя от $20 миллионов до $110 миллионов в день.
Источник: Glassnode
Эти убытки сконцентрировались в новых когортах, показывая вынужденные выходы, а не стратегическую ротацию. Тем временем XRP оставался ниже реализованного уровня $1,43, удерживая примерно 56% своего предложения "под водой" (в убытке).
Поскольку этот избыток сохраняется, восстановление сталкивается с сопротивлением, хотя постепенная абсорбция со временем может стабилизировать структуру.
Избыток стоимости базиса XRP ограничивает восстановление
Этот устойчивый дисбаланс становится clearer при рассмотрении через призму позиционирования стоимости базиса, которая показывает, откуда на самом деле исходит это давление.
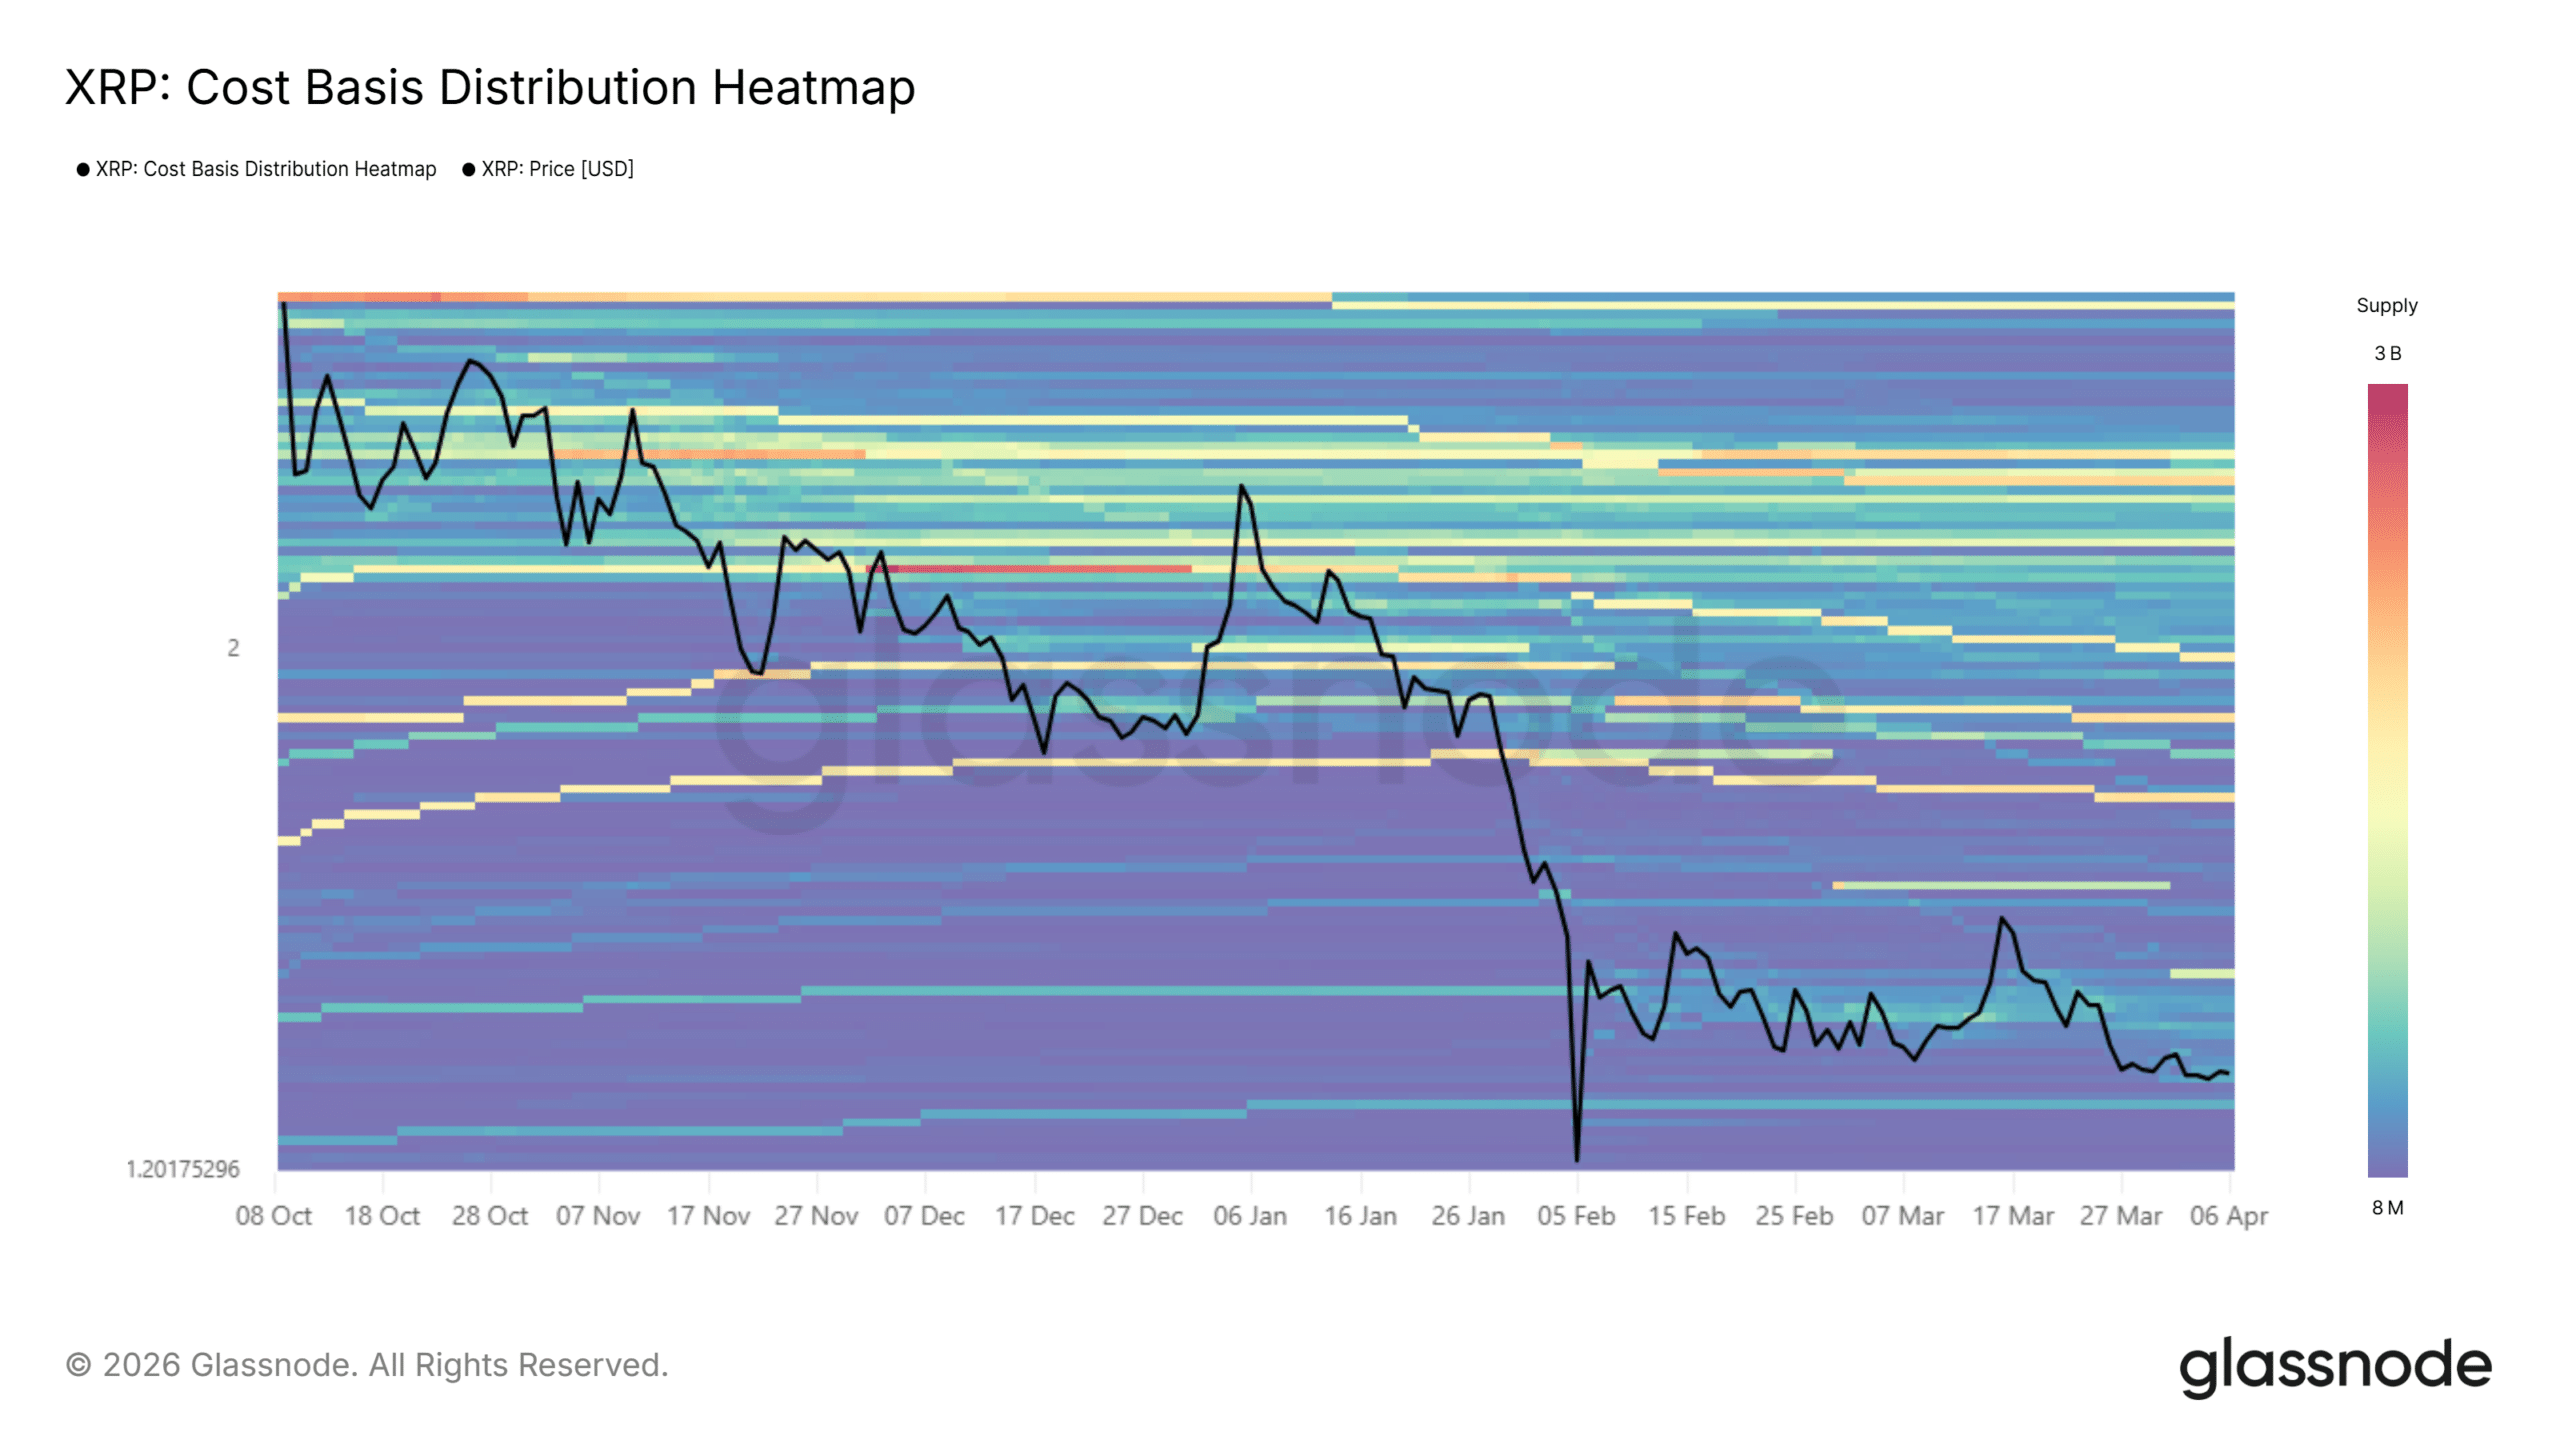
Поскольку цена XRP упала с отметки выше $2,5 до диапазона $1,2–$1,3, большие кластеры предложения оставались сконцентрированными между $1,9 и $2,2.
Источник: Glassnode
Когда цена пыталась восстановиться в этой зоне, держатели из периода притока 2024–2025 годов приблизились к точке безубыточности, что создало устойчивое давление со стороны продавцов.
Вместо единичной капитуляции, всплеск убытков в феврале перерос в продолжающееся распределение в марте.
В то же время некоторый спрос поглощает предложение near более низких уровней, что предотвращает более глубокие пробои. Это создает динамику медленной ротации, где восстановление остается ограниченным, но структура постепенно укрепляется по мере выхода слабых рук.
Дно альткойнов смещается к циклам медленной абсорбции
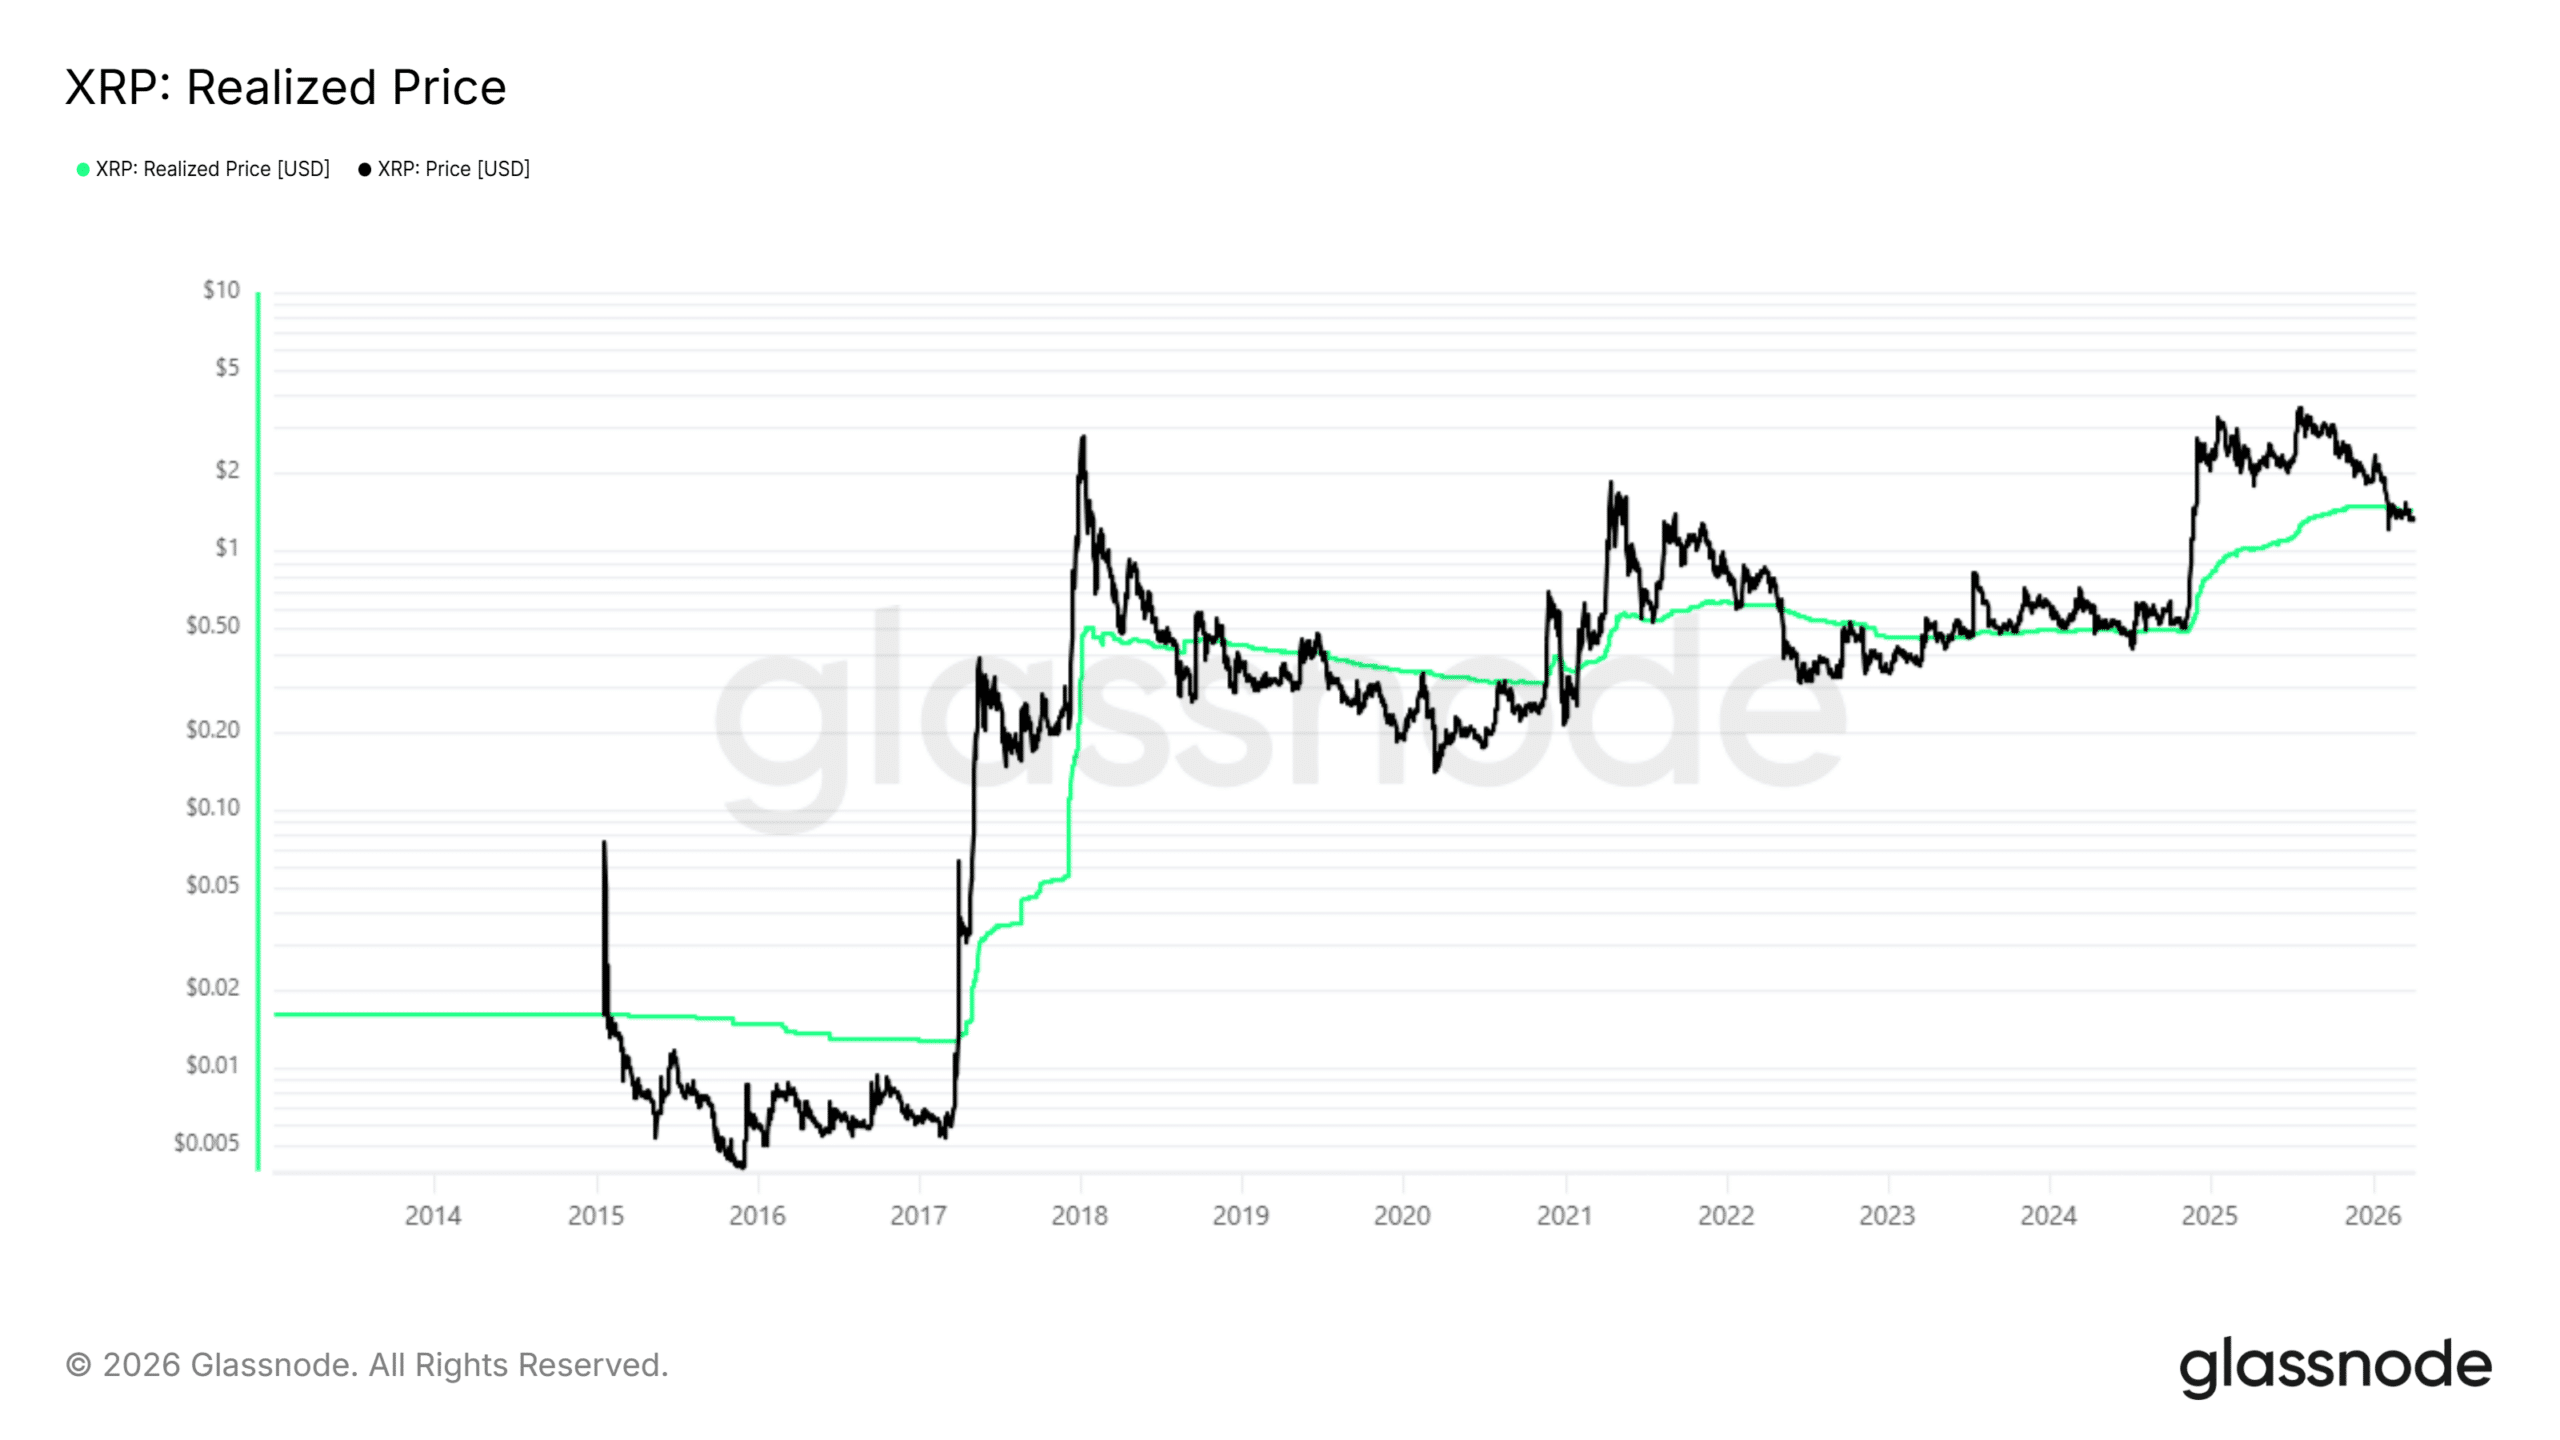
Это сопротивление around уровней стоимости базиса делает больше, чем просто ограничивает XRP; оно начинает переопределять то, как формируется дно альткойнов. Пока цена держится ниже реализованного уровня $1,43, попытки восстановления repeatedly останавливаются near избыточного предложения.
Источник: Glassnode
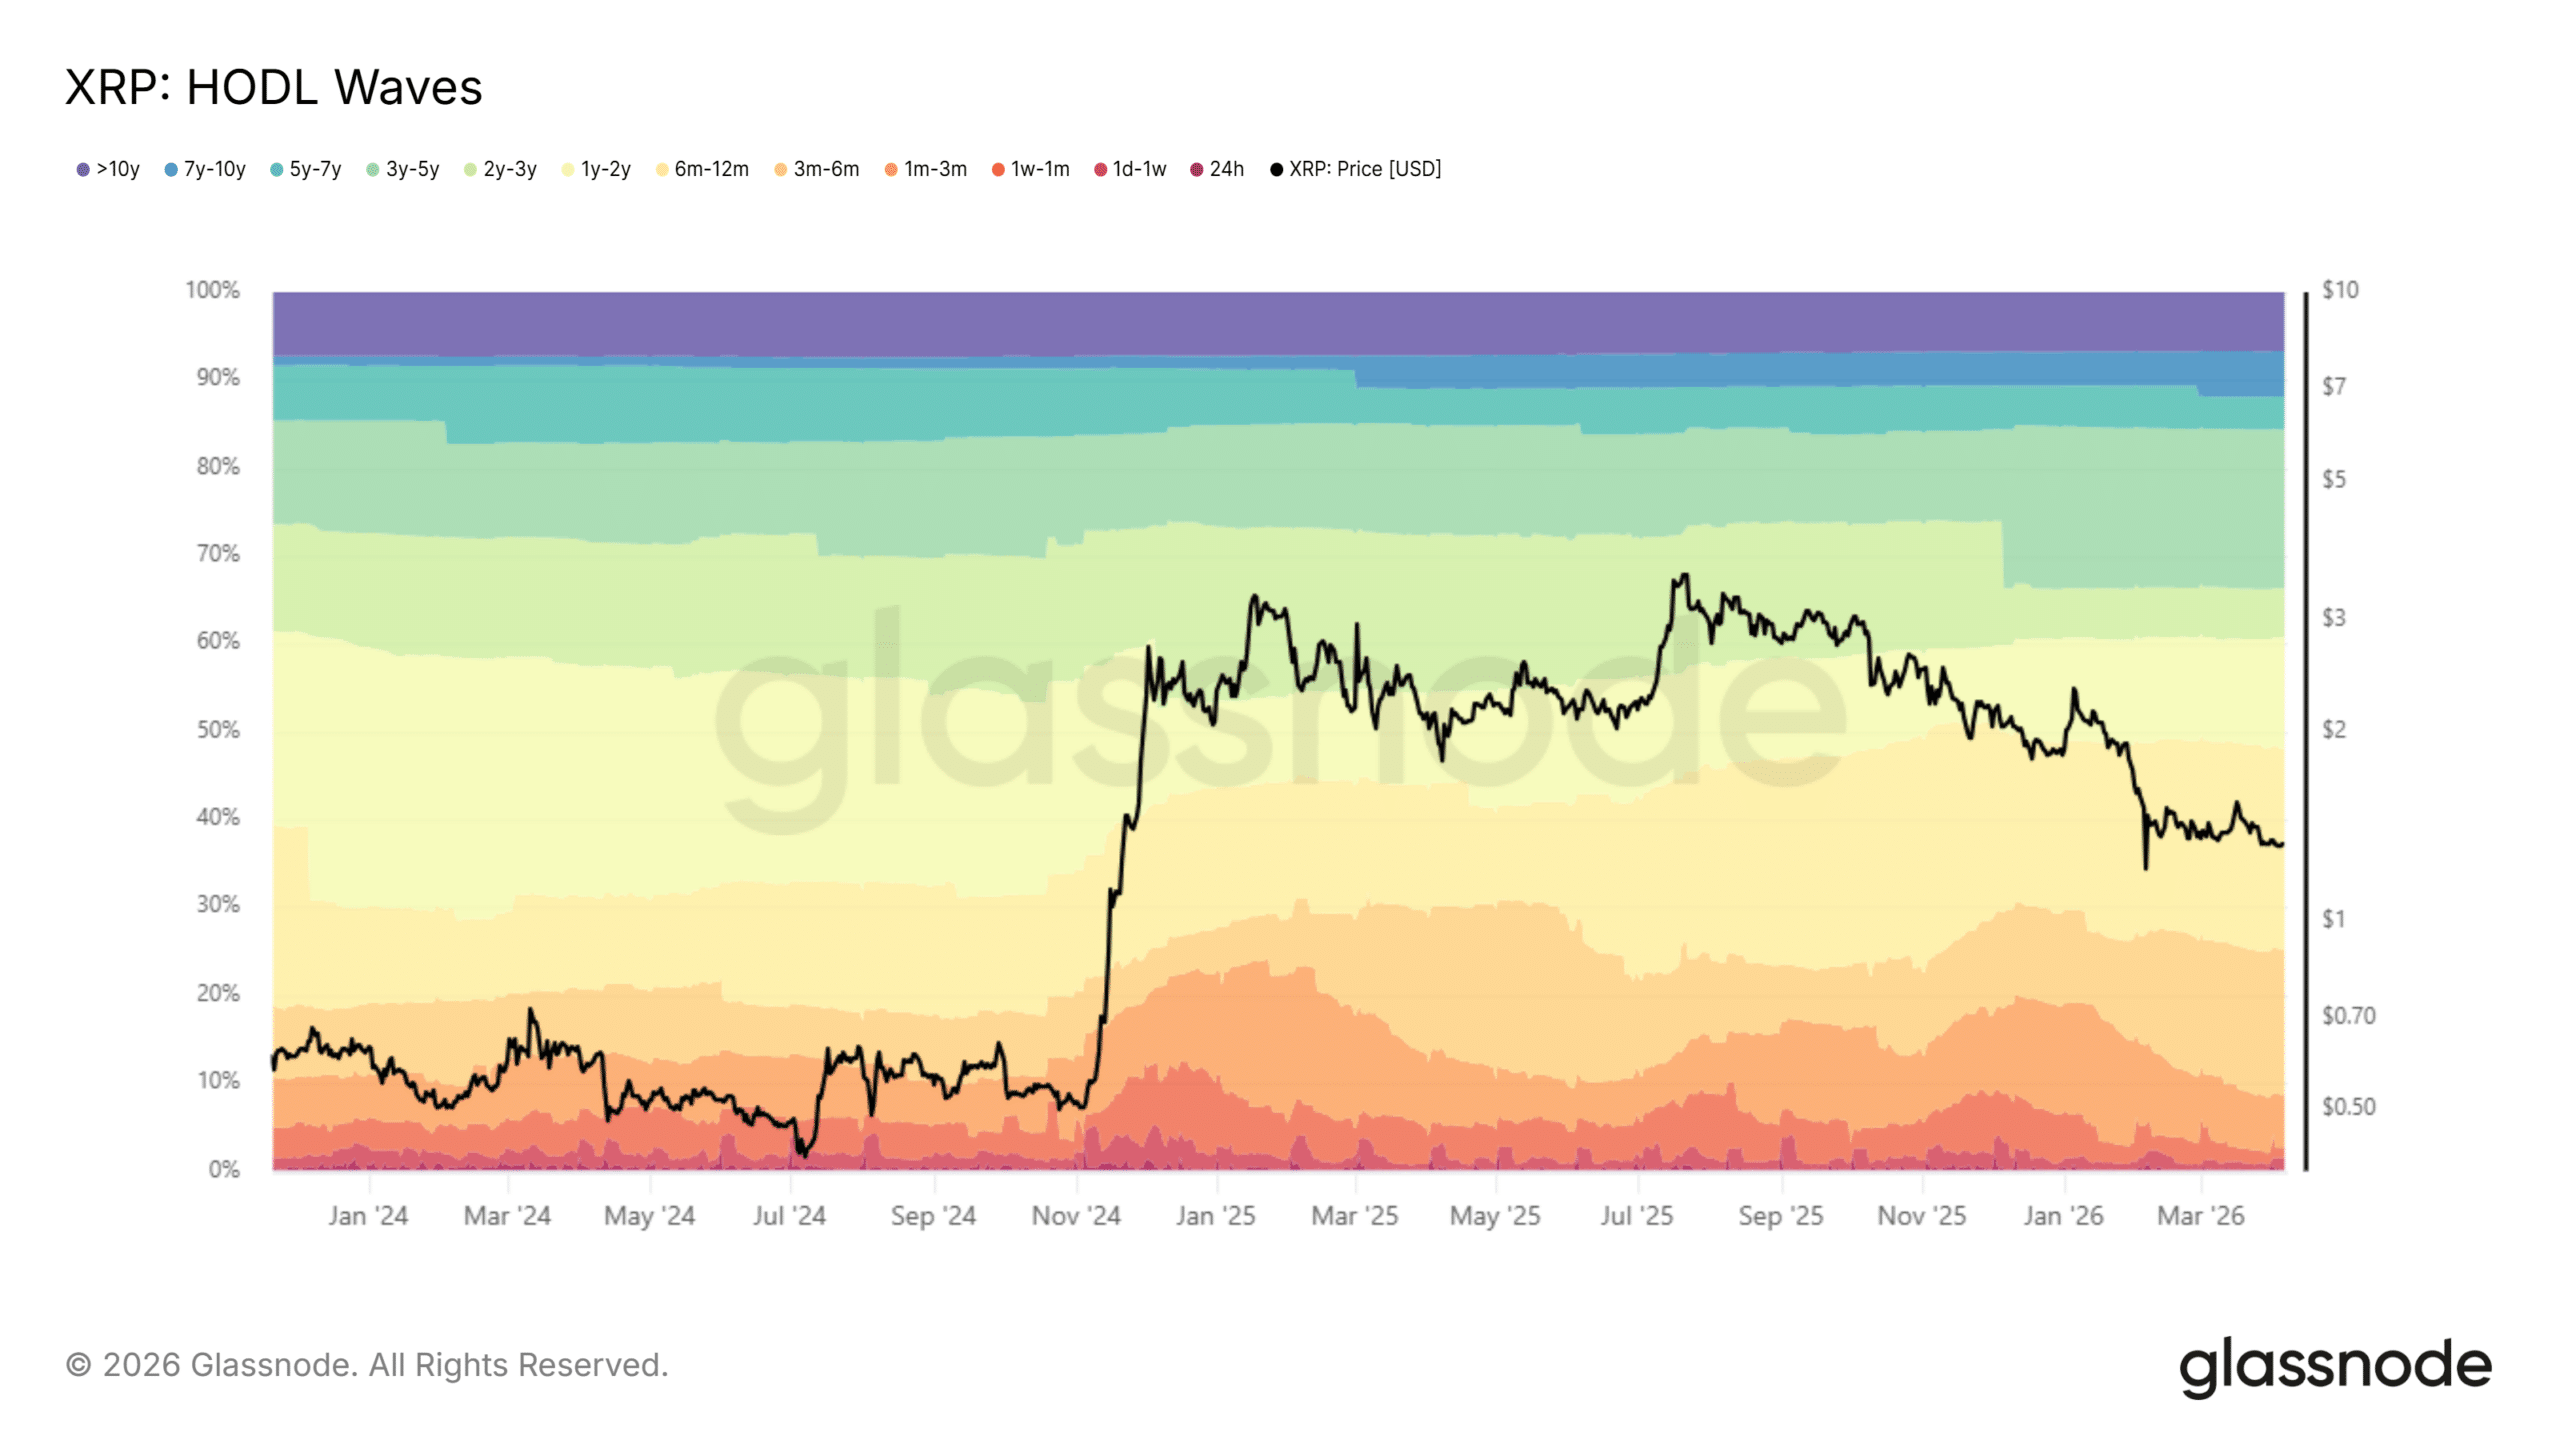
В то же время about 69% предложения находится в кошельках моложе одного года, причем 36,9% сконцентрировано в диапазоне 6–12 месяцев. Эти когорты остаются чувствительными к колебаниям цен, поэтому каждое ралли провоцирует продажи, driven выходом, по мере приближения держателей к точке безубыточности.
Источник: Glassnode
Между тем, roughly 56% предложения XRP остается "под водой", сохраняя давление активным, но не экстремальным. Это создает медленную ротацию, где слабые руки выходят, а сильные руки поглощают.
По мере развития этого процесса восстановления растягиваются, хотя тот же процесс постепенно строит более стабильную базу.
Итоговый вывод
$20–$110 миллионов ежедневных реализованных убытков и 56% предложения "под водой" поддерживают давление продаж XRP near стоимости базиса $1,43.
Кластеры предложения на уровнях $1,9–$2,2 и 69%, удерживаемые краткосрочно, удлиняют сроки формирования дна.
QКаков текущий уровень цены XRP и какое ключевое сопротивление удерживает его рост?
AXRP в настоящее время удерживается около $1,3. Ключевое сопротивление находится на уровне реализованной цены $1,43, а также в зоне скопления предложения между $1,9 и $2,2, что ограничивает восстановление.
QКакие факторы вызывают постоянное давление продаж на XRP?
AДавление продаж вызвано ежедневными реализованными убытками в размере $20–110 миллионов, а также тем, что примерно 56% предложения XRP находится 'под водой' (ниже цены покупки), что приводит к вынужденным продажам со стороны краткосрочных держателей.
QКак изменилось формирование дна на альткойн-рынке, согласно статье?
AФормирование дна сместилось в сторону медленных циклов поглощения, где восстановление сдерживается сопротивлением вокруг уровней себестоимости, а не резкой капитуляцией, что удлиняет временные рамки образования основания.
QКакая доля предложения XRP находится в руках краткосрочных держателей и как это влияет на цену?
AОколо 69% предложения XRP находится в кошельках моложе одного года, причем 36,9% сконцентрировано в диапазоне 6–12 месяцев. Эти держатели чувствительны к колебаниям цены и склонны продавать при приближении к точке безубыточности, создавая давление на каждом ралли.
QКакой процесс, по мнению автора, постепенно укрепляет структуру XRP, несмотря на медленное восстановление?
AПроисходит медленная ротация, при которой слабые руки (неуверенные держатели) выходят из позиций, а более сильные руки поглощают предложение. Этот процесс постепенно строит более стабильную основу, укрепляя структуру рынка.
Добро пожаловать на HTX.com! Мы сделали приобретение Sonic (S) простым и удобным. Следуйте нашему пошаговому руководству и отправляйтесь в свое крипто-путешествие.Шаг 1: Создайте аккаунт на HTXИспользуйте свой адрес электронной почты или номер телефона, чтобы зарегистрироваться и бесплатно создать аккаунт на HTX. Пройдите удобную регистрацию и откройте для себя весь функционал.Создать аккаунтШаг 2: Перейдите в Купить криптовалюту и выберите свой способ оплатыКредитная/Дебетовая Карта: Используйте свою карту Visa или Mastercard для мгновенной покупки Sonic (S).Баланс: Используйте средства с баланса вашего аккаунта HTX для простой торговли.Третьи Лица: Мы добавили популярные способы оплаты, такие как Google Pay и Apple Pay, для повышения удобства.P2P: Торгуйте напрямую с другими пользователями на HTX.Внебиржевая Торговля (OTC): Мы предлагаем индивидуальные услуги и конкурентоспособные обменные курсы для трейдеров.Шаг 3: Хранение Sonic (S)После приобретения вами Sonic (S) храните их в своем аккаунте на HTX. В качестве альтернативы вы можете отправить их куда-либо с помощью перевода в блокчейне или использовать для торговли с другими криптовалютами.Шаг 4: Торговля Sonic (S)С легкостью торгуйте Sonic (S) на спотовом рынке HTX. Просто зайдите в свой аккаунт, выберите торговую пару, совершайте сделки и следите за ними в режиме реального времени. Мы предлагаем удобный интерфейс как для начинающих, так и для опытных трейдеров.
HTX Learn — ваш проводник в мир перспективных проектов, и мы запускаем специальное мероприятие "Учитесь и Зарабатывайте", посвящённое этим проектам. Наше новое направление .
Добро пожаловать в Сообщество HTX. Здесь вы сможете быть в курсе последних новостей о развитии платформы и получить доступ к профессиональной аналитической информации о рынке. Мнения пользователей о цене на S (S) представлены ниже.