XRP (XRP) откатился почти на 50% от своего многолетнего максимума в $3,66 и торгуется ниже $2, что является технической конфигурацией, которая может иметь «медвежьи последствия» для его цены, по мнению ветерана-аналитика Питера Брандта.
Ключевые моменты:
XRP выглядел медвежьим ниже $2, при этом технические индикаторы на графике указывают на движение к $1.
Успешное тестирование поддержки на уровне $1,78 может аннулировать медвежий сценарий.
Сформировалась ли вершина XRP?
Техническая конфигурация XRP показывает, что его неспособность удержаться выше уровня поддержки в $2 подвергает альткойн риску более глубокой коррекции.
В публикации в X в среду Питер Брандт заявил, что наличие модели «потенциального двойного вершин» может привести к падению XRP в ближайшие недели или месяцы.
По теме: XRP падает ниже $2, несмотря на приток $1 млрд в ETF: Насколько низко может упасть цена?
Модель двойного вершин все еще действует на недельном графике (см. ниже) и будет подтверждена, как только XRP завершит неделю ниже линии шеи на уровне $2.
Если цена восстановит уровень линии шеи, это падение может превратиться в медвежью ловушку, аннулировав медвежий сценарий.
«Конечно, это может не сработать, и я разберусь с этим, если так и произойдет», — сказал Брандт, добавив:
«Но пока что это имеет медвежьи последствия.»
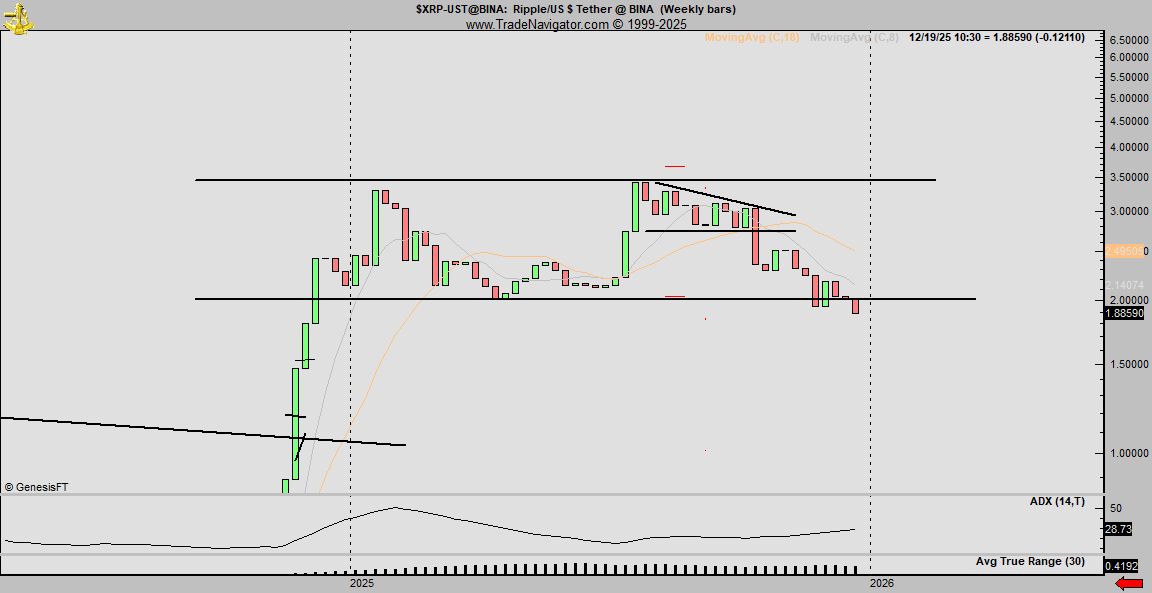
Если цена останется ниже линии шеи, пара может initially рухнуть до $1,65, где в настоящее время находится 100-недельная простая скользящая средняя (SMA). Ниже этого уровня последний рубеж обороны для XRP обеспечивает 200-недельная SMA около $1,07.
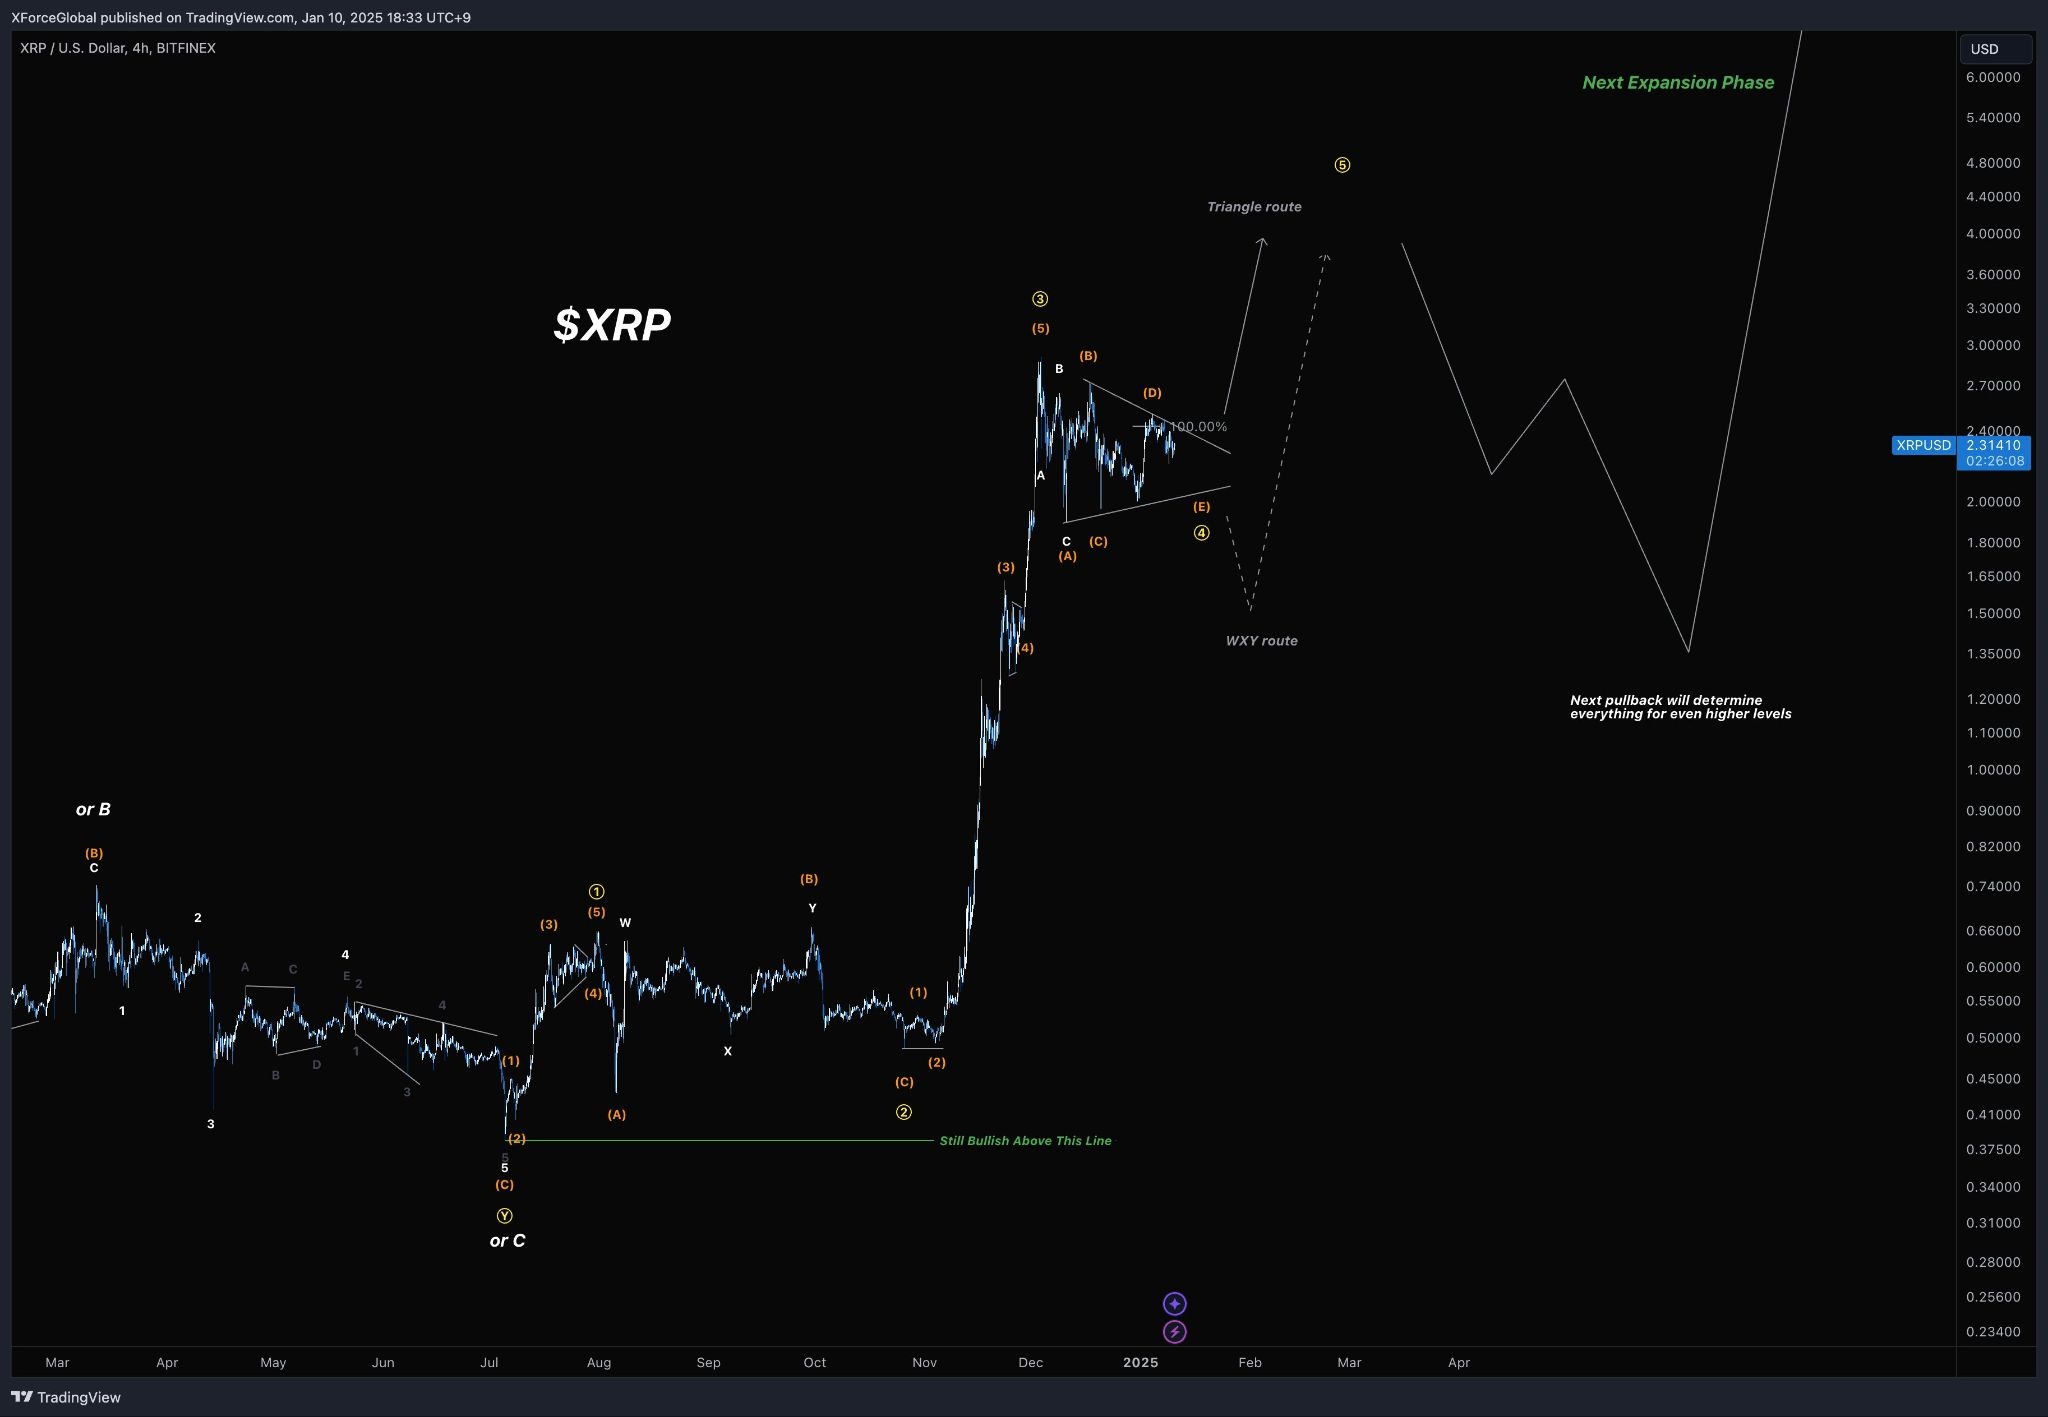
Аналитик XForceGlobal attributed это медвежье смещение к корректирующему движению волны 3, которое является частью «5-волнового импульса после пробоя треугольника», как показано на графике ниже.
По словам аналитика, использующего теорию волн Эллиотта, XRP может упасть в область $1,20-$1,35, в финальной откатной волне, которая «определит все необходимое для следующей фазы расширения», добавил аналитик.
Как сообщал Cointelegraph, шансы на то, что пара XRP/USDT рухнет до минимума 10 октября в $1,25, увеличились, как только цена XRP развернулась вниз от 20-дневной скользящей средней около $2.
Фрактальная конфигурация XRP 2018 года повторяет цель в $1
Текущая структура XRP очень близко mirrorит конфигурацию, которая спровоцировала его обвал в медвежьем рынке 2018 года.
График ниже suggests, что регион $2 ведет себя так же, как последняя линия поддержки, которую XRP потерял прямо перед тем, как рухнуть на 70% семь лет назад.
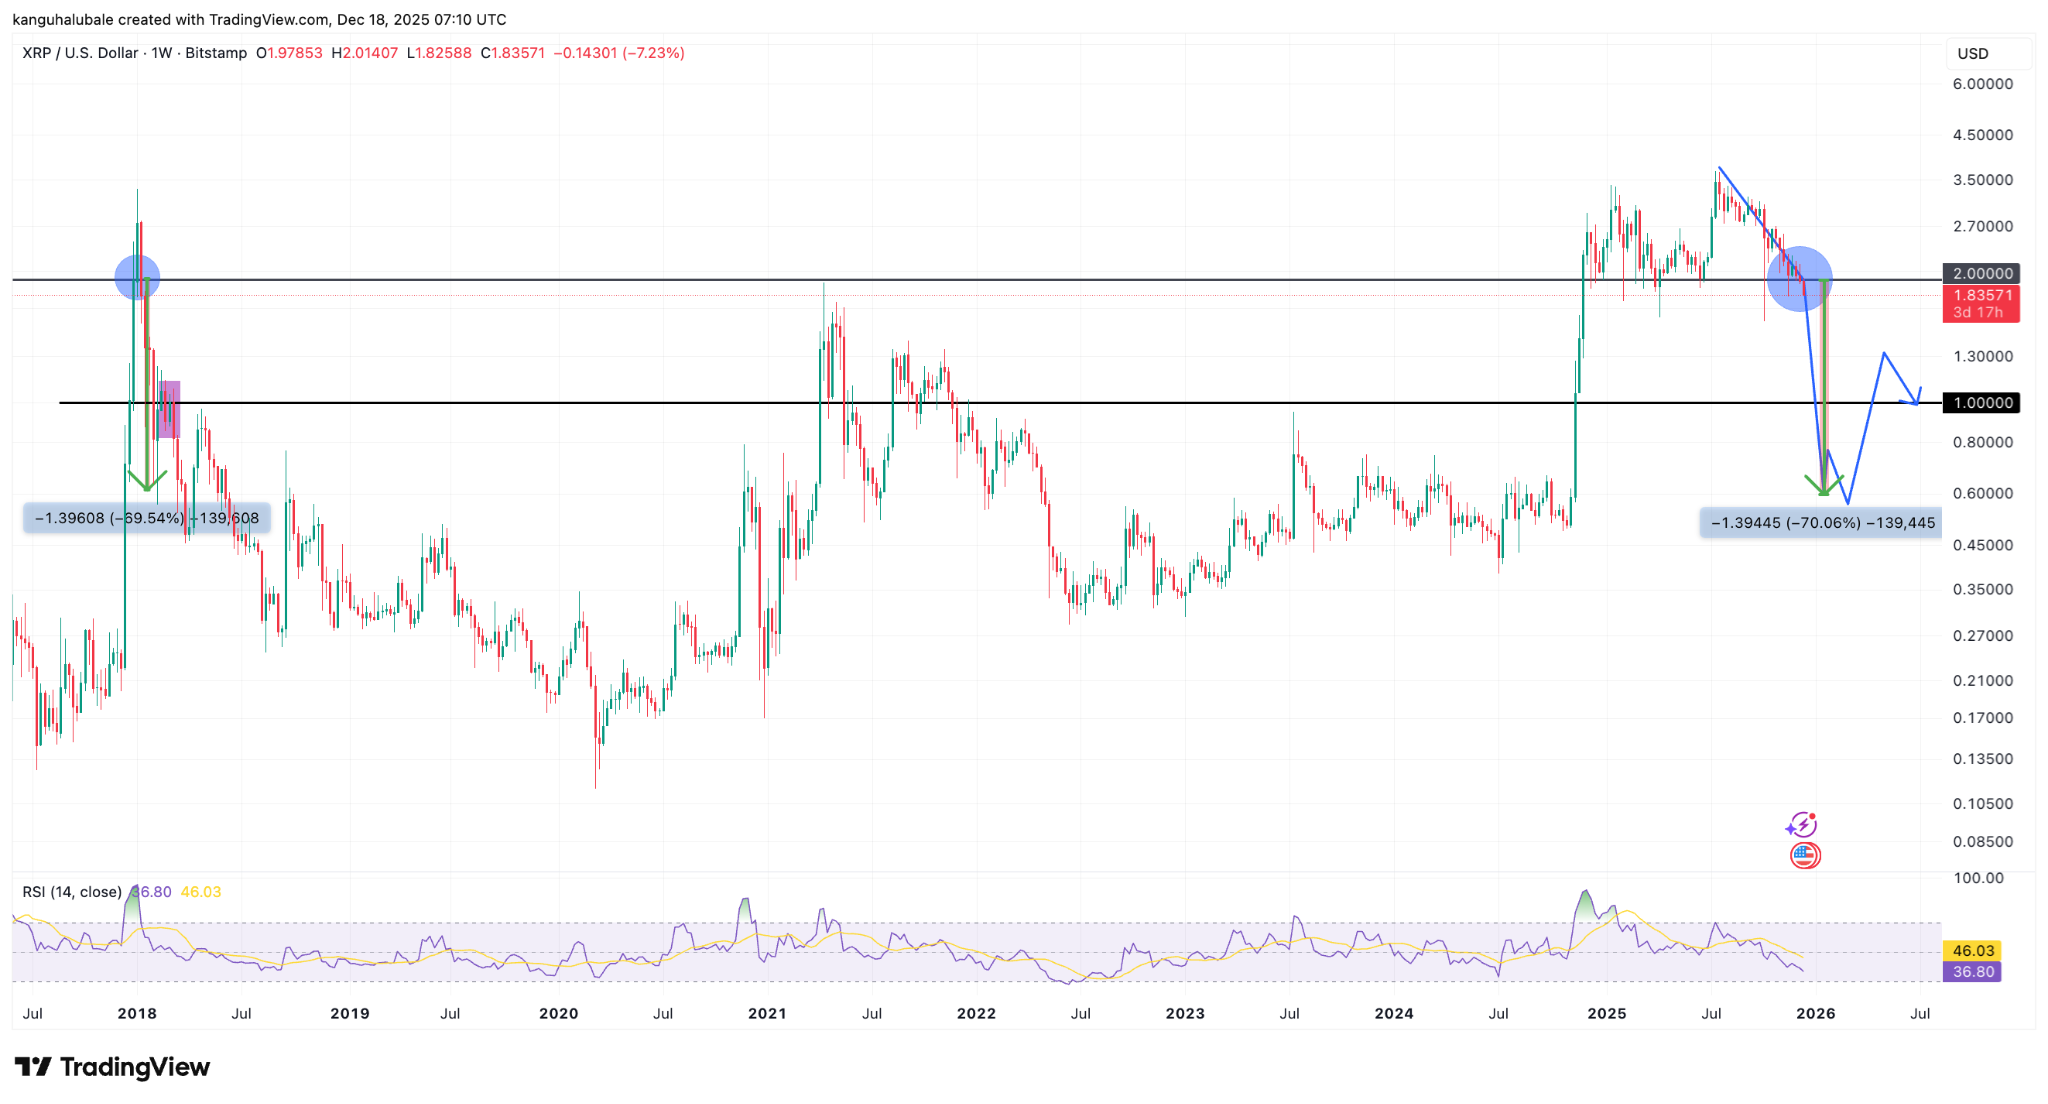
Поскольку цены борются ниже $2, а продавцы берут контроль, XRP имеет потенциал упасть еще на 70% до $0,60, прежде чем восстановиться и стабилизироваться около $1, повторяя откат, последовавший за аналогичной технической конфигурацией в 2018 году.
XRP в настоящее время сталкивается с renewed давлением на понижение, поскольку ослабевающая активность на derivatives рынке и ончейн-позиционирование угрожают отправить пару XRP/USD к $1.
Не вся надежда потеряна для быков XRP
Несмотря на медвежьи настроения, XRP все еще торгуется выше ключевого уровня поддержки, который быки должны удержать, чтобы предотвратить дальнейшее падение.
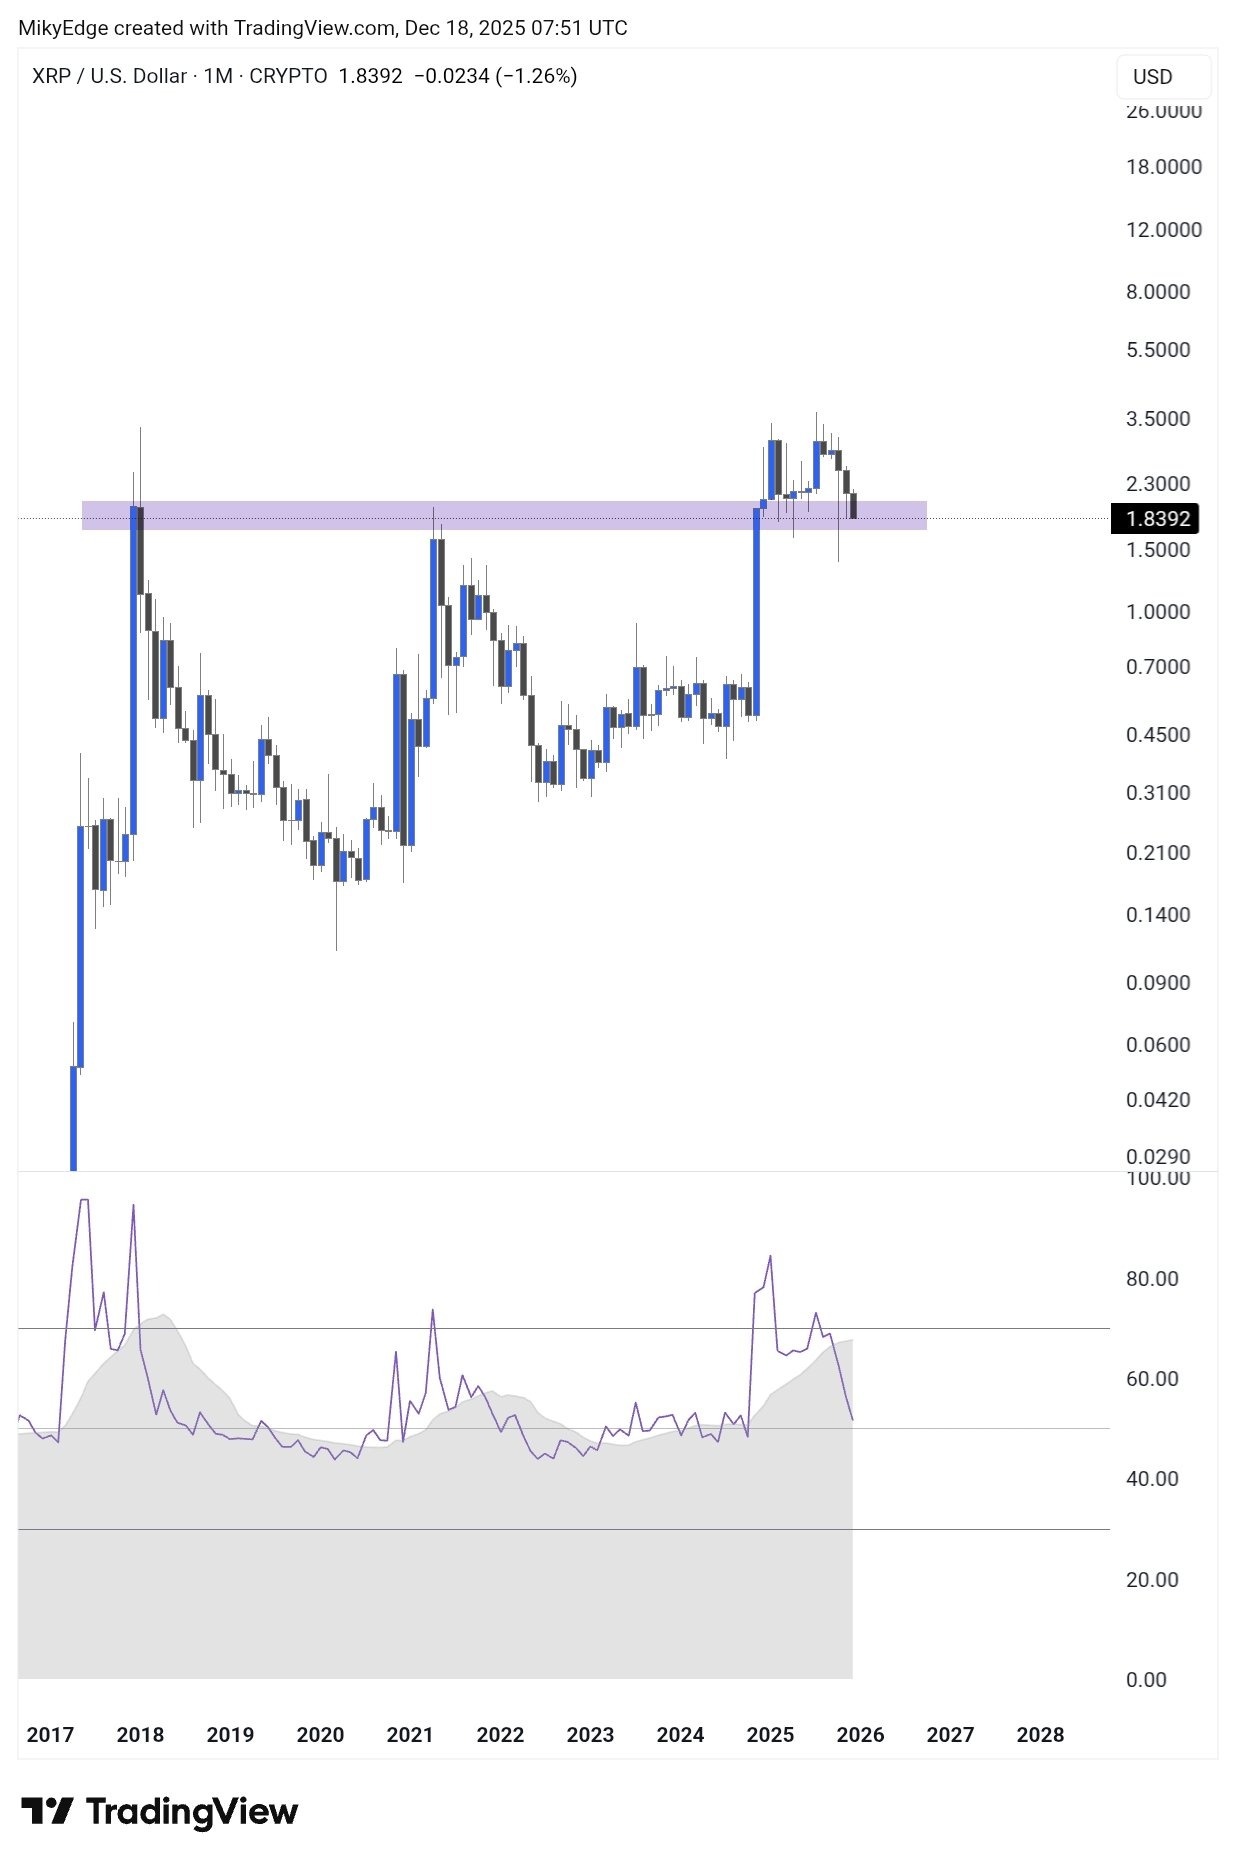
Распределение реализованных цен UTXO (URPD) от Glassnode — метрика, которая показывает средние цены, по которым держатели SOL покупали свои монеты — reveals, что следующая значительная поддержка находится на уровне $1,78, где approximately 1,85 миллиарда XRP были приобретены ранее.
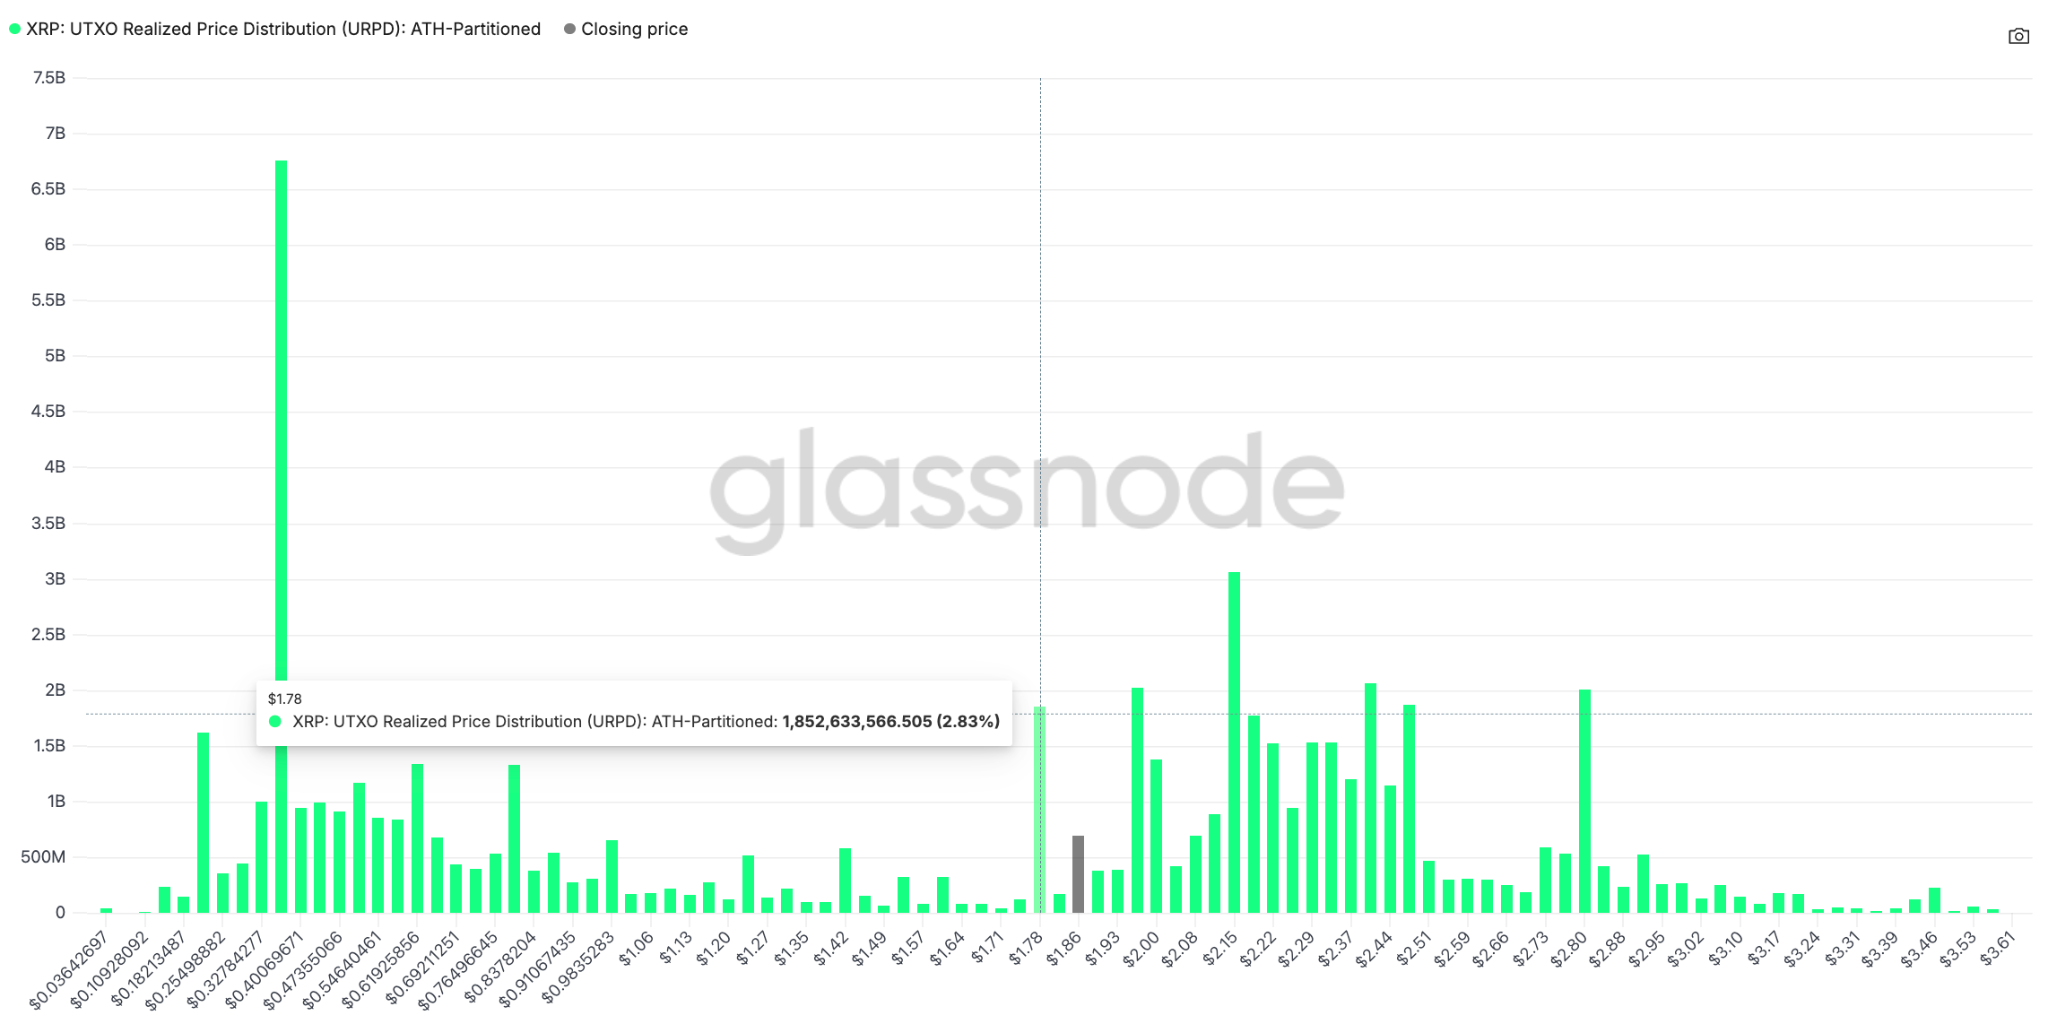
«XRP needs to hold this support line», — сказал Mikybull Crypto, referring to зоне спроса $1,70-$1,80 на месячном таймфрейме.
«Otherwise, it’ll be carnage.» (В противном случае, это будет бойня.)
Эта статья не содержит инвестиционных советов или рекомендаций. Каждое инвестиционное и торговое решение связано с риском, и читатели должны провести собственное исследование при принятии решения. Хотя мы стремимся предоставлять точную и своевременную информацию, Cointelegraph не гарантирует точность, полноту или надежность любой информации в этой статье. Эта статья может содержать прогнозные заявления, которые подвержены рискам и неопределенностям. Cointelegraph не несет ответственности за любые убытки или ущерб, возникшие в результате вашей reliance на эту информацию.