Автор: Elad Gil (Анализ данных: Shreyan Jain)
Компиляция: Deep Tide TechFlow
Введение от Deep Tide: Команда Элада Гила шестой год подряд отслеживает распределение глобальной капитализации единорогов. Данные за 2025 год указывают на четкий вывод: район залива Сан-Франциско становится суперкластером генеративного ИИ, где в радиусе часа езды сосредоточено 91% стоимости частных единорогов в сфере ИИ. В то же время скорость появления новых единорогов замедляется, но средняя оценка существующих единорогов достигла шестилетнего максимума. Этот отчет с помощью точных данных раскрывает, как центр тяжести глобальной предпринимательской экосистемы ускоряющимися темпами смещается в сторону США и specifically района залива.
Все данные приведены по состоянию на 31 декабря соответствующего года, в дальнейшем «2025» означает стоимость на дату 31 декабря 2025 года / 1 января 2026 года.
За последние два года мы пережили рыночную коррекцию после эры нулевых процентных ставок, взрывной рост передовых лабораторий ИИ, таких как OpenAI и Anthropic, и продолжающиеся дебаты вокруг «пузыря ИИ». Данные показывают, что район залива Сан-Франциско превратился в суперкластер ИИ, где 91% мировой частной капитализации ИИ сосредоточен в радиусе часа езды.
Предыдущие анализы можно найти по ссылкам: 2019, 2020, 2021, 2023.
Ключевые выводы
- Генеративный ИИ превратил район залива в суперкластер. На район залива в настоящее время приходится около 39% глобальной стоимости единорогов, что более чем в 4 раза превышает показатель второго по величине города; годом ранее эта цифра составляла всего 29%. Если рассматривать только единорогов в сфере генеративного ИИ, доля района залива достигает 91%.
- Абсолютное доминирование американских единорогов. За последний год США добавили около 1,2 триллиона долларов стоимости единорогов, что составляет около 65% от глобального показателя. Европа по доле рыночной стоимости обогнала Китай, но все же составляет всего около 10%.
- Новое поколение единорогов более сконцентрировано в США и районе залива. Среди единорогов, появившихся в 2023 году и позже, на США приходится 83% общей стоимости, тогда как среди тех, кто появился в 2022 году и ранее, — только 60%. Доля района залива еще более разительна: 63% у нового поколения против 33% у старого.
- Скорость появления новых единорогов замедляется. В период с 2022 по 2025 год появилось только около 300 новых единорогов, тогда как за предыдущие три года их было более 900.
- Но существующие единороги стоят дороже, чем когда-либо. Общее количество единорогов выросло всего на 6% в годовом исчислении, но общая рыночная стоимость увеличилась на 33%. Средняя стоимость одного единорога достигла самого высокого уровня за шесть лет.
- Рост оценок в основном обусловлен компаниями ИИ. В 2025 году оценка единорогов в сфере генеративного ИИ в среднем выросла примерно на 2,2 миллиарда долларов, в то время как у не-ИИ единорогов — всего на около 400 миллионов долларов. Доля генеративного ИИ в глобальной стоимости единорогов взлетела с 2% в 2024 году до 22%. Концентрация в районе залива будет только усиливаться.
- Центры единорогов группируются вокруг определенных отраслей. В первой десятке единорогов района залива 6 — это компании ИИ; в Нью-Йорке в первой десятке 7 — финтех/криптокомпании; в Лос-Анджелесе в первой пятерке 3 — компании оборонной/космической отрасли (SpaceX, Anduril, Relativity, что составляет 83% от общей стоимости Лос-Анджелеса), а в первой десятке также 4 потребительские компании.
Примечания к данным
Все исходные данные получены от CB Insights, с ними можно ознакомиться здесь. Несколько моментов:
Обновления данных о частных раундах финансирования в публичных наборах данных запаздывают, поэтому некоторые оценки единорогов могут быть не самыми свежими. Например, последние раунды финансирования Anduril, Stripe и SpaceX не отражены в данных.
Стоимость единорогов является в лучшем случае грубым, запаздывающим индикатором активности предпринимательской экосистемы, и при сопоставлении компаний с оценками, городами и отраслями难免 возникают неточности. Но мы считаем, что данные в целом верны по основным направлениям.
Концентрация единорогов
Географическая концентрация глобальной стоимости единорогов достигла исторического максимума. На США приходится 65% стоимости всех единорогов, что выше 58% годом ранее и 44% в 2020 году. Доля США примерно в 4 раза превышает долю Китая, который занимает второе место.
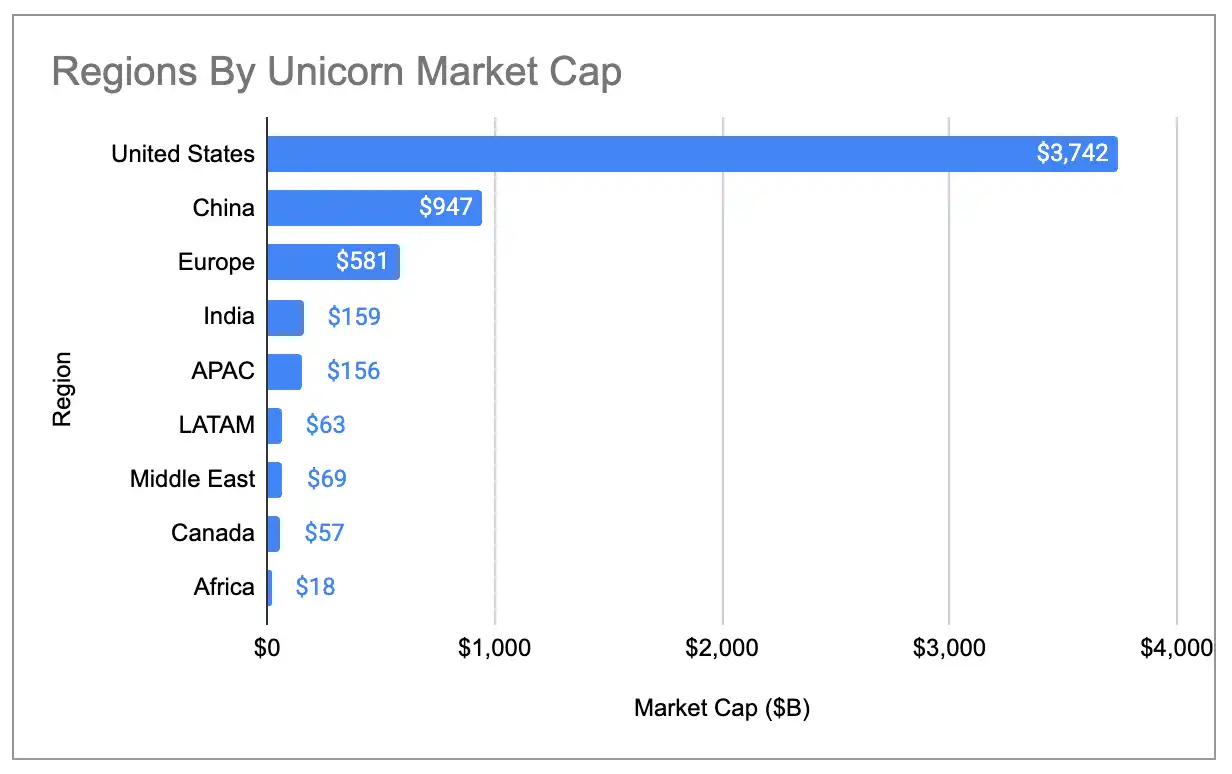
Подпись к графику: Доля стран в глобальной стоимости единорогов (включая три выброса)
Стоимость единорогов района залива также более чем в 4 раза превышает показатель второго по величине города, а глобальная доля выросла с 29% в 2024 году до 39%:
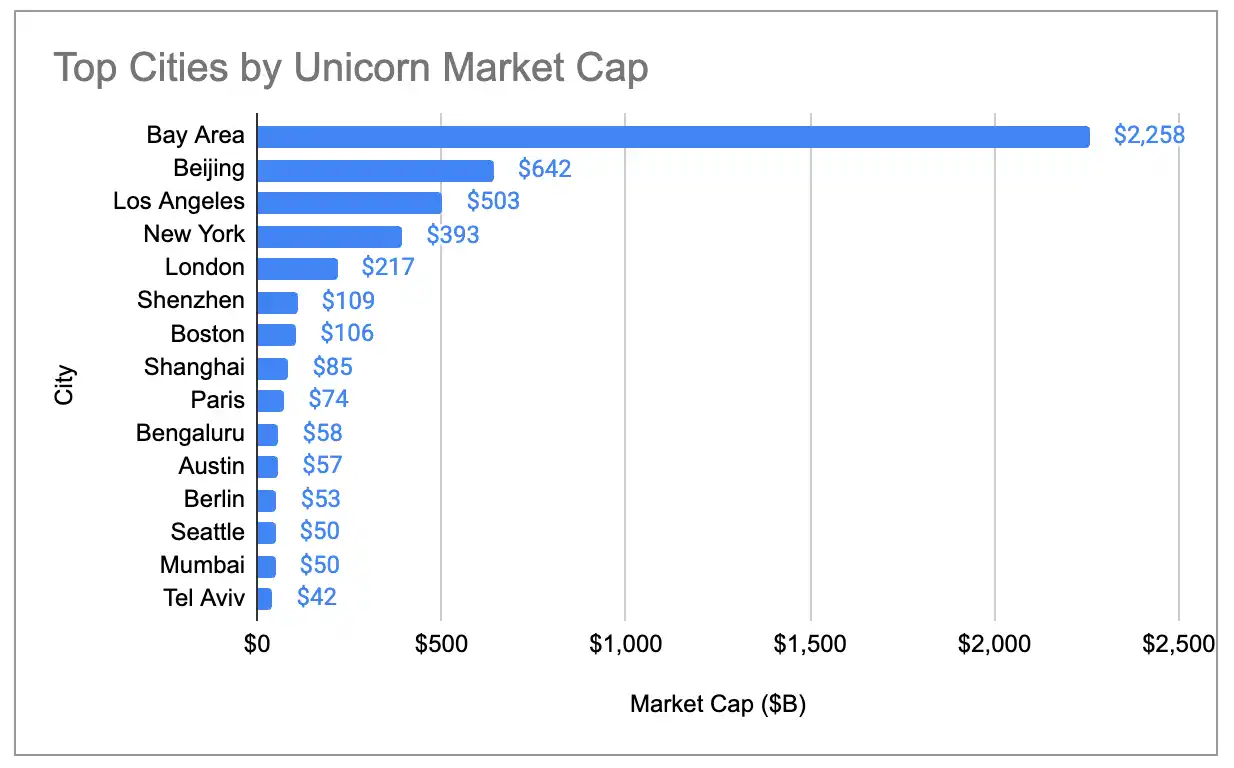
Подпись к графику: Доля городов в глобальной стоимости единорогов (включая три выброса)
Даже если исключить три крупнейших выброса — OpenAI (500 млрд долларов), SpaceX (400 млрд долларов) и ByteDance (300 млрд долларов), — крупные экосистемы с 2019 года продолжают концентрироваться. Доля США稳步 растет, Китая —稳步 снижается. Европа в 2024 году по общей стоимости единорогов уже обогнала Китай, а Нью-Йорк и Лондон — Пекин.
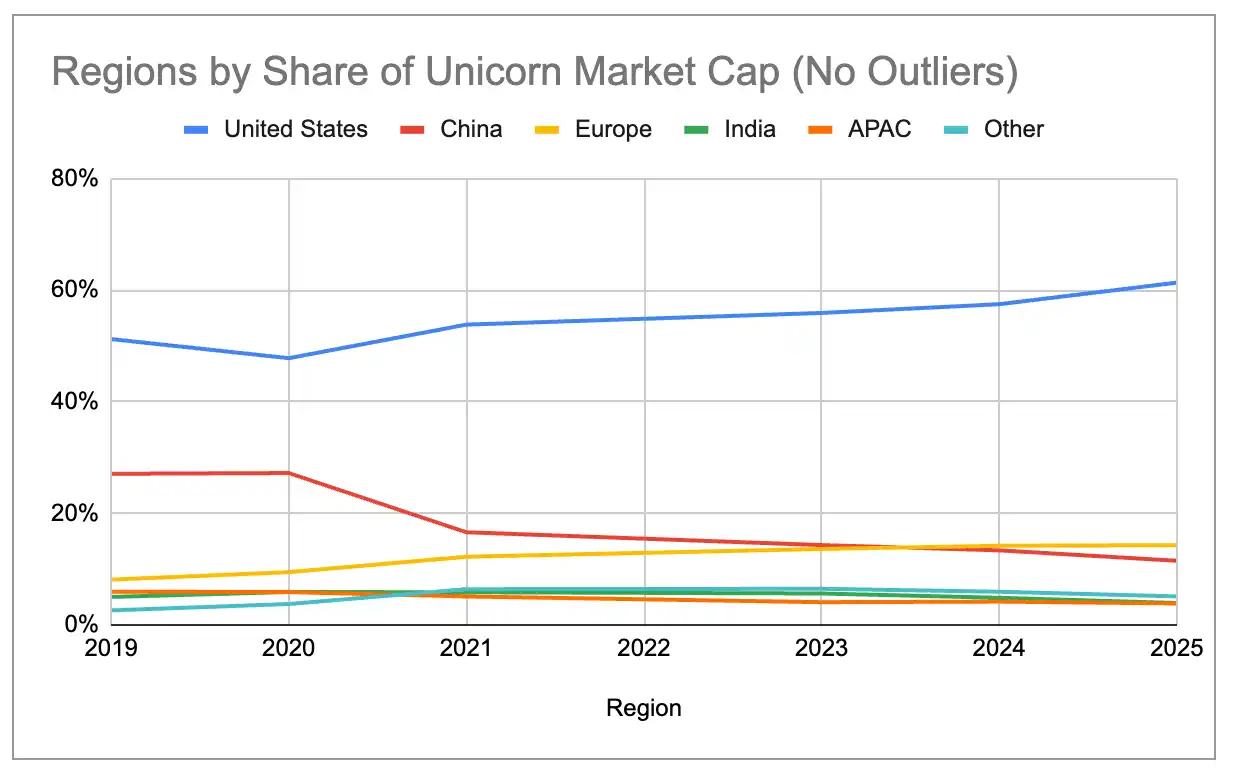
Подпись к графику: Доля стран в глобальной стоимости единорогов (исключая три выброса)
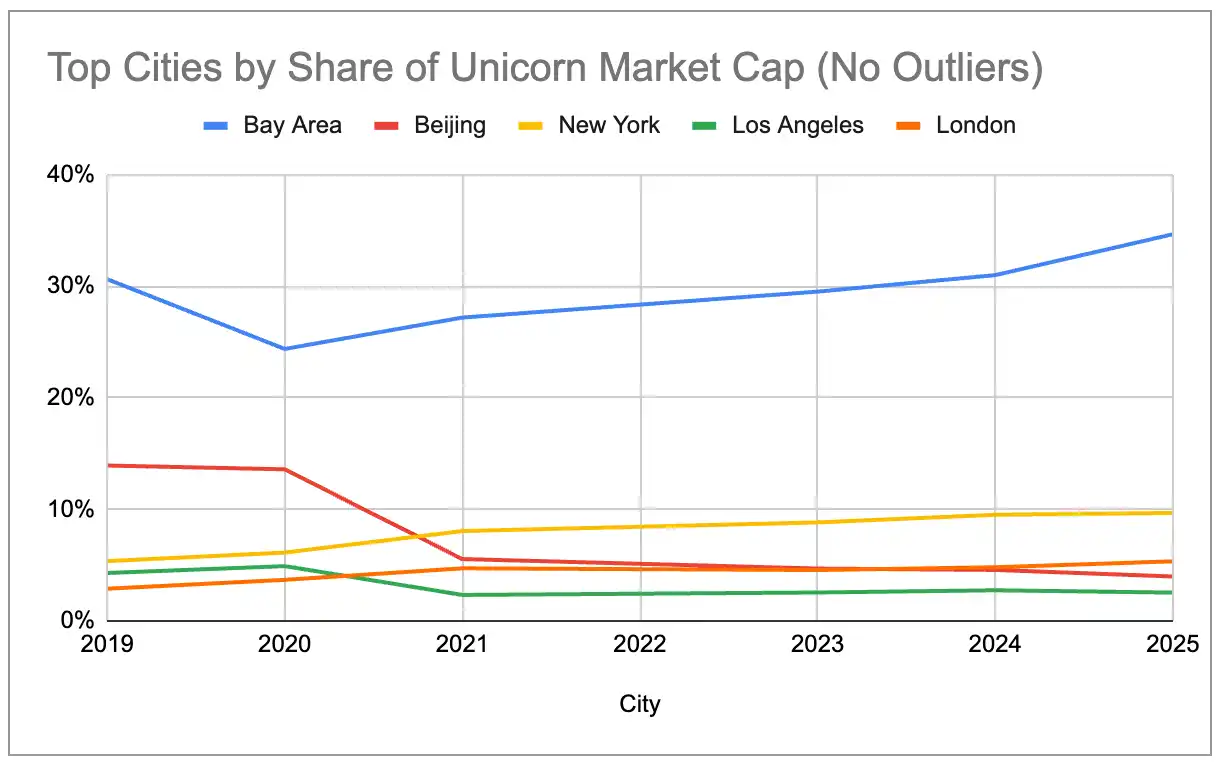
Подпись к графику: Доля городов в глобальной стоимости единорогов (исключая три выброса)
Сверхконцентрация генеративного ИИ
Если рассматривать только 97 единорогов, для которых продукты/услуги генеративного ИИ являются основным источником дохода, кластерный эффект района залива становится еще более экстремальным. На район залива приходится 91% глобальной стоимости единорогов ИИ, ни один другой город не превышает 2%.
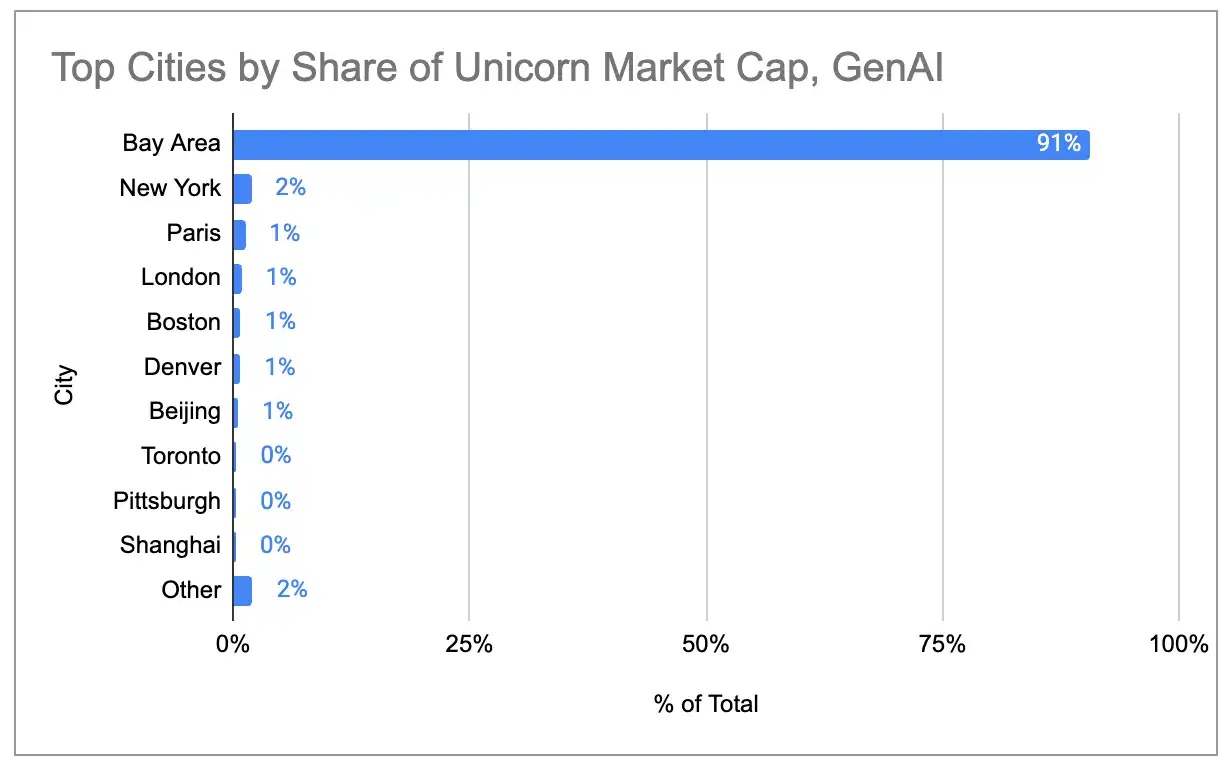
Подпись к графику: Распределение стоимости единорогов генеративного ИИ по городам
Общая стоимость единорогов генеративного ИИ растет экспоненциально, и почти весь прирост обеспечен США, особенно районом залива.
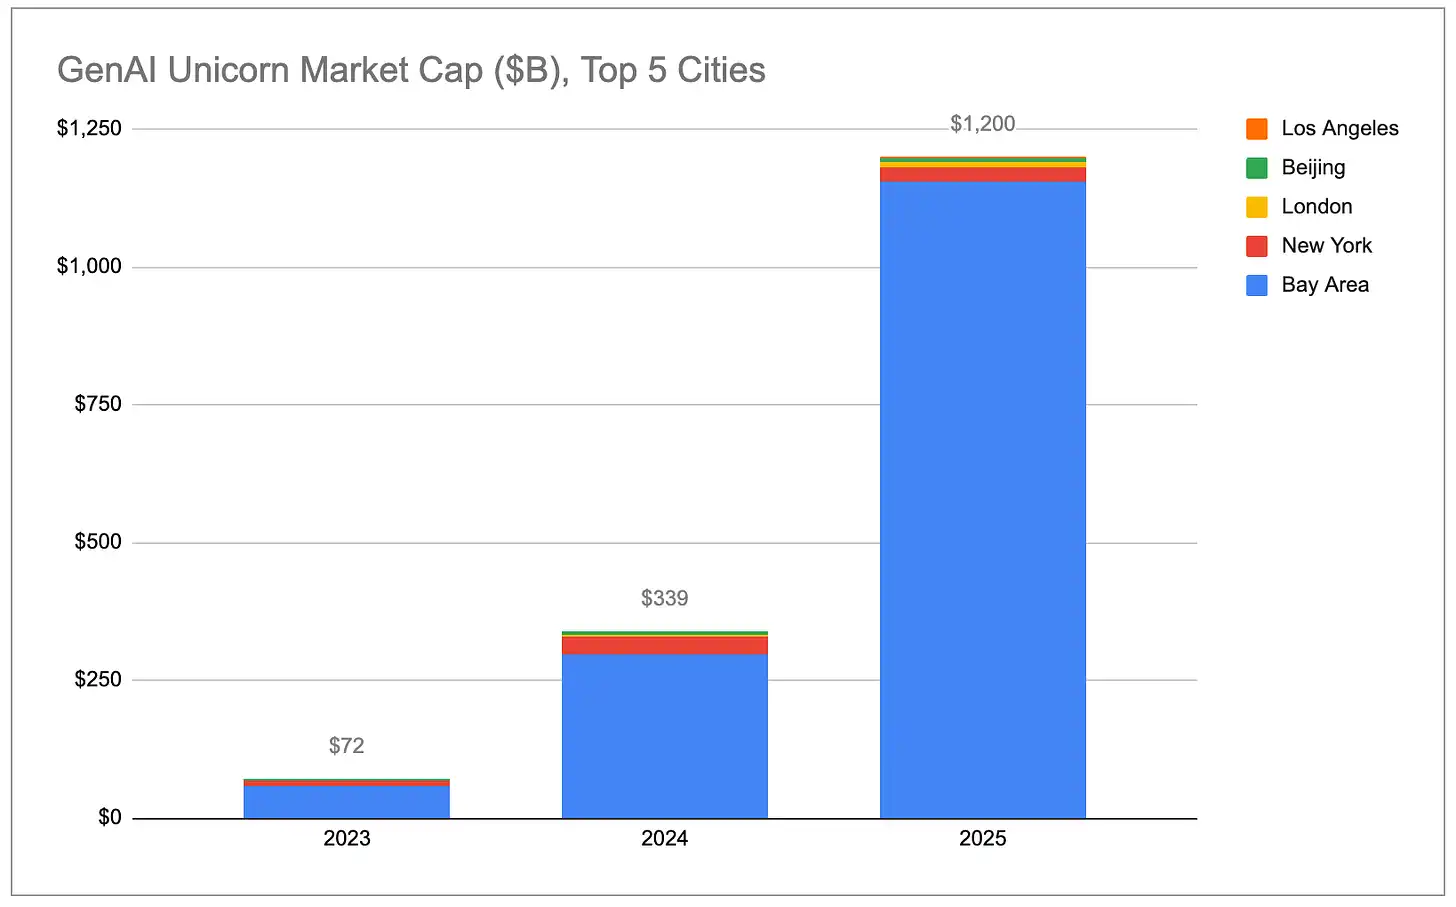
Подпись к графику: Общая стоимость единорогов генеративного ИИ (по странам)
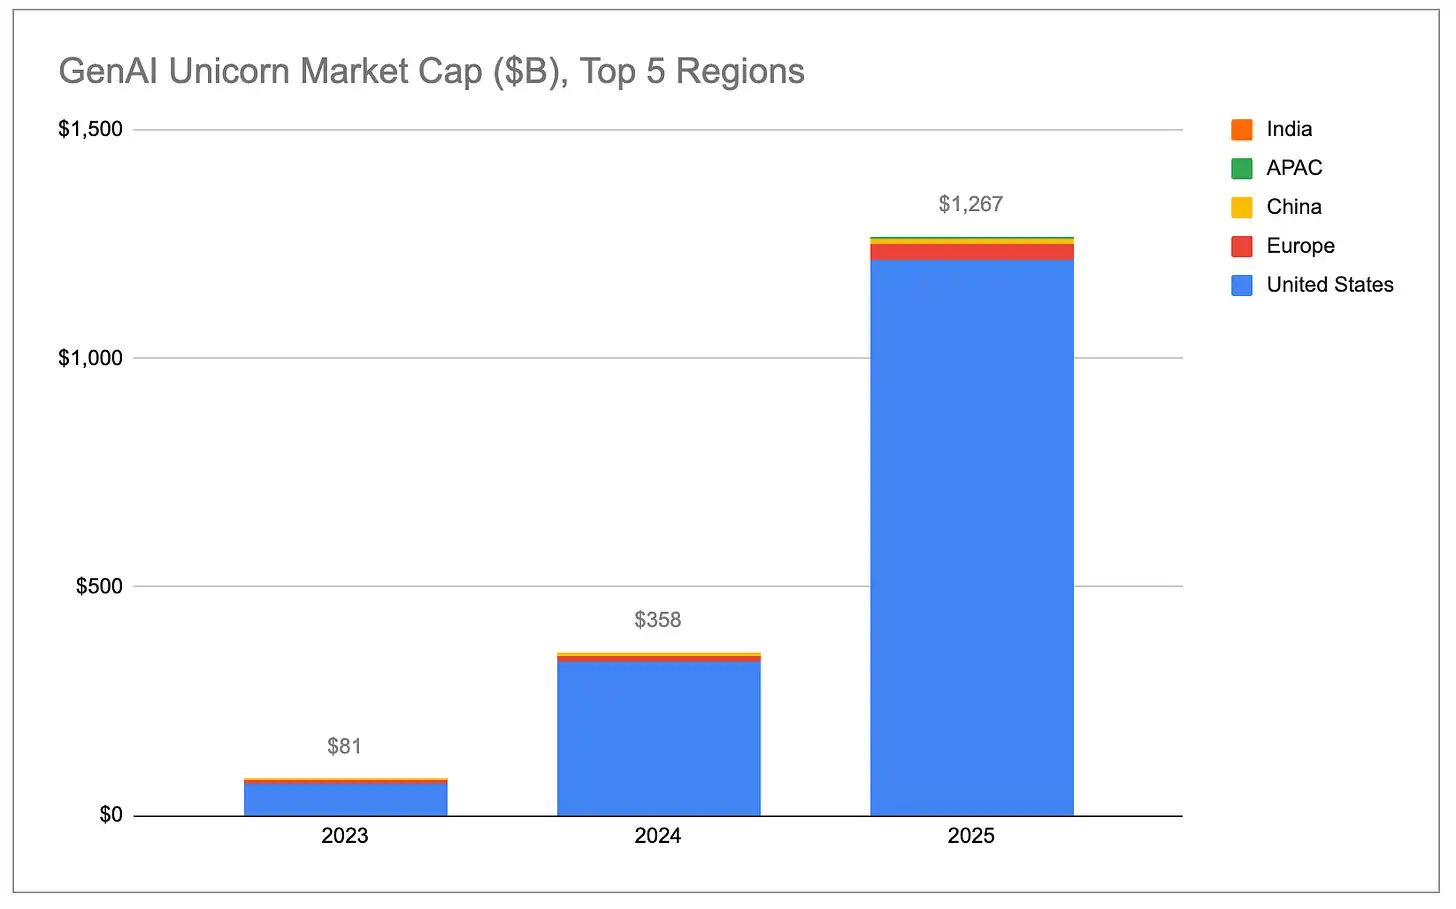
Подпись к графику: Общая стоимость единорогов генеративного ИИ (по городам)
Оценки единорогов ИИ растут гораздо быстрее, чем не-ИИ единорогов. 48 компаний ИИ, ставших единорогами в течение 2025 года, за этот год увеличили свою общую стоимость на 778 миллиардов долларов. Эта цифра превышает совокупный прирост стоимости более чем 1100 остальных не-ИИ единорогов. Даже если исключить OpenAI (прирост около 343 млрд долларов) и Anthropic (прирост около 334 млрд долларов), средний прирост оценки единорогов генеративного ИИ в годовом исчислении все равно составляет около 2,2 млрд долларов, что в 5 раз превышает средний прирост не-ИИ единорогов (около 440 млн долларов).
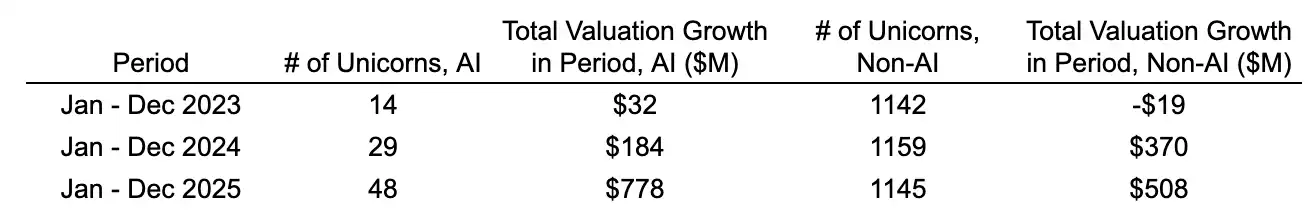
Подпись к графику: Сравнение роста стоимости ИИ-единорогов и не-ИИ-единорогов
В относительном выражении доля компаний генеративного ИИ выросла с 2% от глобальной стоимости единорогов в 2023 году до 22%. Если эта тенденция сохранится, то район залива, благодаря своей фактической монополии на ведущие компании и таланты в сфере ИИ, будет увеличивать свою долю в глобальной стоимости единорогов.
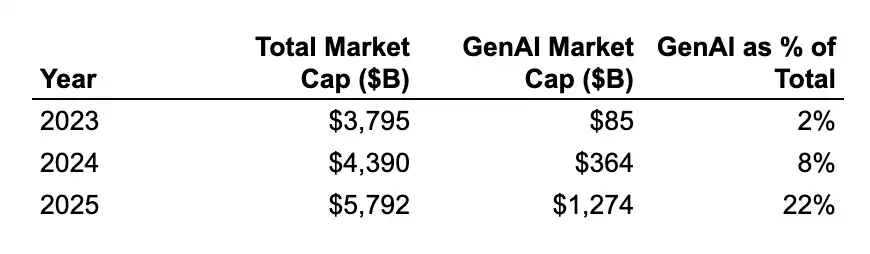
Подпись к графику: Изменение доли генеративного ИИ в общей стоимости единорогов
(Примечание: Мы классифицируем как «генеративный ИИ» только те компании, основной доход которых напрямую связан с генеративным ИИ. Полный список компаний можно посмотреть здесь. Мы включили чип/аппаратные компании, такие как Cerebras, TensTorrent, а также инфраструктурные компании, такие как CoreWeave, Crusoe, но не включили компании инфраструктуры данных, такие как Databricks, которые более широко поддерживают рабочие нагрузки AI/ML, а также робототехнические/оборонные компании, такие как Anduril, которые используют AI/ML для автономных систем.)
Новые единороги
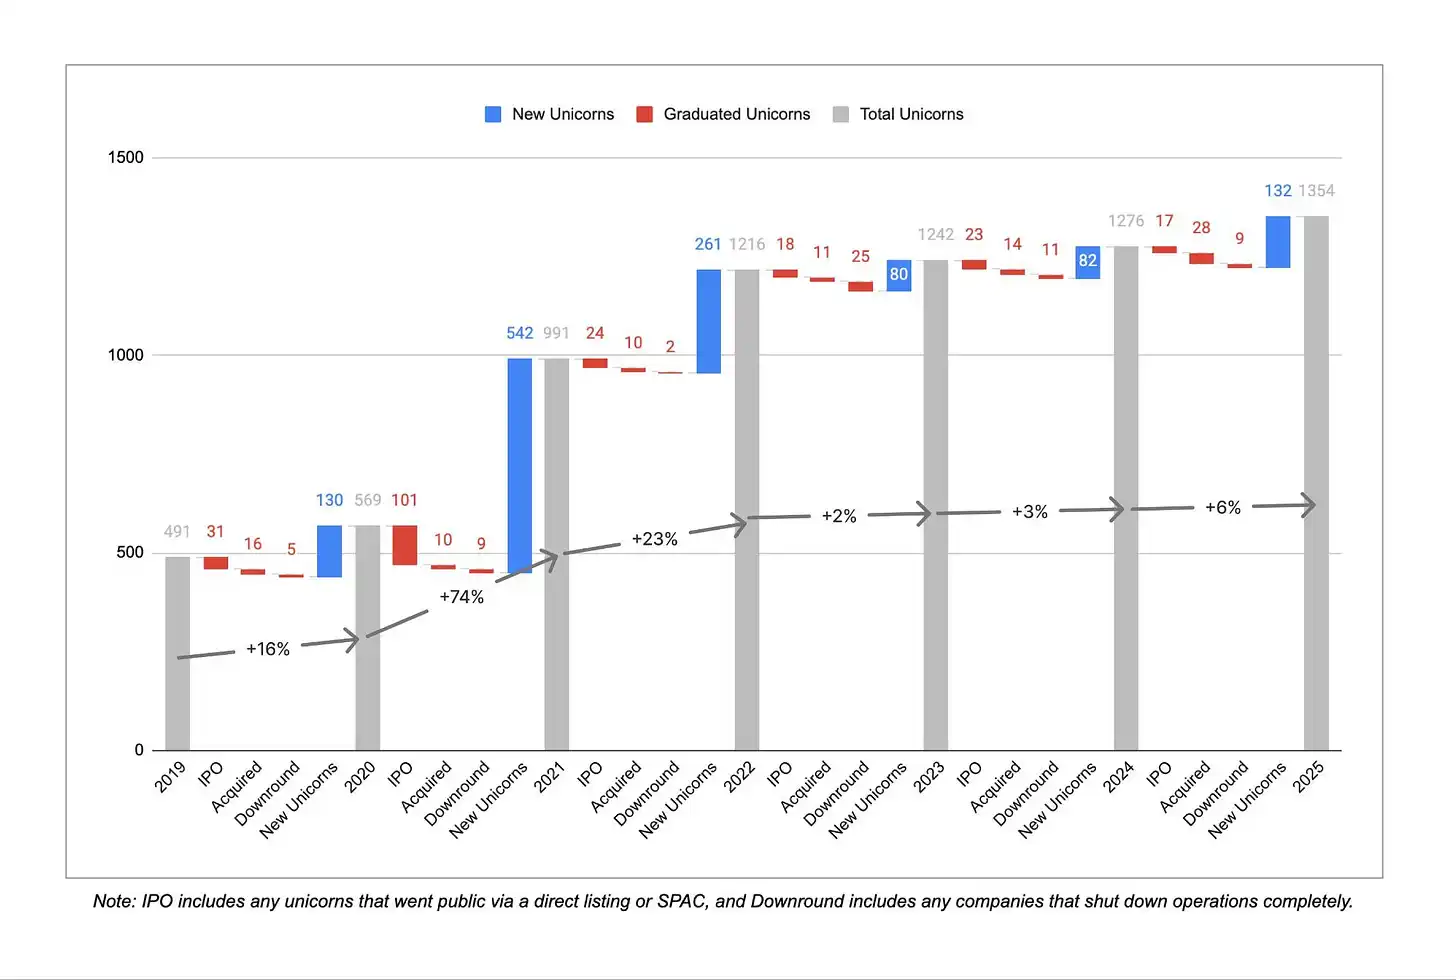
Подпись к графику: Количество новых единорогов в год
После трех лет подряд высокого роста скорость появления новых единорогов за последние три года заметно замедлилась. В период с декабря 2019 года по декабрь 2022 года в среднем около 300 компаний впервые достигали статуса единорога ежегодно. С декабря 2022 года по декабрь 2025 года это число упало до примерно 100 в год, хотя в 2025 году наблюдалось некоторое восстановление по сравнению с двумя предыдущими годами. В то же время за последние три года 45 компаний потеряли статус единорога из-за снижения оценки или закрытия, тогда как за предыдущие три года таких было только 16, что свидетельствует о продолжающейся коррекции завышенных оценок эпохи нулевых ставок 2021/2022 годов.
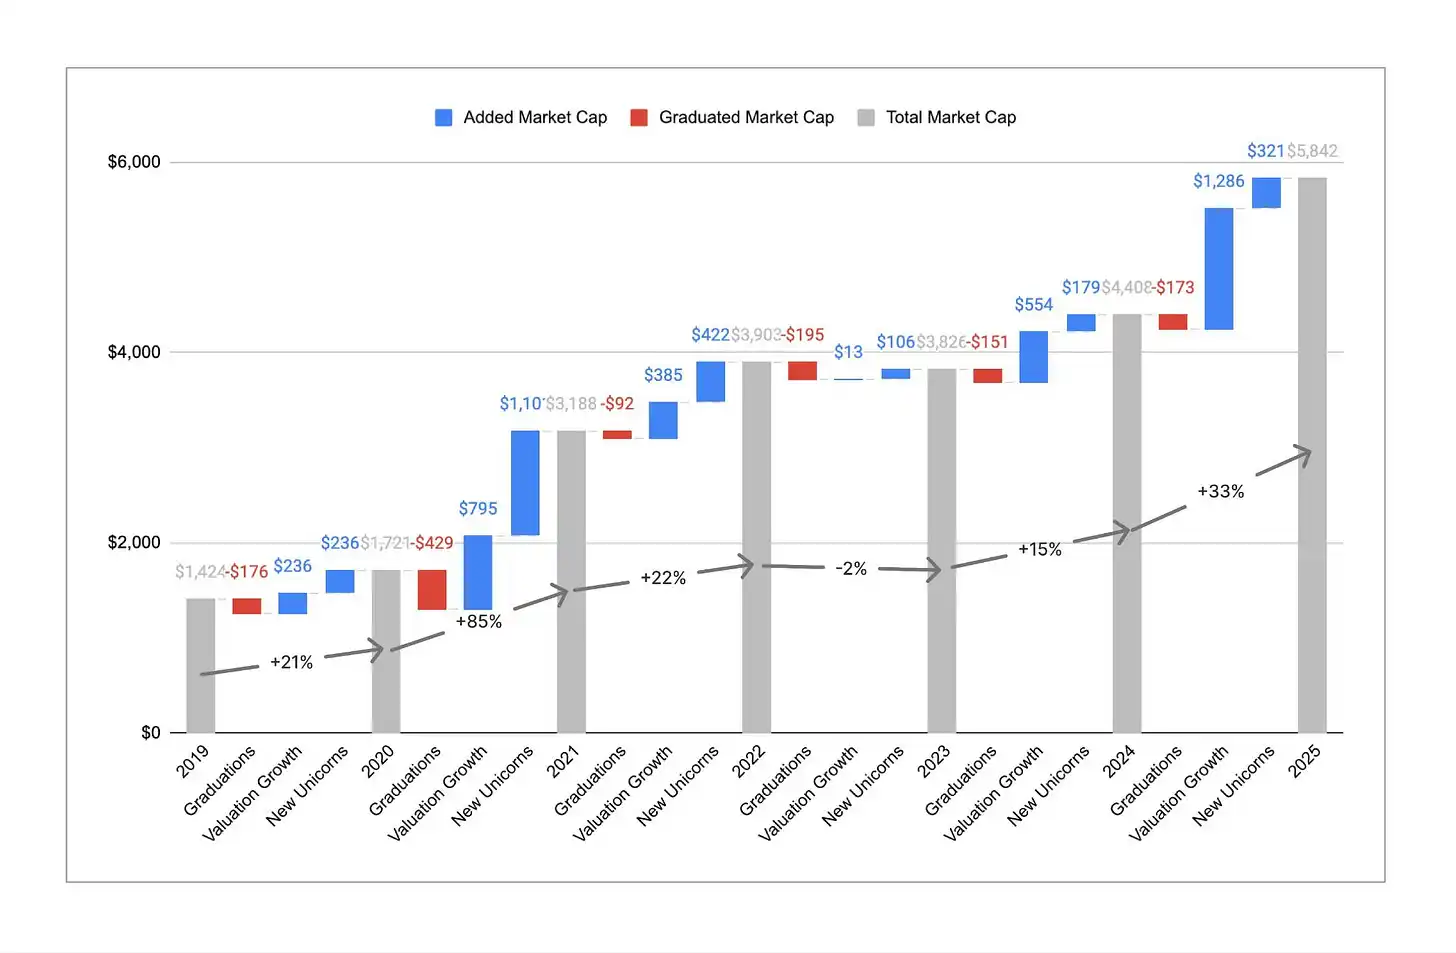
Подпись к графику: Тенденции количества единорогов и общей стоимости
Хотя количество единорогов в основном осталось неизменным, общая стоимость значительно выросла. За последний год глобальная общая стоимость единорогов выросла с примерно 4,4 трлн долларов до примерно 5,8 трлн долларов, прирост составил 33%. Это стало мощным отскоком, особенно по сравнению с 2023 годом, когда общая стоимость фактически сократилась в годовом исчислении. Исторически рост стоимости в большей степени обеспечивался за счет новых компаний, становящихся единорогами, но в 2025 году около 80% роста стоимости пришлось на повышение оценки существующих единорогов. В результате средняя стоимость одного единорога выросла с примерно 3 млрд долларов до примерно 4,4 млрд долларов, что является самым высоким показателем за шесть лет нашего анализа. Стать единорогом стало сложнее, но一旦 преодолен порог в 1 миллиард долларов, эти компании в среднем стоят дороже и растут быстрее.
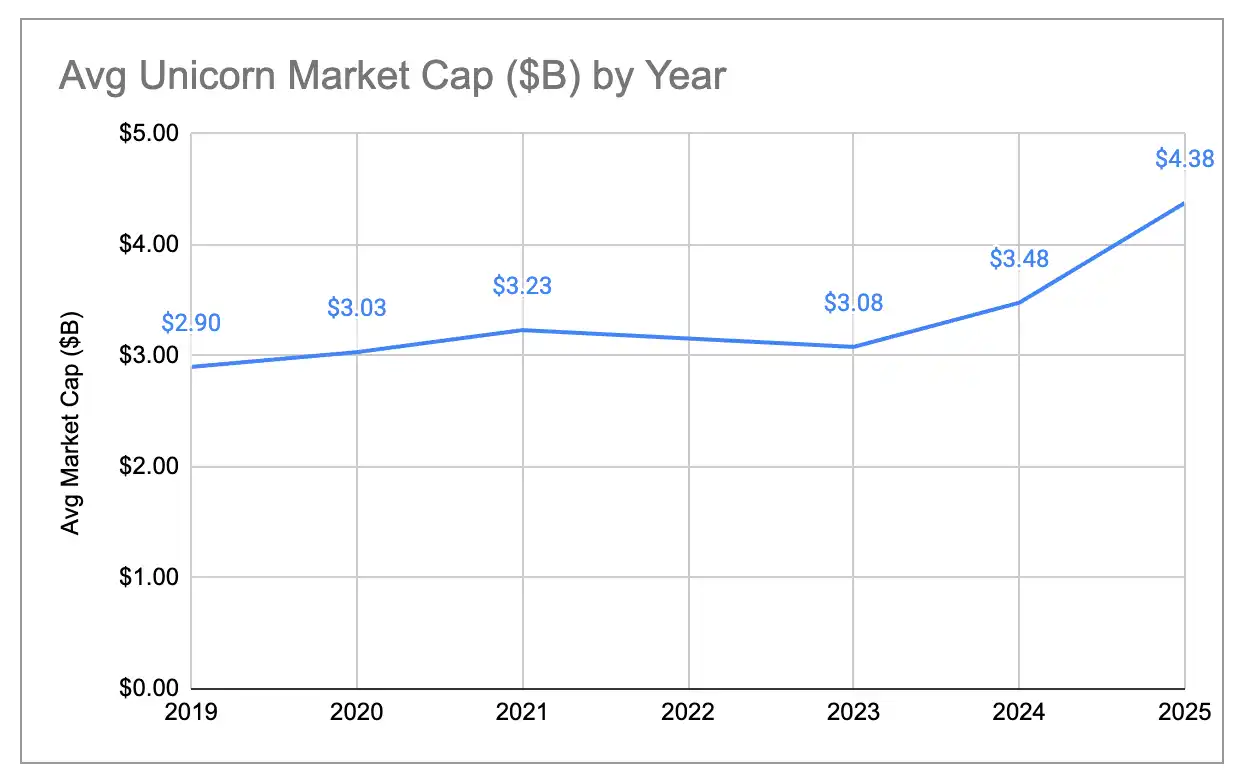
Подпись к графику: Тенденция изменения средней стоимости единорога
Новое поколение vs Старое поколение единорогов
Один из способов исключить влияние завышенных оценок эпохи нулевых ставок — посмотреть только на единорогов, появившихся после 2023 года. Вот сравнение распределения стоимости двух когорт единорогов: до и после 2023 года:
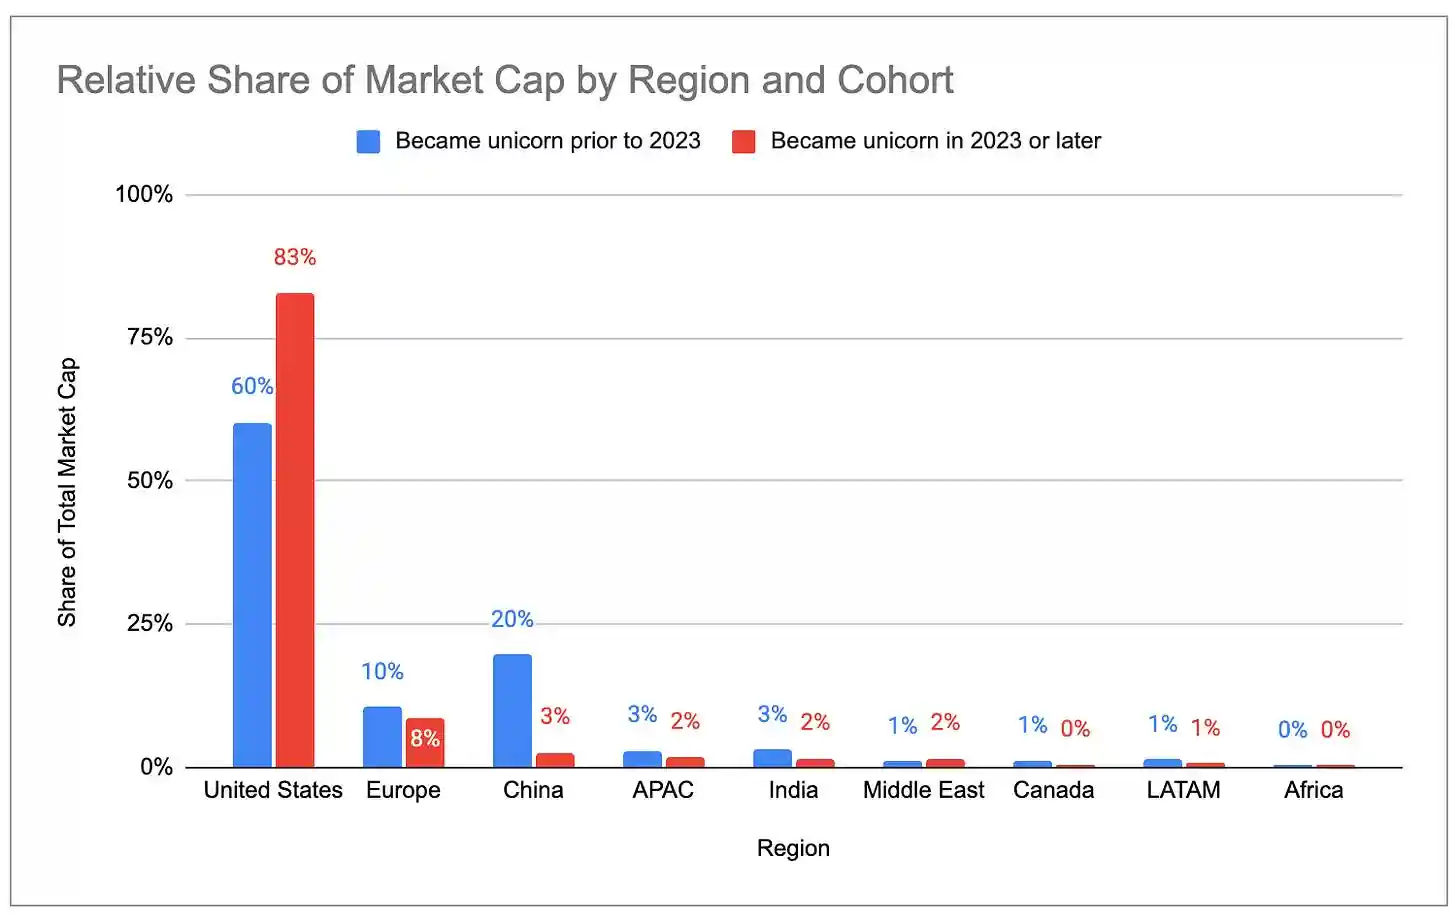
Подпись к графику: Распределение стоимости единорогов, появившихся до 2023 года (по странам/городам)
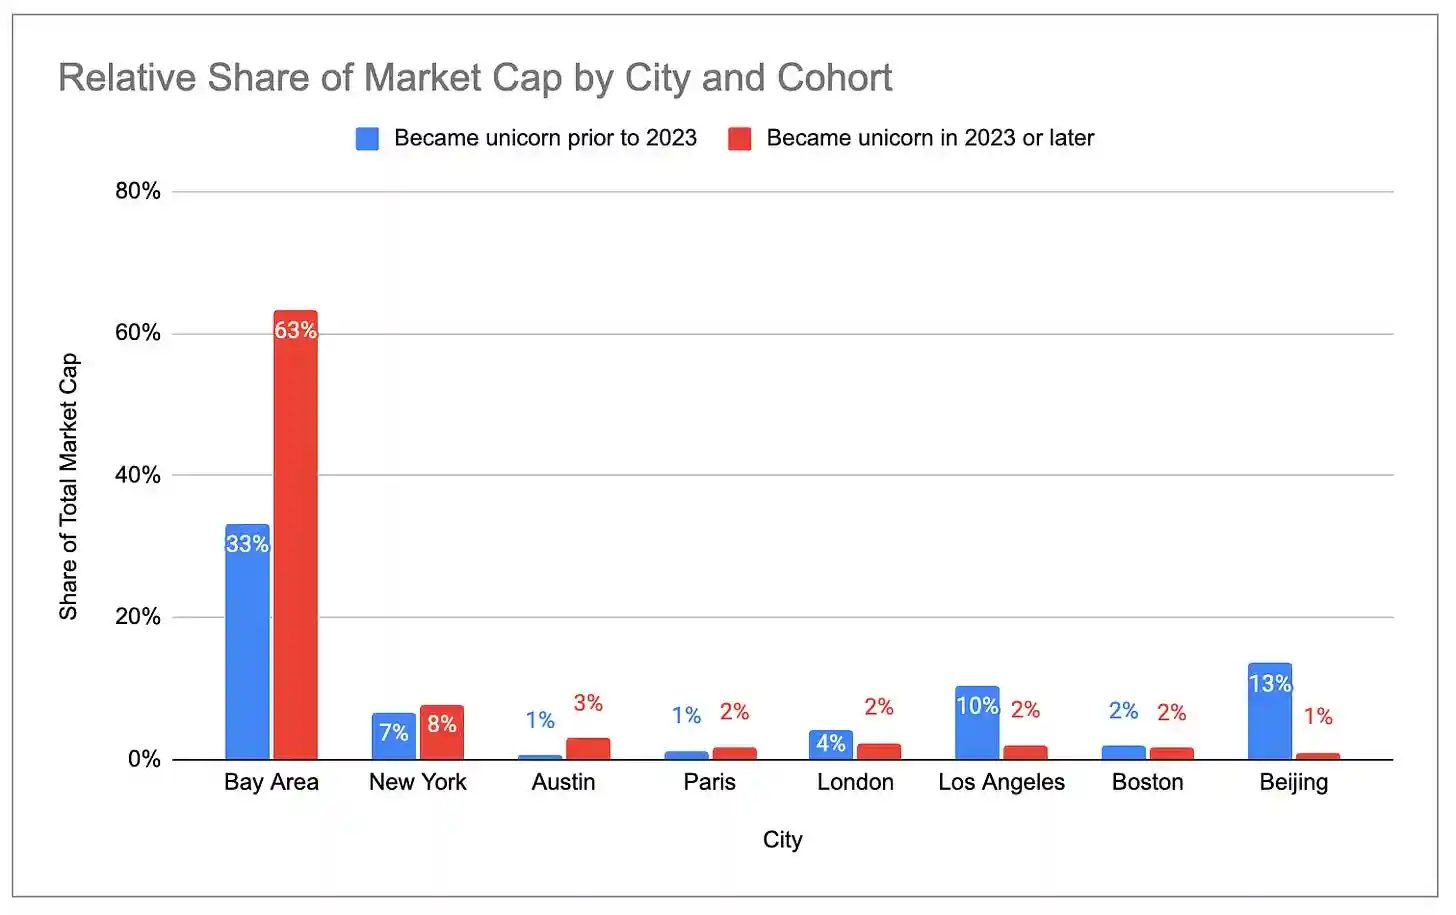
Подпись к графику: Распределение стоимости единорогов, появившихся в 2023 году и позже (по странам/городам)
Новое поколение единорогов более сконцентрировано в США, доля Европы и Китая снизилась. Среди единорогов, появившихся с 2023 года по настоящее время, на район залива приходится 63% стоимости, тогда как среди старого поколения единорогов на район залива приходилось только 33%.
«Зомби»-единороги
Из почти 1000 единорогов по состоянию на декабрь 2021 года около 60% сохранили статус единорога, но не провели ни одного нового раунда финансирования. Эти «зомби»-единороги в эпоху нулевых ставок привлекли достаточно денег, чтобы выжить до сих пор, но не смогли превзойти свою оценку тех лет. В совокупности они составляют около 1,4 трлн долларов от текущей глобальной стоимости единорогов, что близко к 25% от общемирового объема.
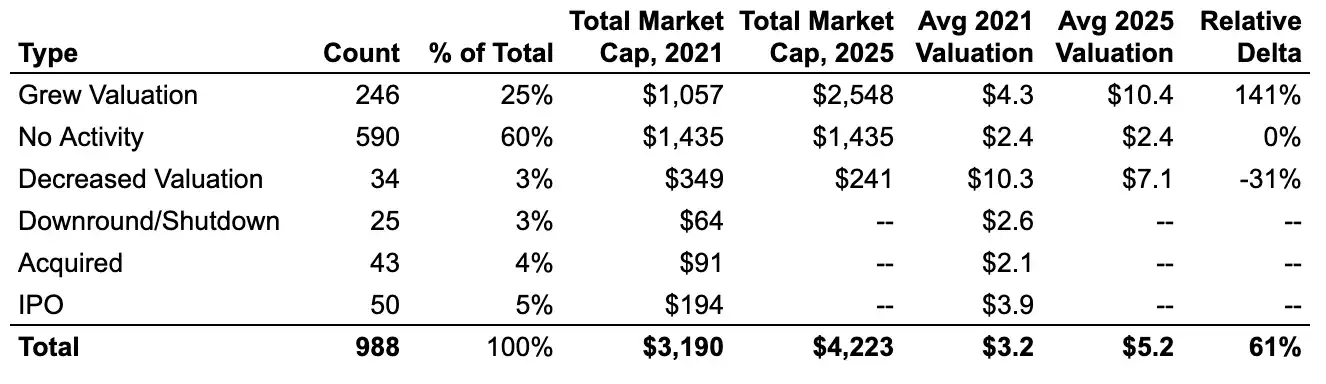
Подпись к графику: Соотношение «зомби» и «активных» единорогов 2021 года
Доля «активных» единорогов в США и районе залива (тех, кто провел новые раунды финансирования с 2021 года) значительно выше, чем «зомби»-единорогов. Для сравнения, в Европе, Индии, Латинской Америке и Нью-Йорке концентрация «зомби»-единорогов выше.
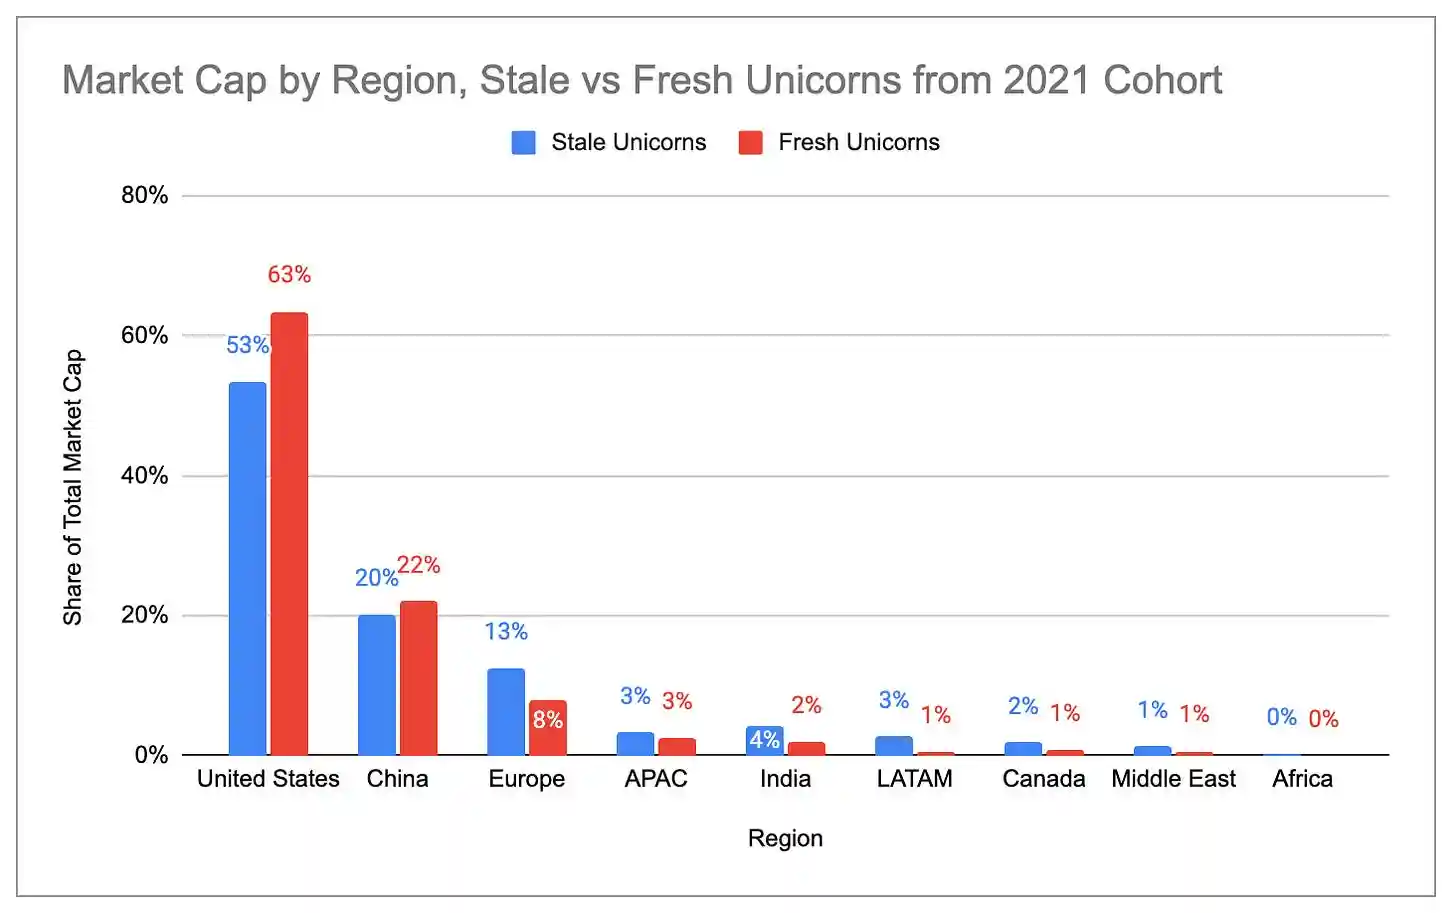
Подпись к графику: Распределение стоимости «зомби» и «активных» единорогов по странам
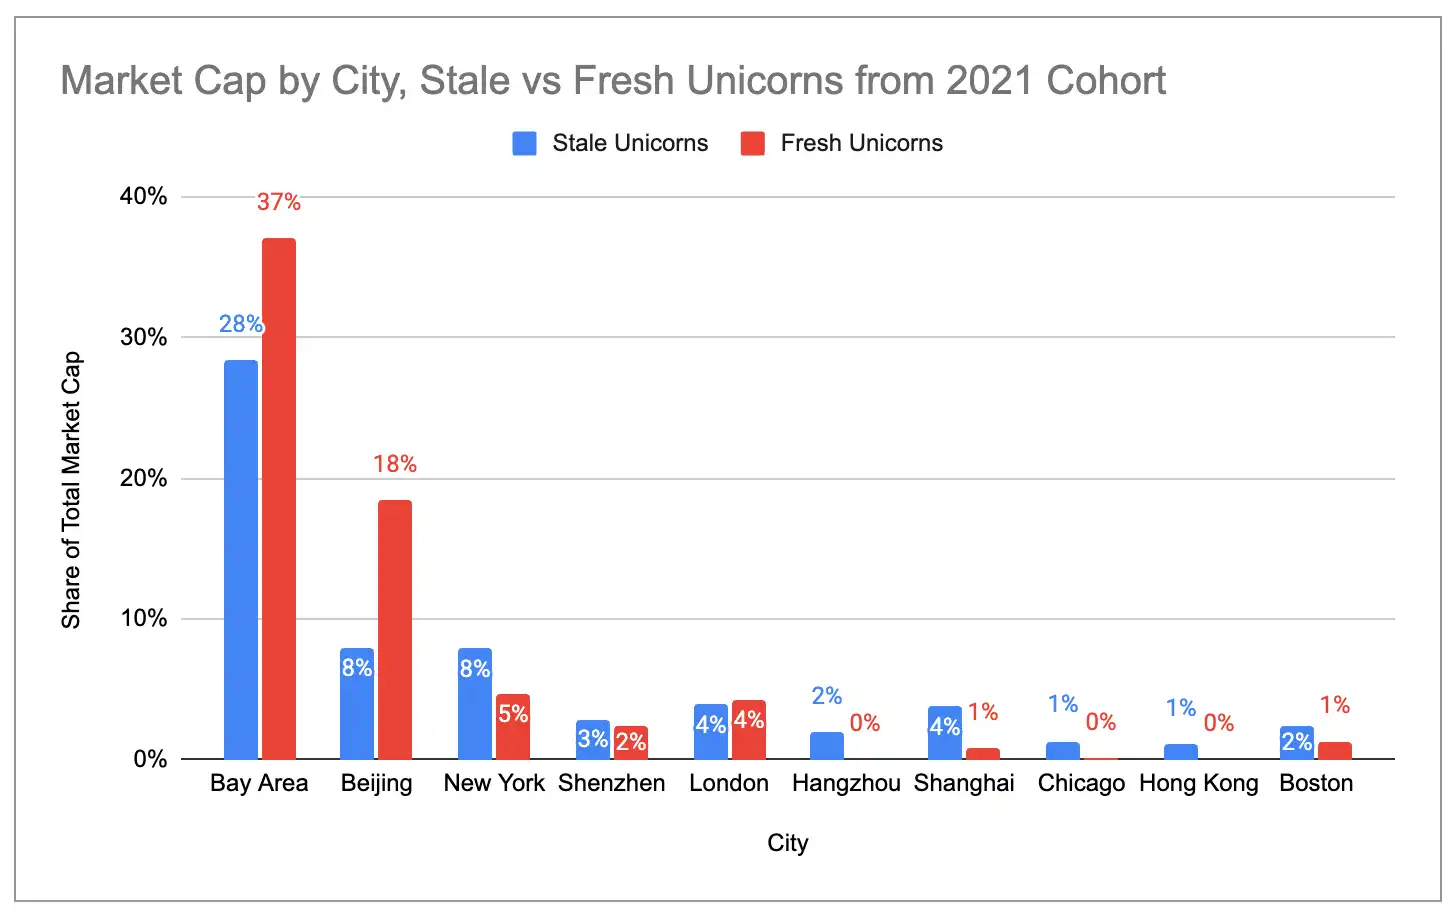
Подпись к графику: Распределение стоимости «зомби» и «активных» единорогов по городам
Четыре основных кластера единорогов в США
Внутри США четыре «отраслевых города» занимают около 76% количества единорогов и около 87% их стоимости: район залива, Нью-Йорк, Лос-Анджелес и Бостон. Среди них район залива является абсолютным лидером: количество единорогов более чем в 2 раза превышает показатель второго города, а стоимость — более чем в 4 раза.
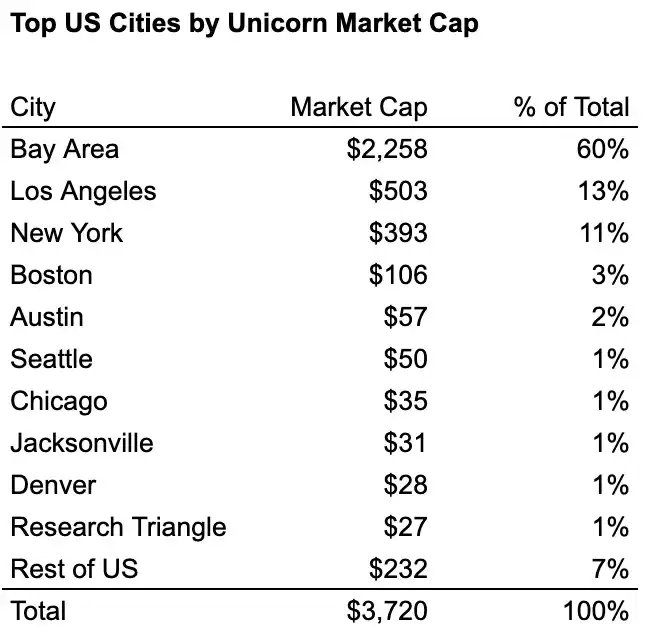
Подпись к графику: Количество единорогов в основных городах США
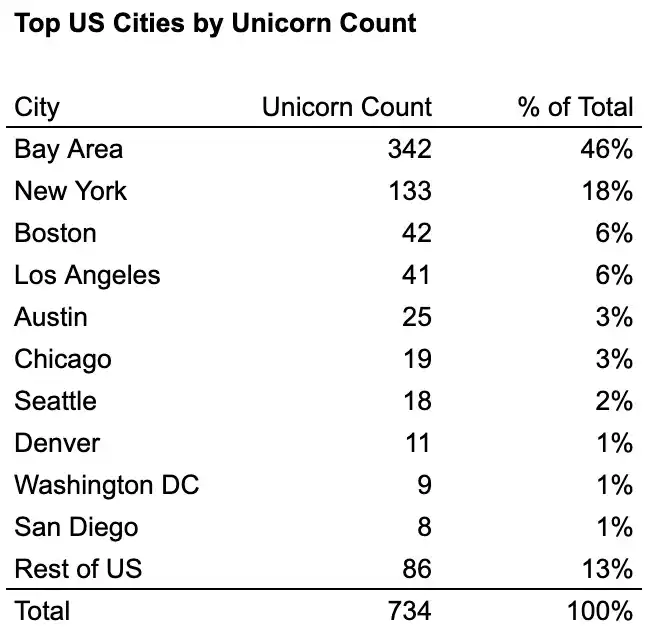
Подпись к графику: Стоимость единорогов в основных городах США
Если посмотреть на отраслевое распределение десятки крупнейших единорогов каждого города, можно четко увидеть эффект кластеризации отраслевых городов:
- Район залива = Кластер ИИ (6 из первой десятки — генеративный ИИ)
- Нью-Йорк = Кластер финтех/криптовалют (7 из первой десятки)
- Лос-Анджелес = Оборонный/космический + потребительский кластер (3 из первой шестерки — оборонные/космические компании, составляющие 83% от общей стоимости Лос-Анджелеса, 4 из первой десятки — потребительские компании)
- Бостон = Относительно сбалансированный, но с уклоном в биотех/медицину (3 из первой десятки)
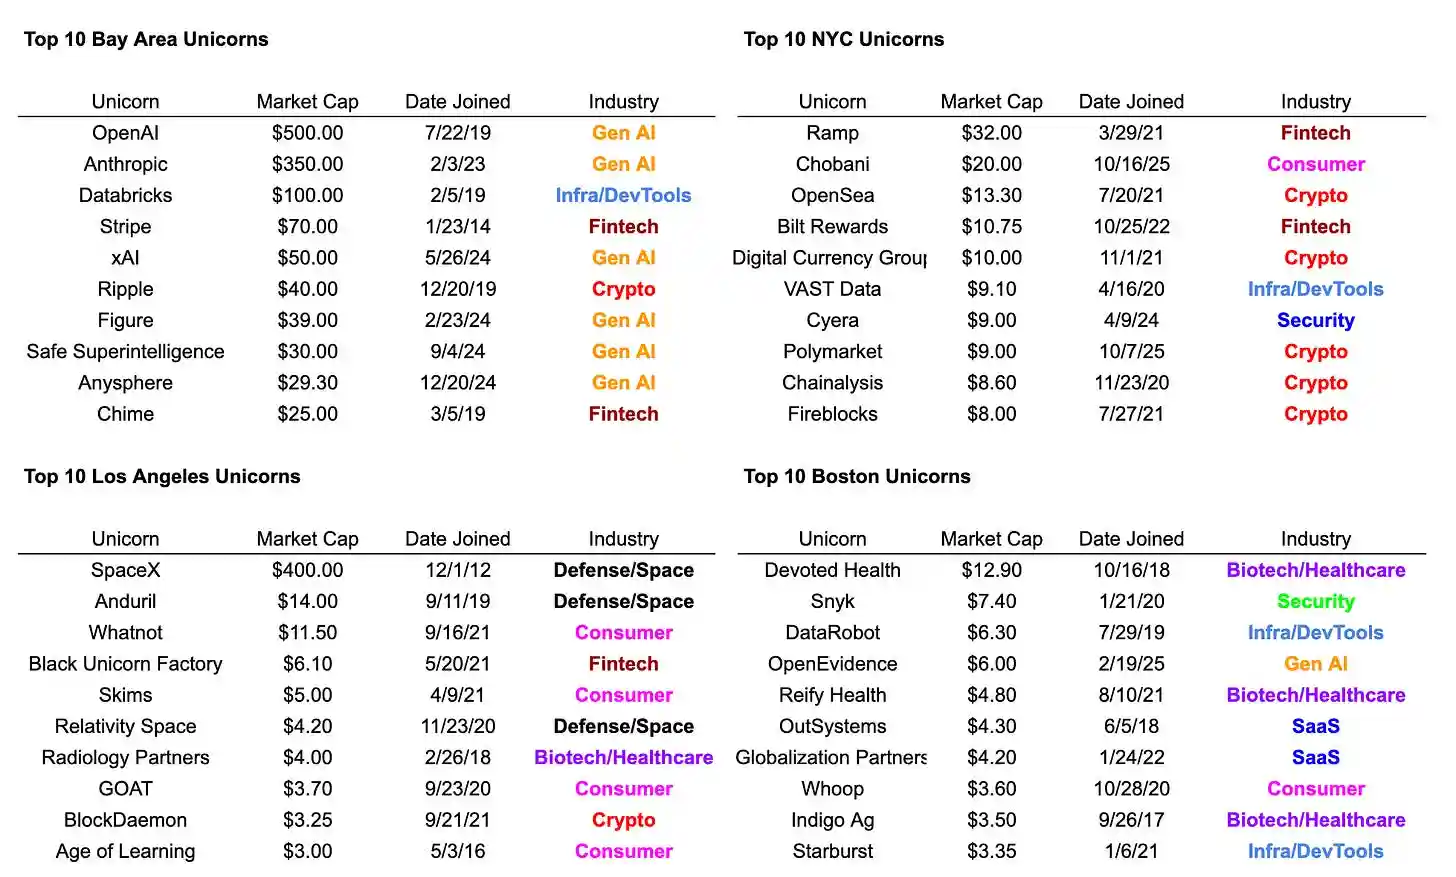
Подпись к графику: Отраслевое распределение Топ-10 единорогов в четырех крупных городах США