На прошлой неделе мы отмечали структурно хрупкий рынок, где растущие нереализованные убытки, повышенная реализация убытков и постоянный фиксация прибыли долгосрочными держателями продолжали ограничивать восходящий прогресс. В то время как спрос со стороны терпеливых покупателей удерживал цену выше Истинной Рыночной Средней, слабые потоки ETF, низкая ликвидность спотового рынка, сдержанные позиции на фьючерсах и оборонительная активность на опционах оставили рынок высокочувствительным к макро-катализаторам.
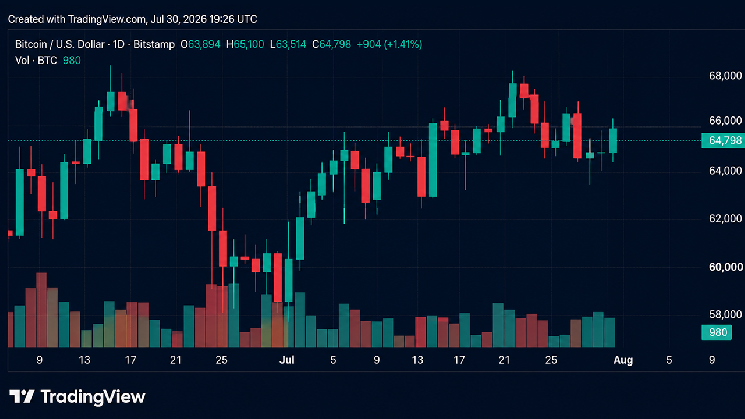
С тех пор цена была отклонена вблизи $92,9 тыс. и снизилась до $85,6 тыс., что соответствует временному давлению продаж, описанному в нашем предыдущем отчете. В этом выпуске мы исследуем, как разочарование инвесторов трансформируется в реализацию убытков, оцениваем настроения на спотовом и фьючерсном рынках и завершаем нашим еженедельным анализом опционов.
On-Chain инсайты
Тяжелое бремя сверху
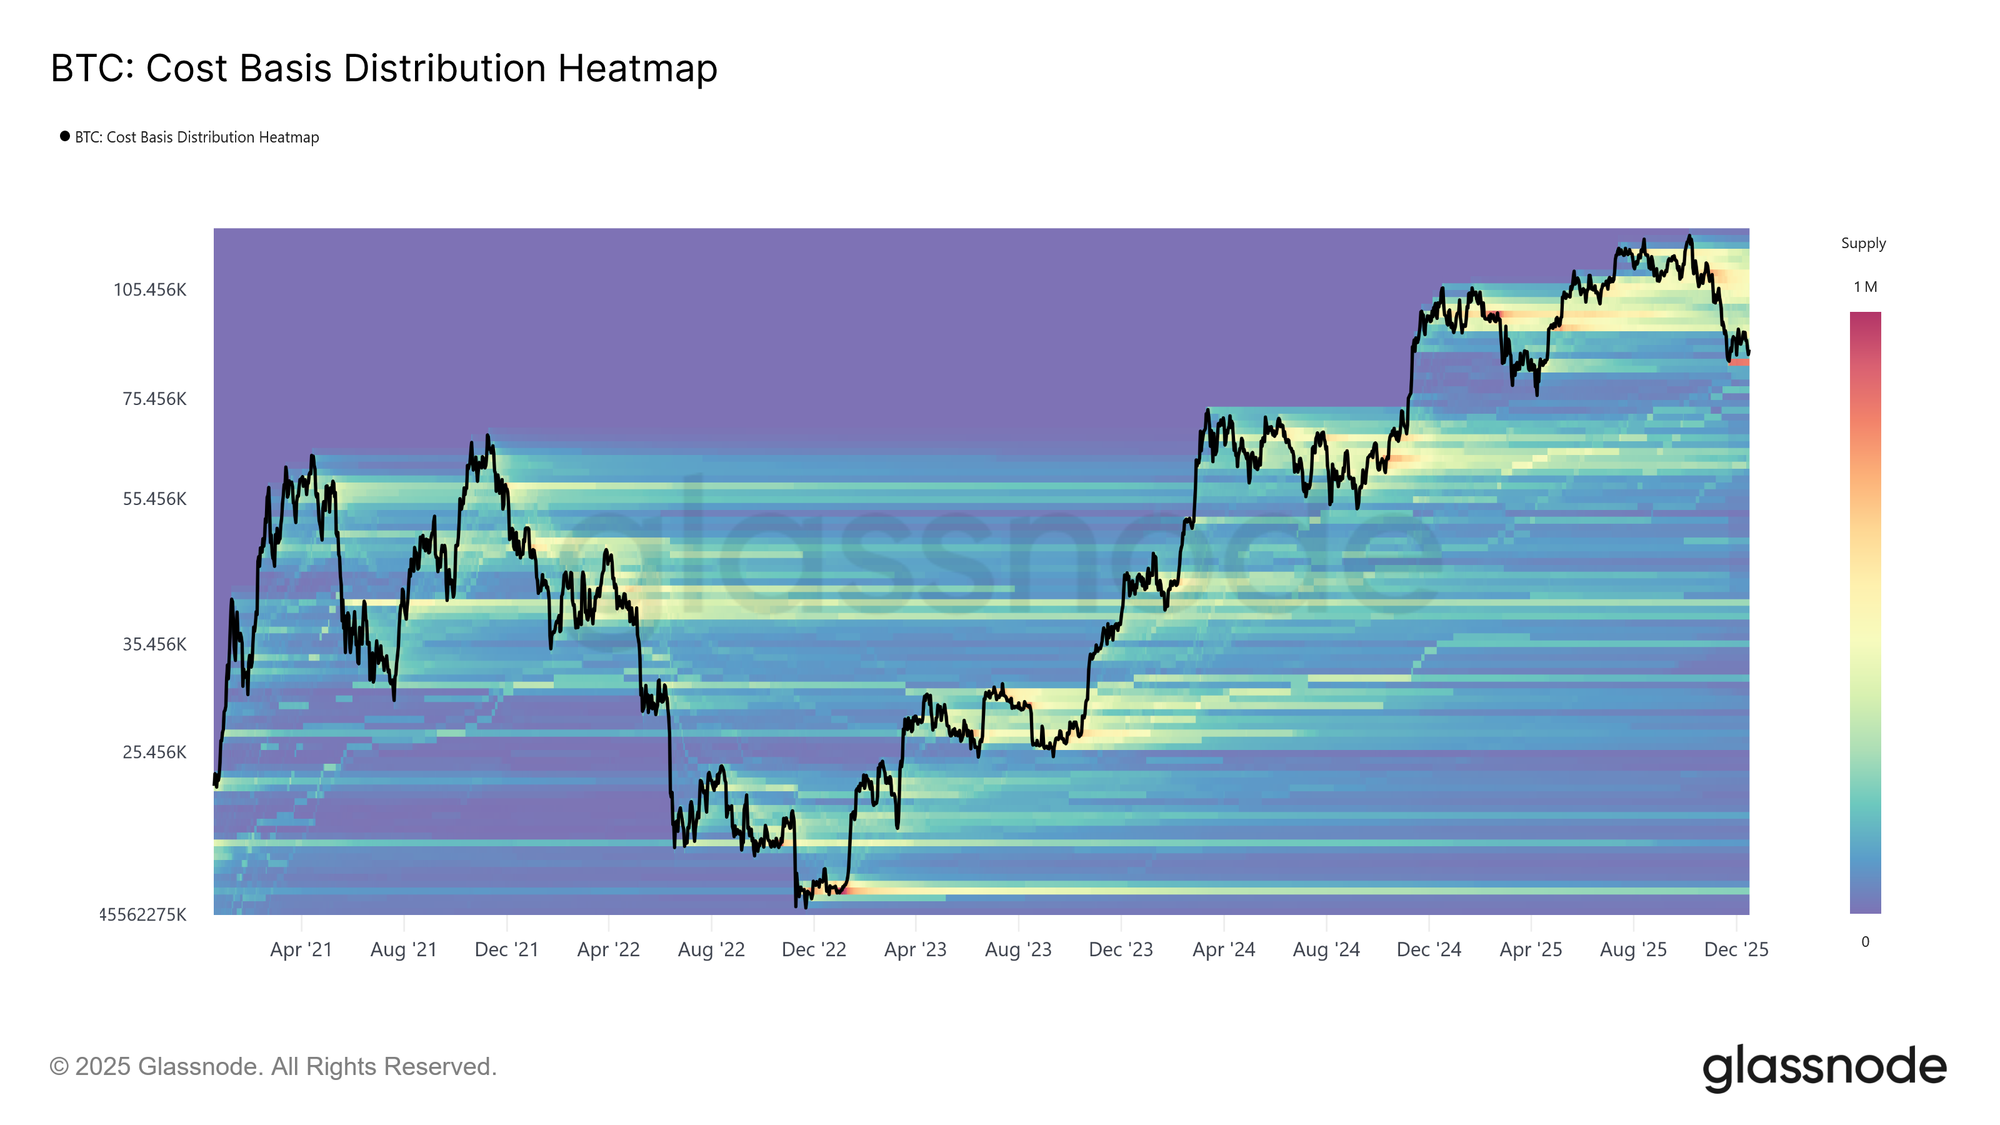
Цена вернулась к уровням, в последний раз наблюдавшимся почти год назад, несмотря на два значительных ралли за этот период. Это оставило после себя плотный кластер предложения, накопленный крупными покупателями в диапазоне $93–120 тыс. Результирующее распределение предложения отражает верхне-тяжелую структуру рынка, где, подобно началу 2022 года, попытки восстановления все чаще ограничиваются давлением продаж сверху, особенно на ранних стадиях медвежьей фазы.
До тех пор пока цена остается ниже этого диапазона и не может вернуть ключевые пороги, в частности, себестоимость краткосрочных держателей на уровне $101,5 тыс., риск дальнейшей коррекционной просадки продолжает висеть над рынком.
Взвешивание бремени
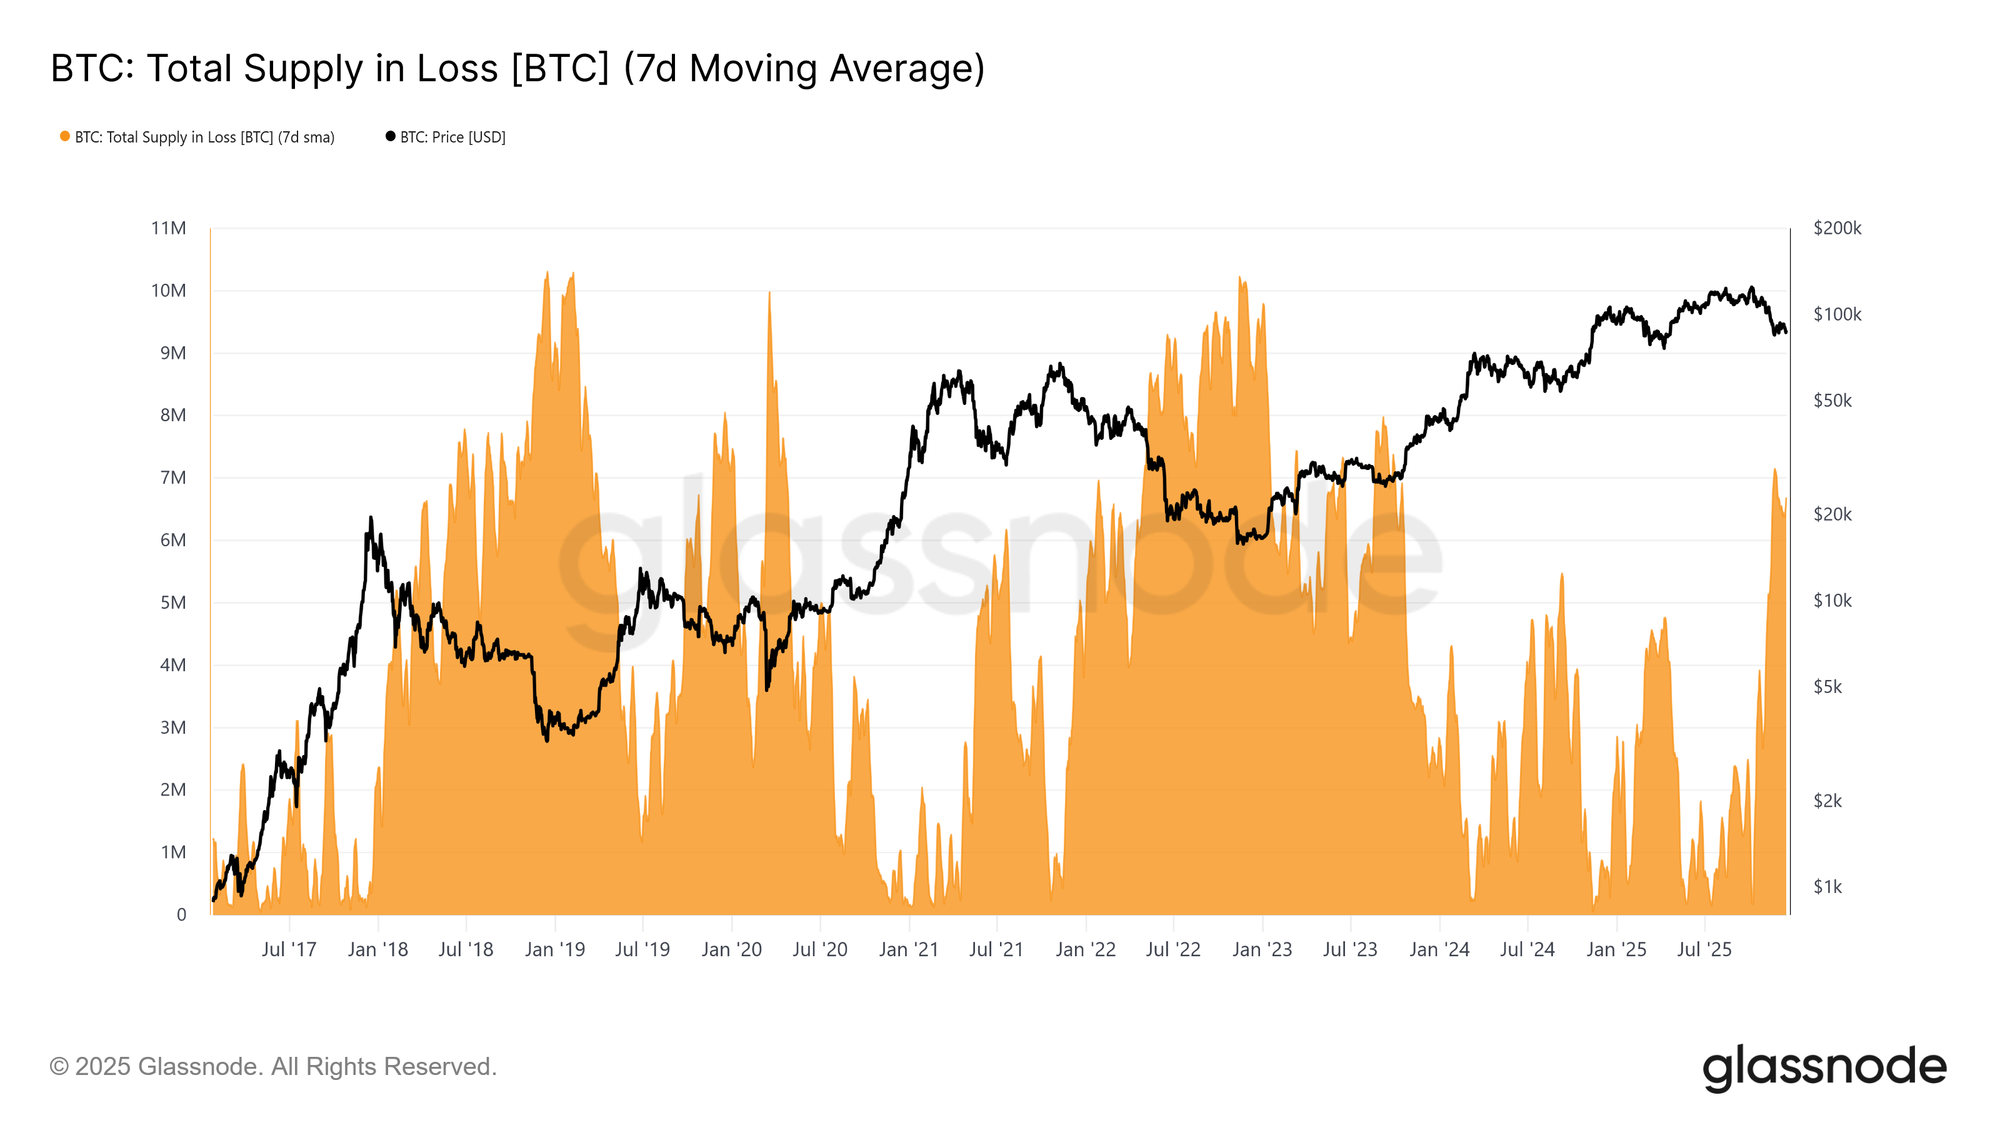
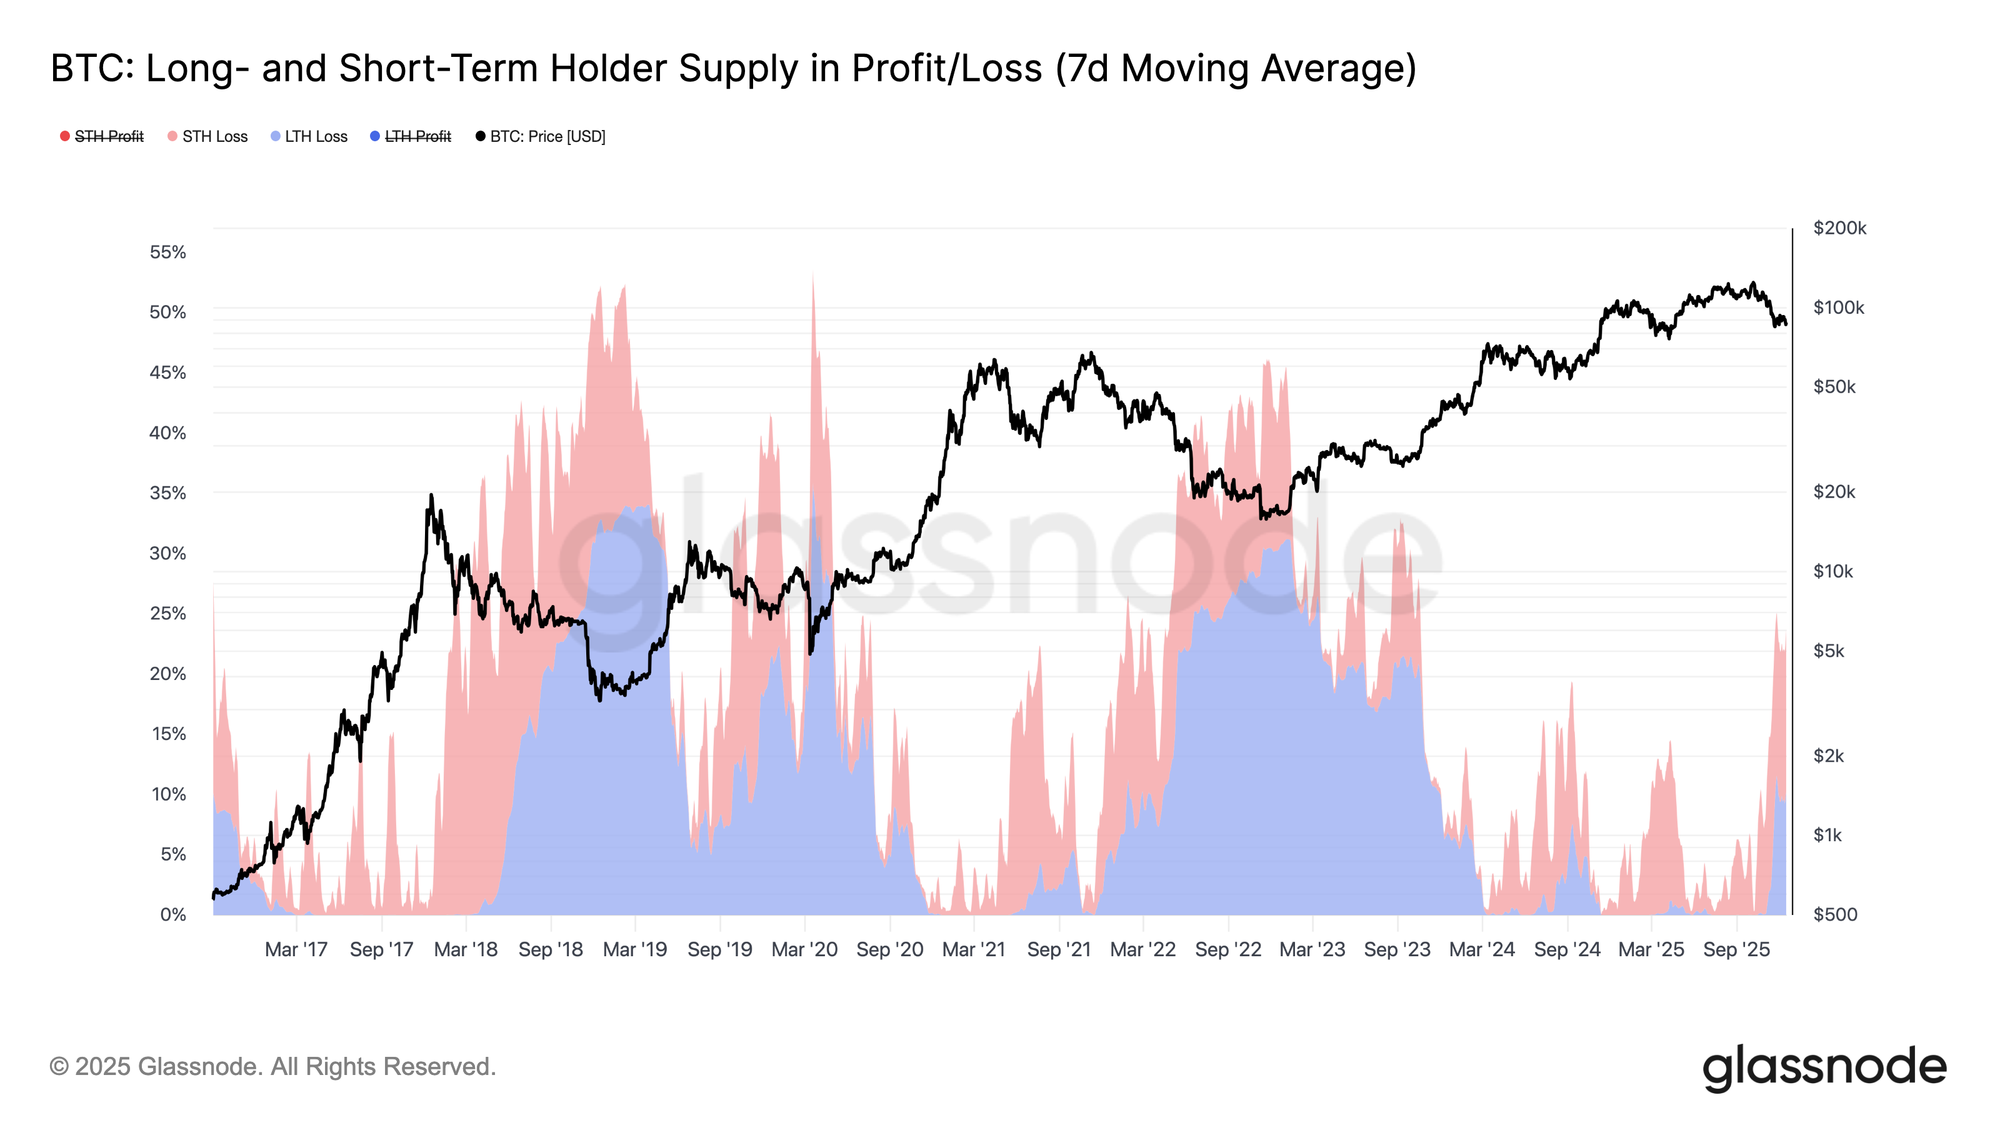
Чтобы лучше контекстуализировать вес этого предложения сверху, мы можем сначала оценить объем монет, в настоящее время удерживаемых в убытке. Предложение в убытке выросло до 6,7 млн BTC (7D-SMA), что является самым высоким уровнем убыточного предложения, наблюдавшимся в этом цикле.
Находясь в диапазоне 6–7 млн BTC с середины ноября, эта модель тесно mirrors ранние переходные фазы предыдущих циклов, где нарастающее разочарование инвесторов предшествовало переходу к более выраженным медвежьим условиям и усиленной капитуляции при более низких ценах.
Созревание убытков
Основываясь на повышенной доле предложения, удерживаемого в убытке, время теперь emerges как доминирующий источник рыночного давления. Как показано на графике ниже, из 23,7% циркулирующего предложения, находящегося сейчас «под водой», 10,2% удерживается долгосрочными держателями и 13,5% – краткосрочными держателями. Это распределение suggests, что, подобно переходу предыдущих циклов в более глубокие медвежьи режимы, убыточное предложение, накопленное недавними покупателями, постепенно созревает в когорту долгосрочных держателей.
Поскольку это «подводное» предложение подвергается prolonged временному стресс-тесту, инвесторы со слабой уверенностью могут все чаще капитулировать с убытком, добавляя дополнительное давление со стороны продавцов на рынок.
Появление продавцов в убыток
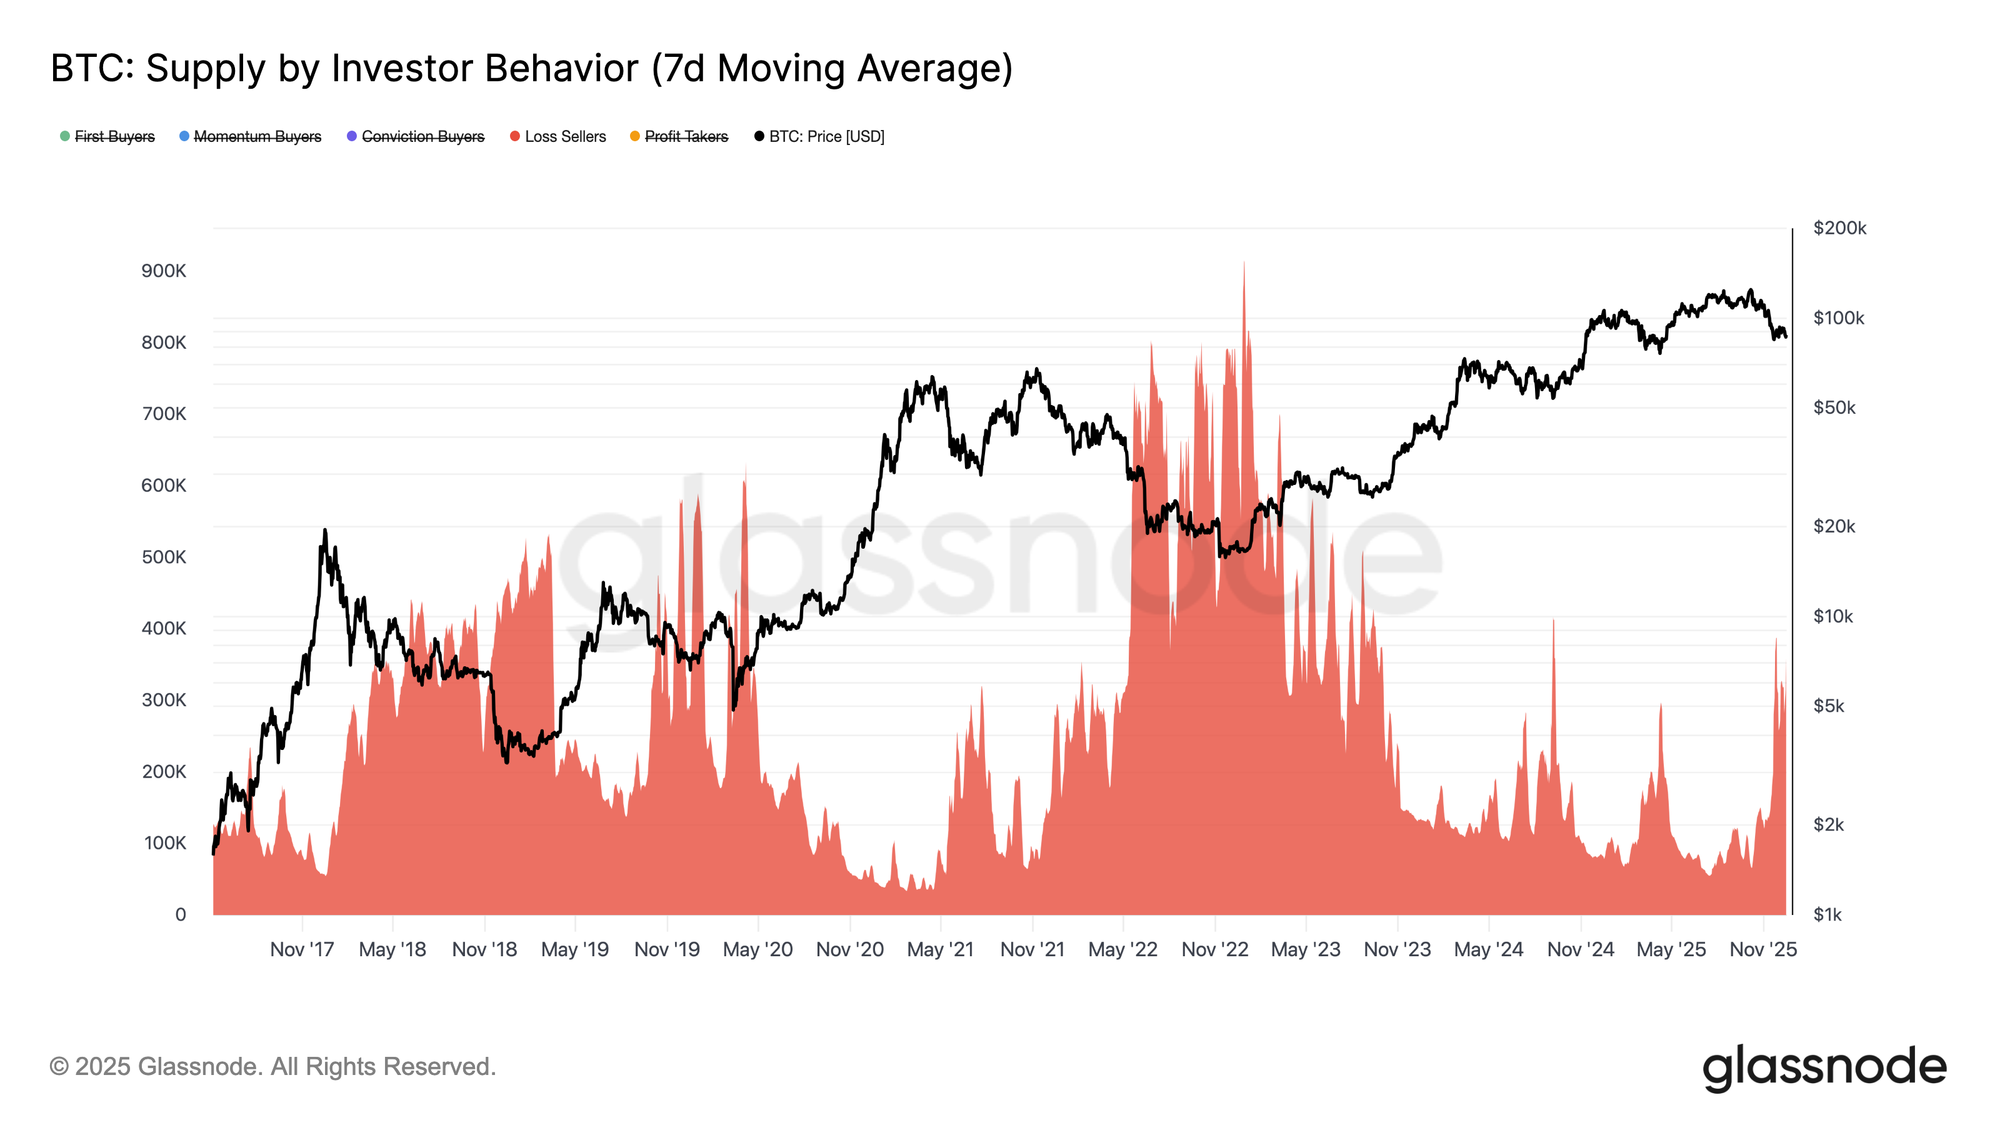
Продлевая это временное давление, созревание убыточного предложения от краткосрочных держателей в более долгосрочные когорты теперь выражается через растущую реализацию убытков по рынку. Чтобы лучше отследить, как медвежьи условия формируют поведение инвесторов, мы обращаемся к индикатору Supply by Investor Behavior. Эта framework классифицирует предложение токенов не просто по возрасту, а по тому, как участники взаимодействуют с ценой, revealing, кто покупает, кто продает и при каких условиях.
Для этого предложение сегментируется на когорты, основанные на поведении: убежденные покупатели, которые накапливают на слабости; покупатели по импульсу, которые входят во время восходящих трендов; покупатели впервые; фиксаторы прибыли; и продавцы в убыток, которые выходят с потерей. Метрика отслеживает кумулятивное предложение, удерживаемое каждой когортой с течением времени, исключая биржи и смарт-контракты, чтобы изолировать поведение инвесторов.
В настоящее время предложение, относимое к Продавцам в убыток, выросло примерно до 360 тыс. BTC. В результате, любое дальнейшее снижение, особенно пробой ниже Истинной Рыночной Средней на уровне $81,3 тыс., рискует further расширить эту когорту, добавив инкрементное давление со стороны продавцов к уже хрупкой структуре рынка.
Off-Chain инсайты
Спотовому спросу не хватает устойчивости
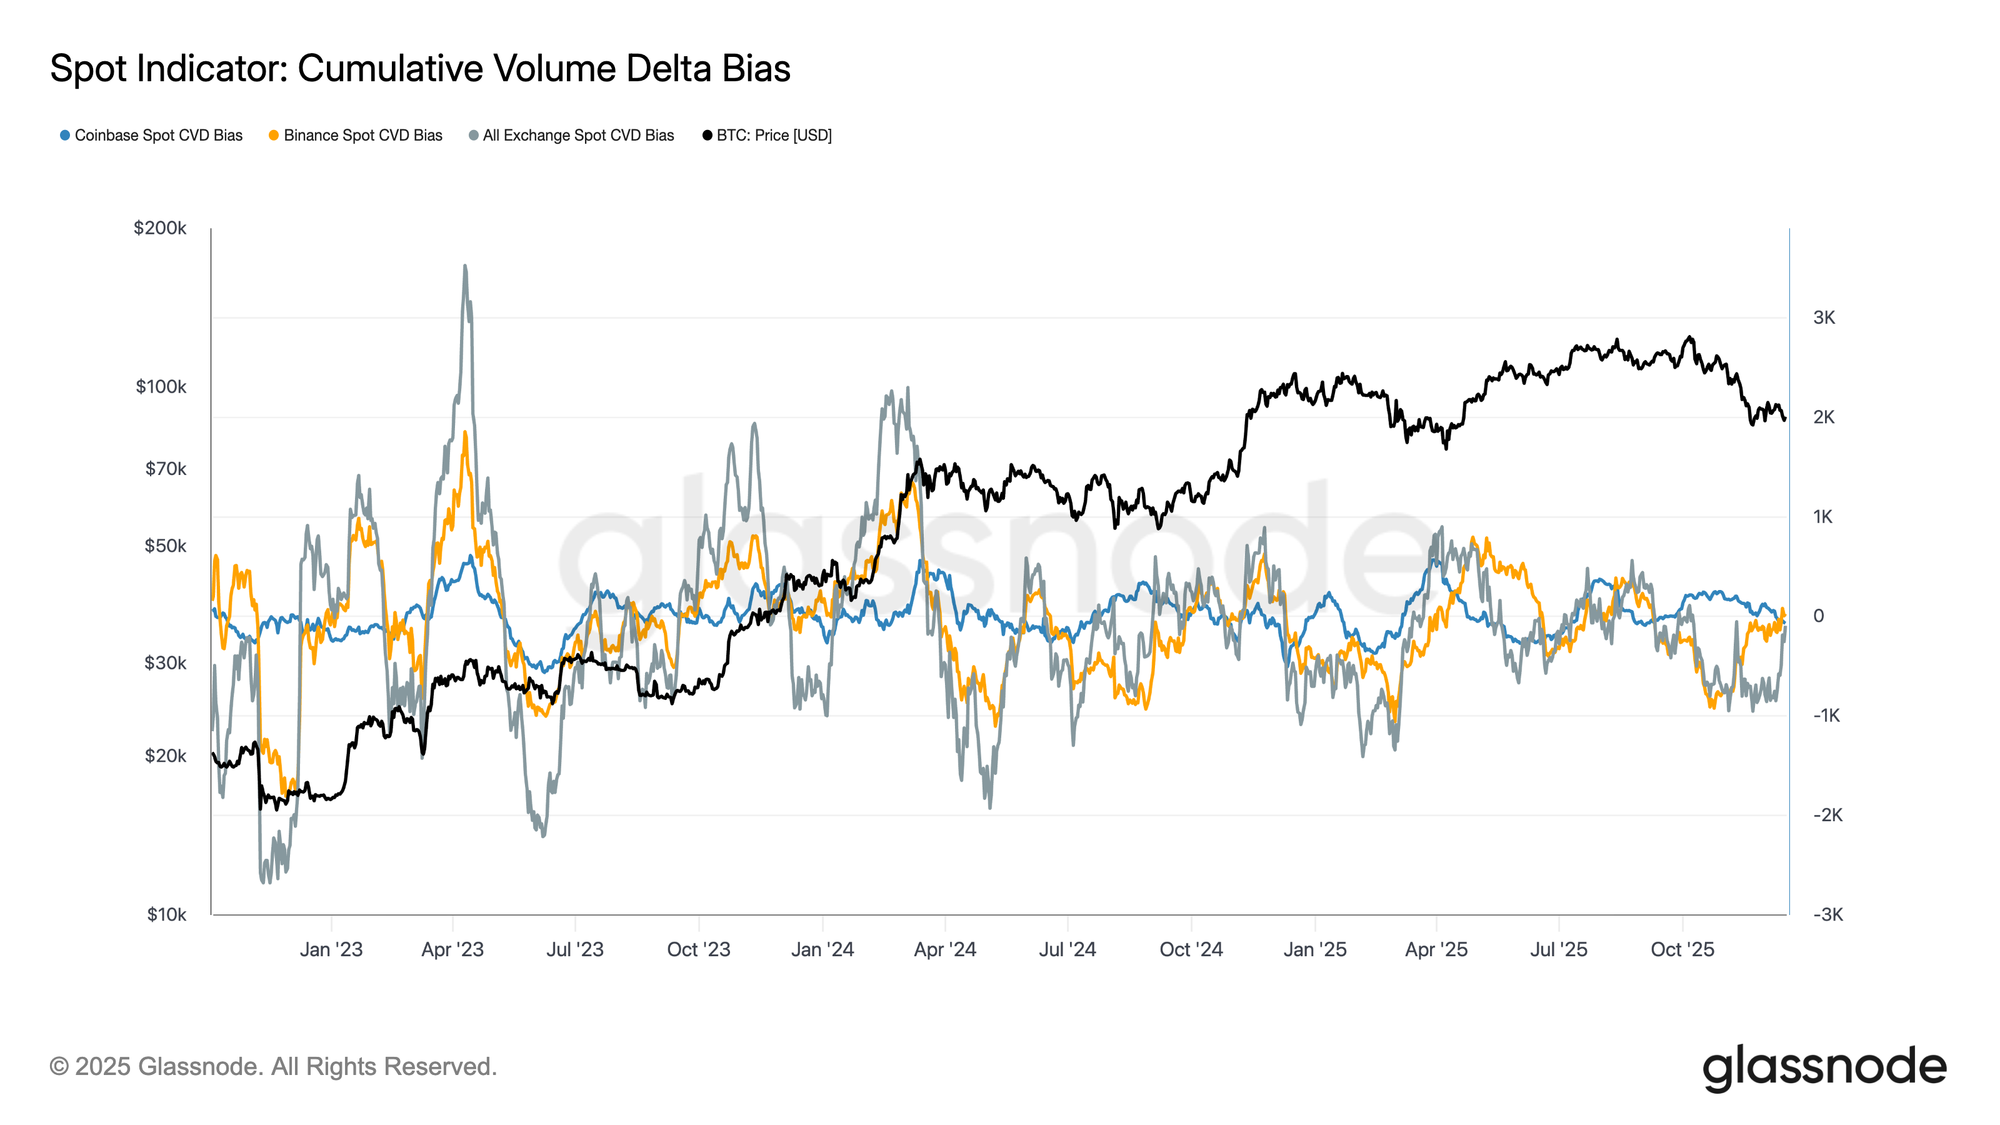
Потоки на спотовом рынке продолжают отражать неравномерный профиль спроса на основных площадках. Cumulative Volume Delta bias показывает периодические всплески активности на стороне покупок, но эти движения не смогли перерасти в устойчивое накопление, особенно во время недавних откатов цены. Спотовый CVD на Coinbase остается относительно конструктивным, указывая на более стабильное участие инвесторов из США, в то время как потоки на Binance и агрегированные биржевые потоки остаются волатильными и в значительной степени бесцельными.
Эта дисперсия указывает на избирательное вовлечение, а не на скоординированный спотовый спрос. Недавние снижения не спровоцировали решительного расширения позитивного CVD, suggesting, что покупки на снижении остаются тактическими и краткосрочными по своей природе. В отсутствие устойчивого спотового накопления across площадок, ценовое действие continues to rely более heavily на позиционировании деривативов и условиях ликвидности, а не на органическом спросe, led спотом.
Потоки корпоративных казначейств остаются эпизодическими
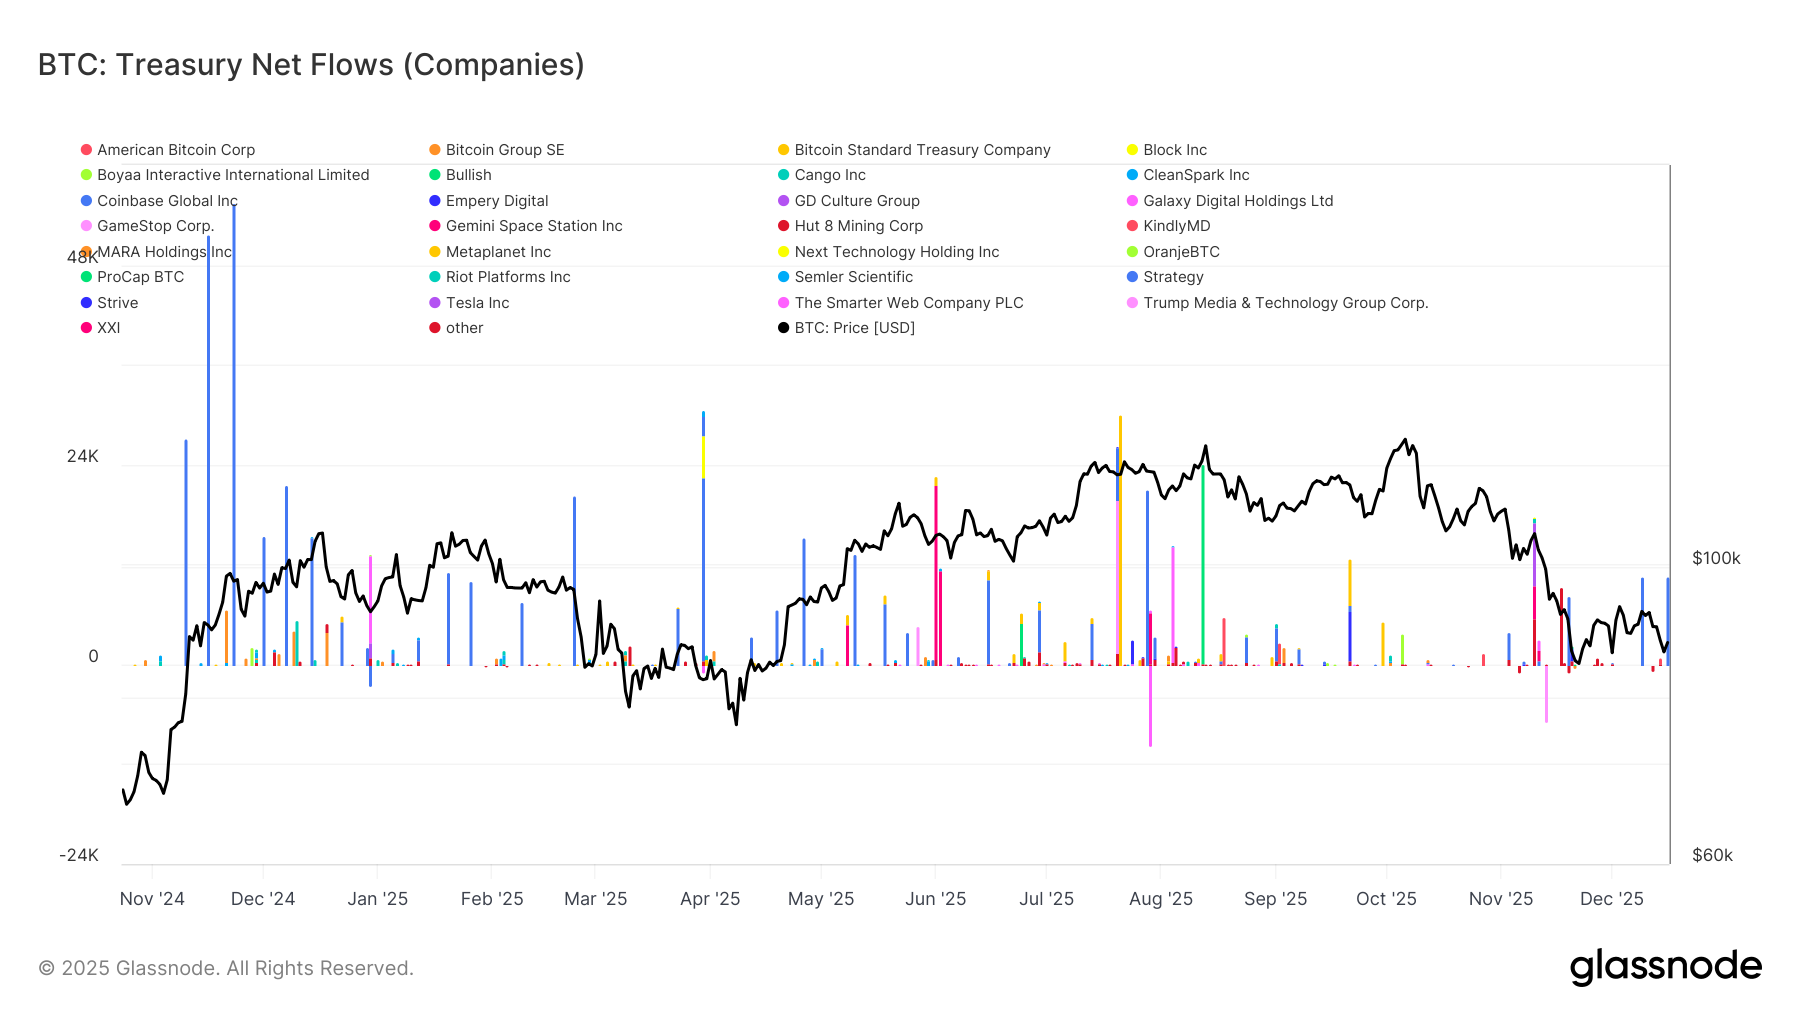
Активность корпоративных казначейств Bitcoin продолжает доминироваться дискретными, специфичными для компаний событиями, а не устойчивым трендом накопления. Чистые потоки показывают спорадические крупные притоки от небольшого набора фирм, перемежающиеся длительными периодами минимальной активности, indicating, что корпоративный спрос остается оппортунистическим, а не систематическим. Эти всплески часто совпадают с благоприятными ценовыми условиями или стратегическими решениями по балансу, но они не сформировали consistent стаби, способный формировать более широкую структуру рынка.
Важно, что недавняя слабость цены не спровоцировала скоординированного увеличения накопления казначействами, suggesting, что большинство корпораций остаются дисциплинированными и чувствительными к цене. Как результат, корпоративные казначейства вносят вклад в волатильность потоков на уровне заголовков, но еще не действуют как надежный, цикло-широкий источник структурного спроса.
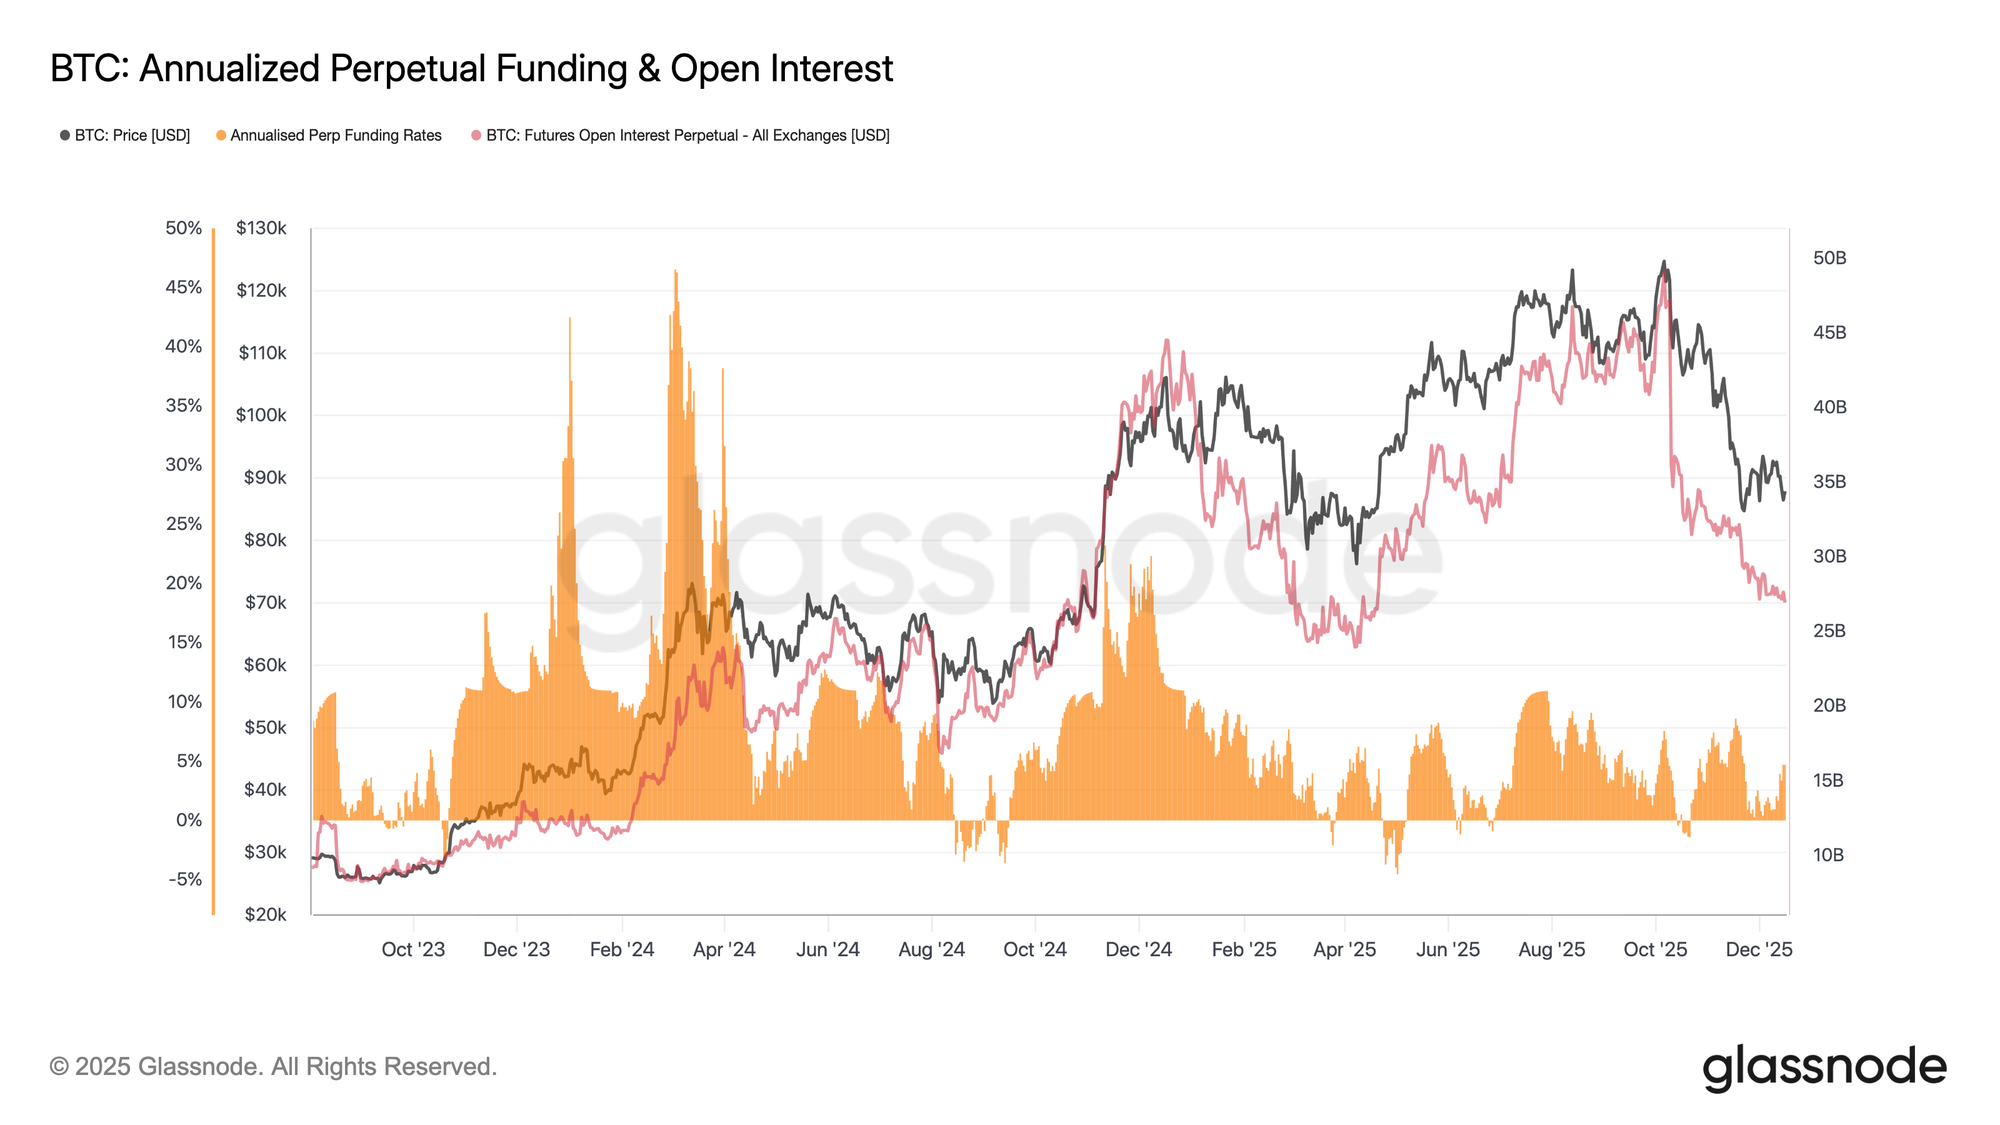
Позиционирование на фьючерсах продолжает снижать риски
Наряду с subdued спотовой активностью, рынки perpetual фьючерсов остаются characterized by muted аппетитом к риску. Открытый интерес continued to trend ниже от максимумов цикла, сигнализируя о ongoing сокращении позиций, а не о размещении нового плеча. Этот unwind произошел на фоне относительно сдержанных ставок финансирования, которые oscillated вокруг нейтральных уровней в течение большей части недавнего снижения.
Важно, что отсутствие persistently повышенного финансирования suggests, что снижение не было driven by чрезмерным длинным позиционированием или перегруженным плечом. Вместо этого рынки фьючерсов, по-видимому, находятся в фазе консолидации, где трейдеры prioritize управление балансом over направленной уверенностью.
С уже reduced плечом и сдержанным финансированием, позиционирование на фьючерсах больше не является primary источником давления вниз. Однако, отсутствие renewed роста открытого интереса также highlights limited спекулятивного аппетита для поддержки sustained восходящего движения в настоящее время.
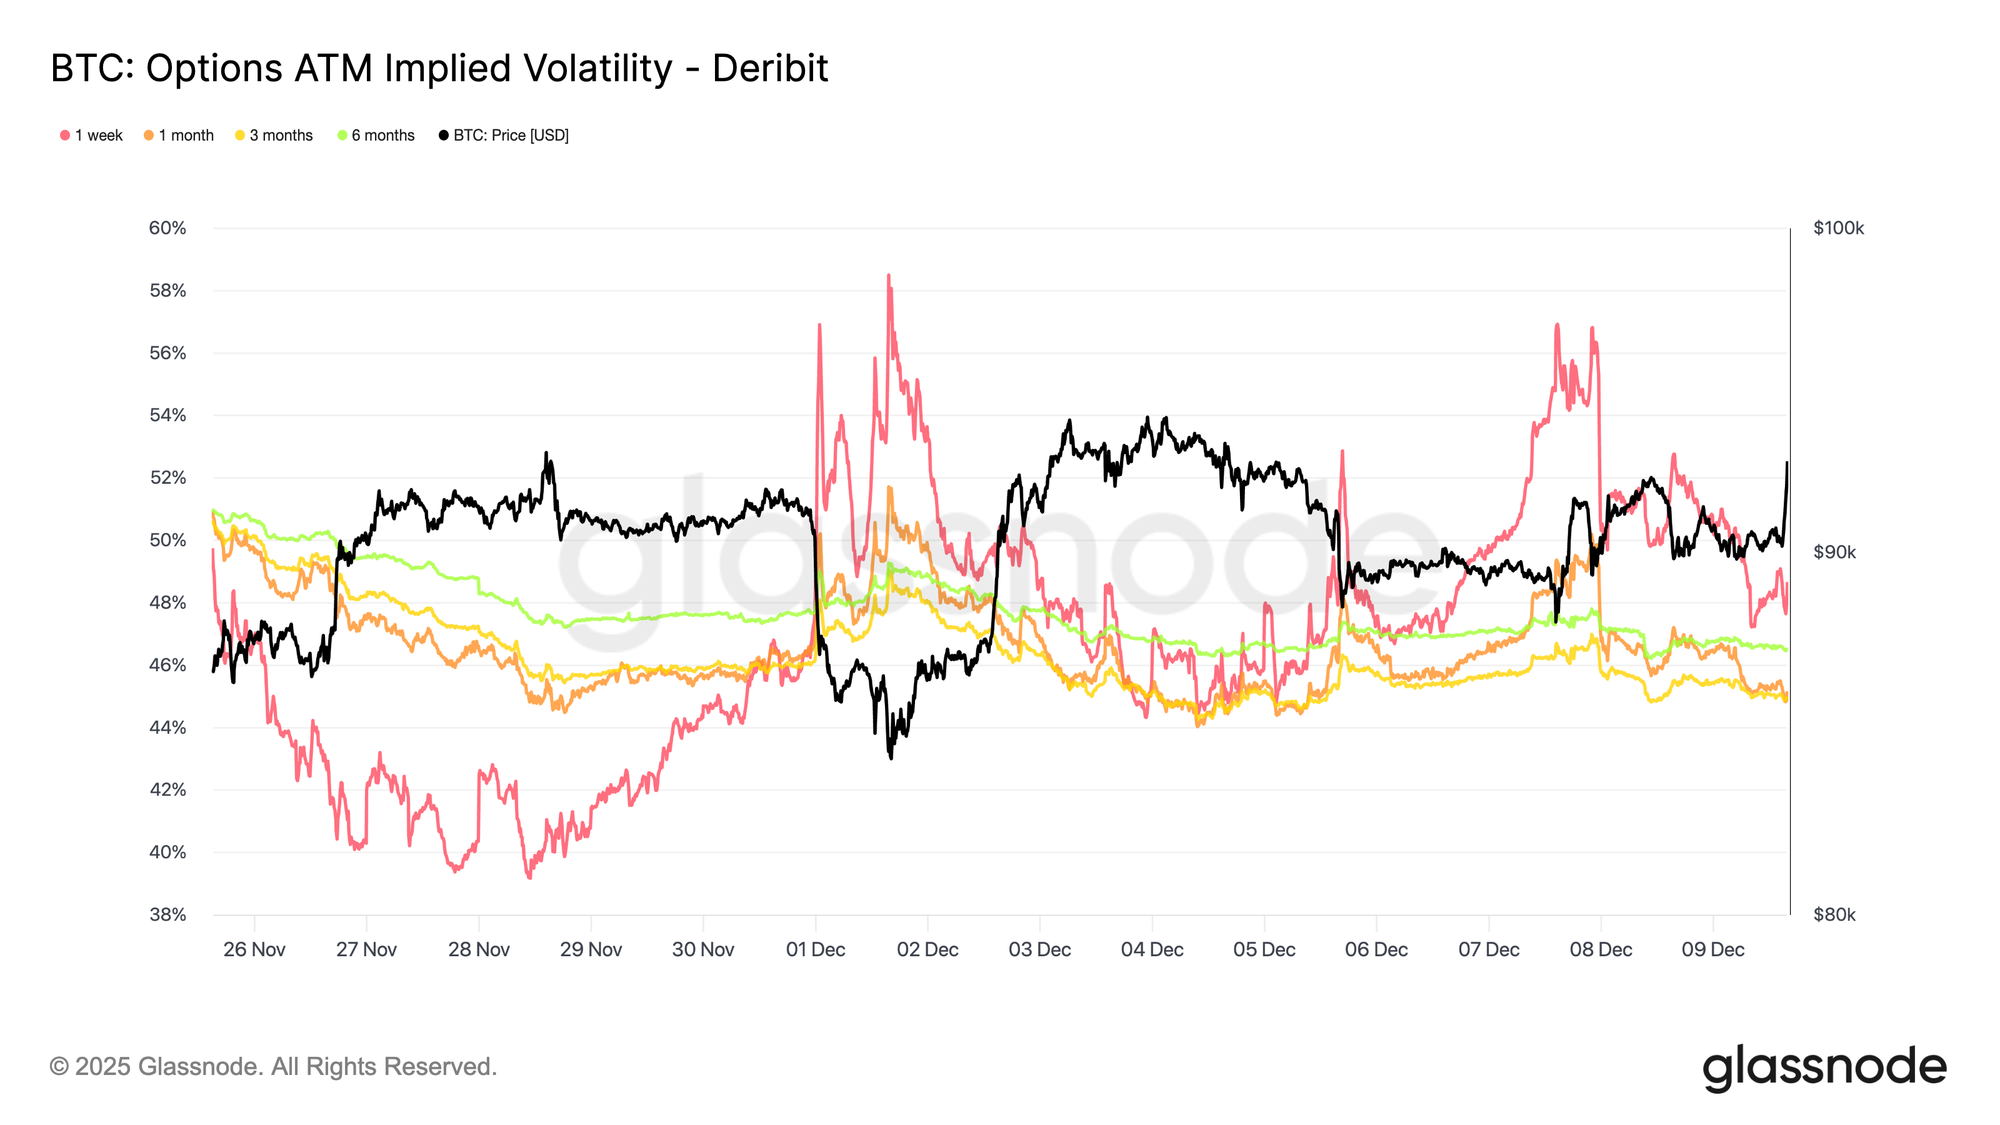
Волатильность на коротком конце спадает
После де-рискирования деривативов, подразумеваемая волатильность continued to сжиматься на коротком конце после FOMC, в то время как более долгосрочные сроки оставались comparatively стабильными despite modest снижение. Эта конфигурация suggests, что трейдеры actively сокращают exposure к краткосрочной неопределенности, а не пересматривают broader режим волатильности. Краткосрочная подразумеваемая волатильность наиболее чувствительна к event риску, и когда она падает, это typically reflects deliberate решение отступить от immediate катализаторов.
Текущее затишье, therefore, не является случайным. Волатильность продается на рынок, указывая на эффекты позиционирования, а не на отстраненность или lack ликвидности.
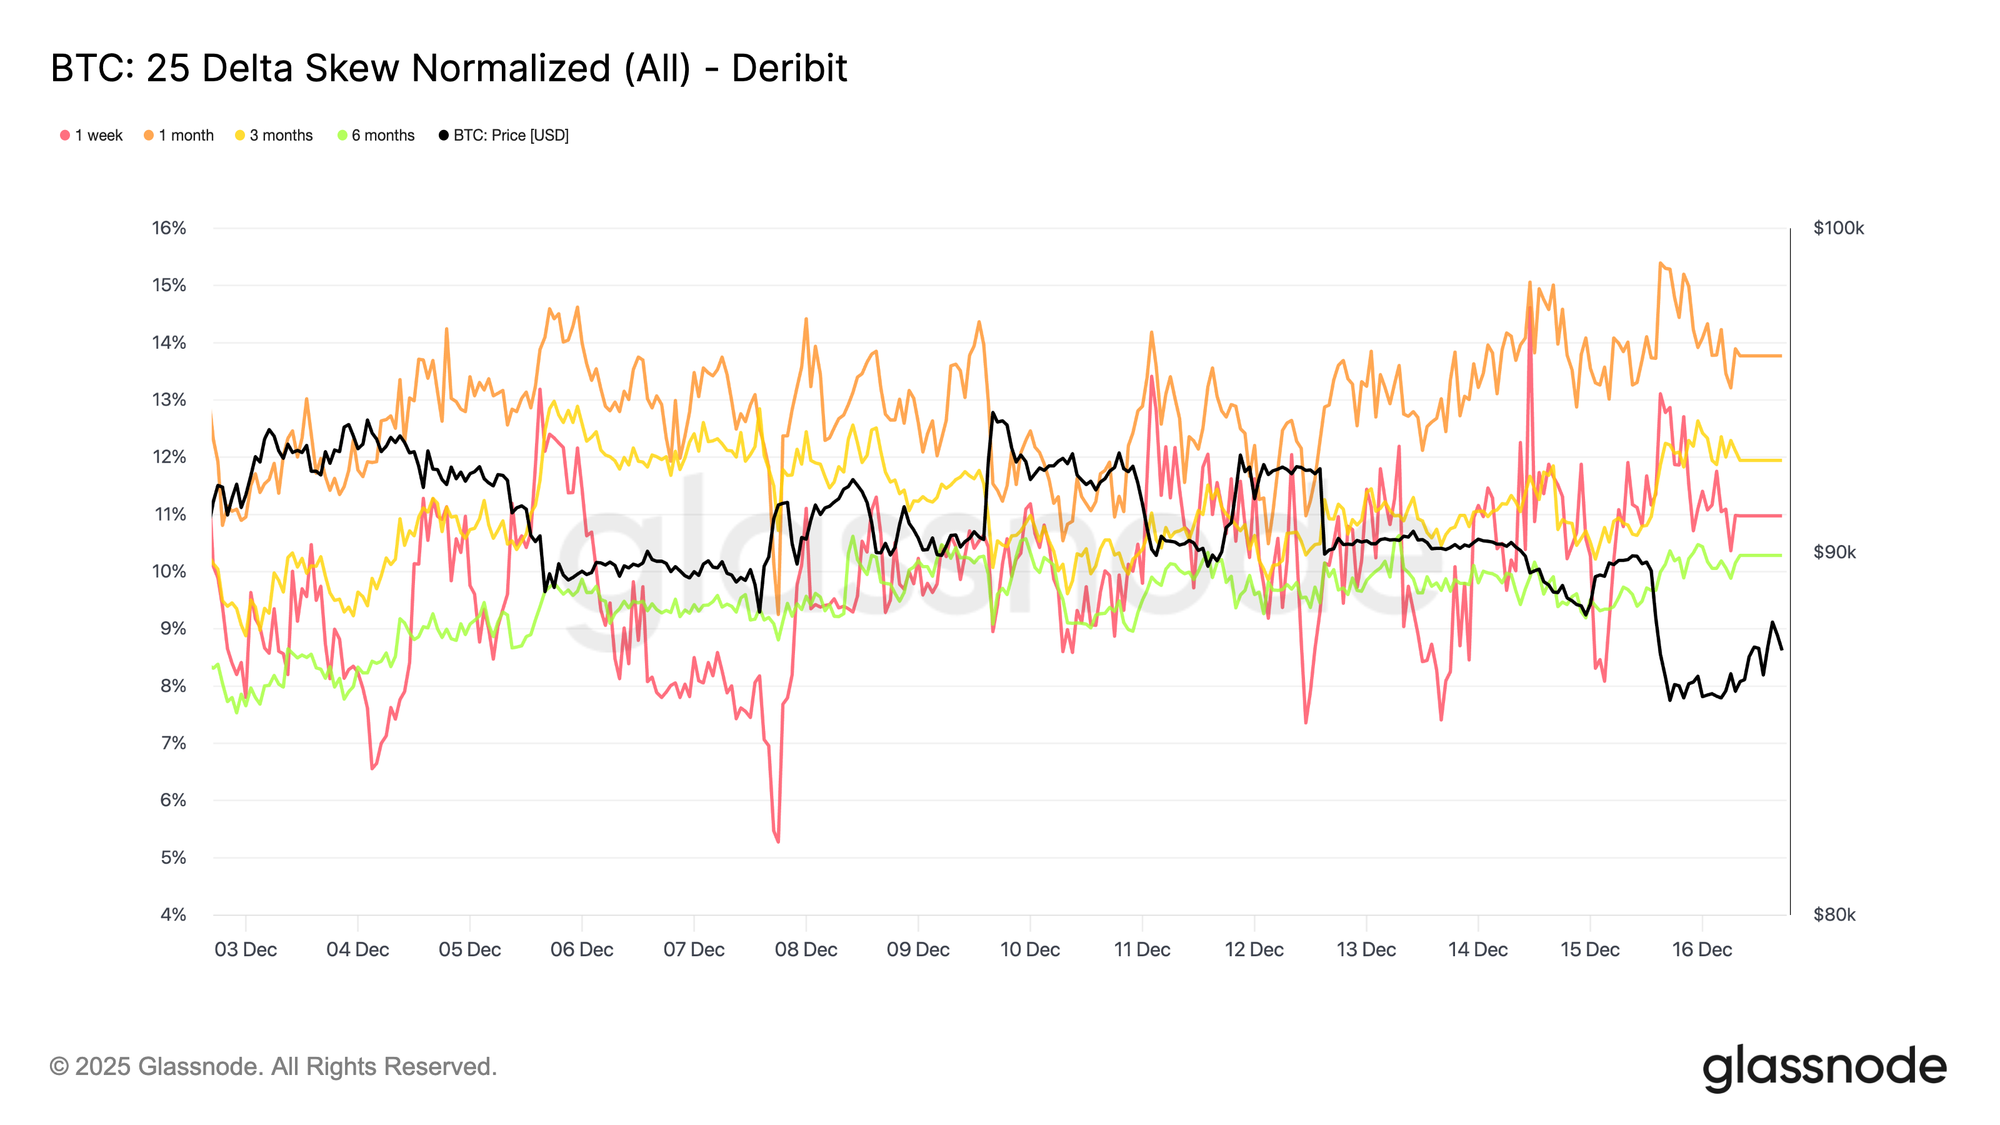
Риск снижения сохраняется
В соответствии с более мягкой краткосрочной волатильностью, 25-дельта скос оставался broadly стабильным across сроков, удерживаясь на территории путов, даже несмотря на то, что подразумеваемая волатильность сжалась на коротком конце. Это indicates, что downside путы continue to торговать с премией к коллам, но эта премия не расширяется. По сути, трейдеры maintain защиту от снижения, а не увеличивают ее.
На фоне падающей краткосрочной подразумеваемой волатильности, эта стабильность suggests, что озабоченность по поводу резких движений вниз ослабла, но не исчезла полностью. Рынок отступает от оборонительной эскалации, останавливаясь перед ротацией в outright бычье позиционирование.
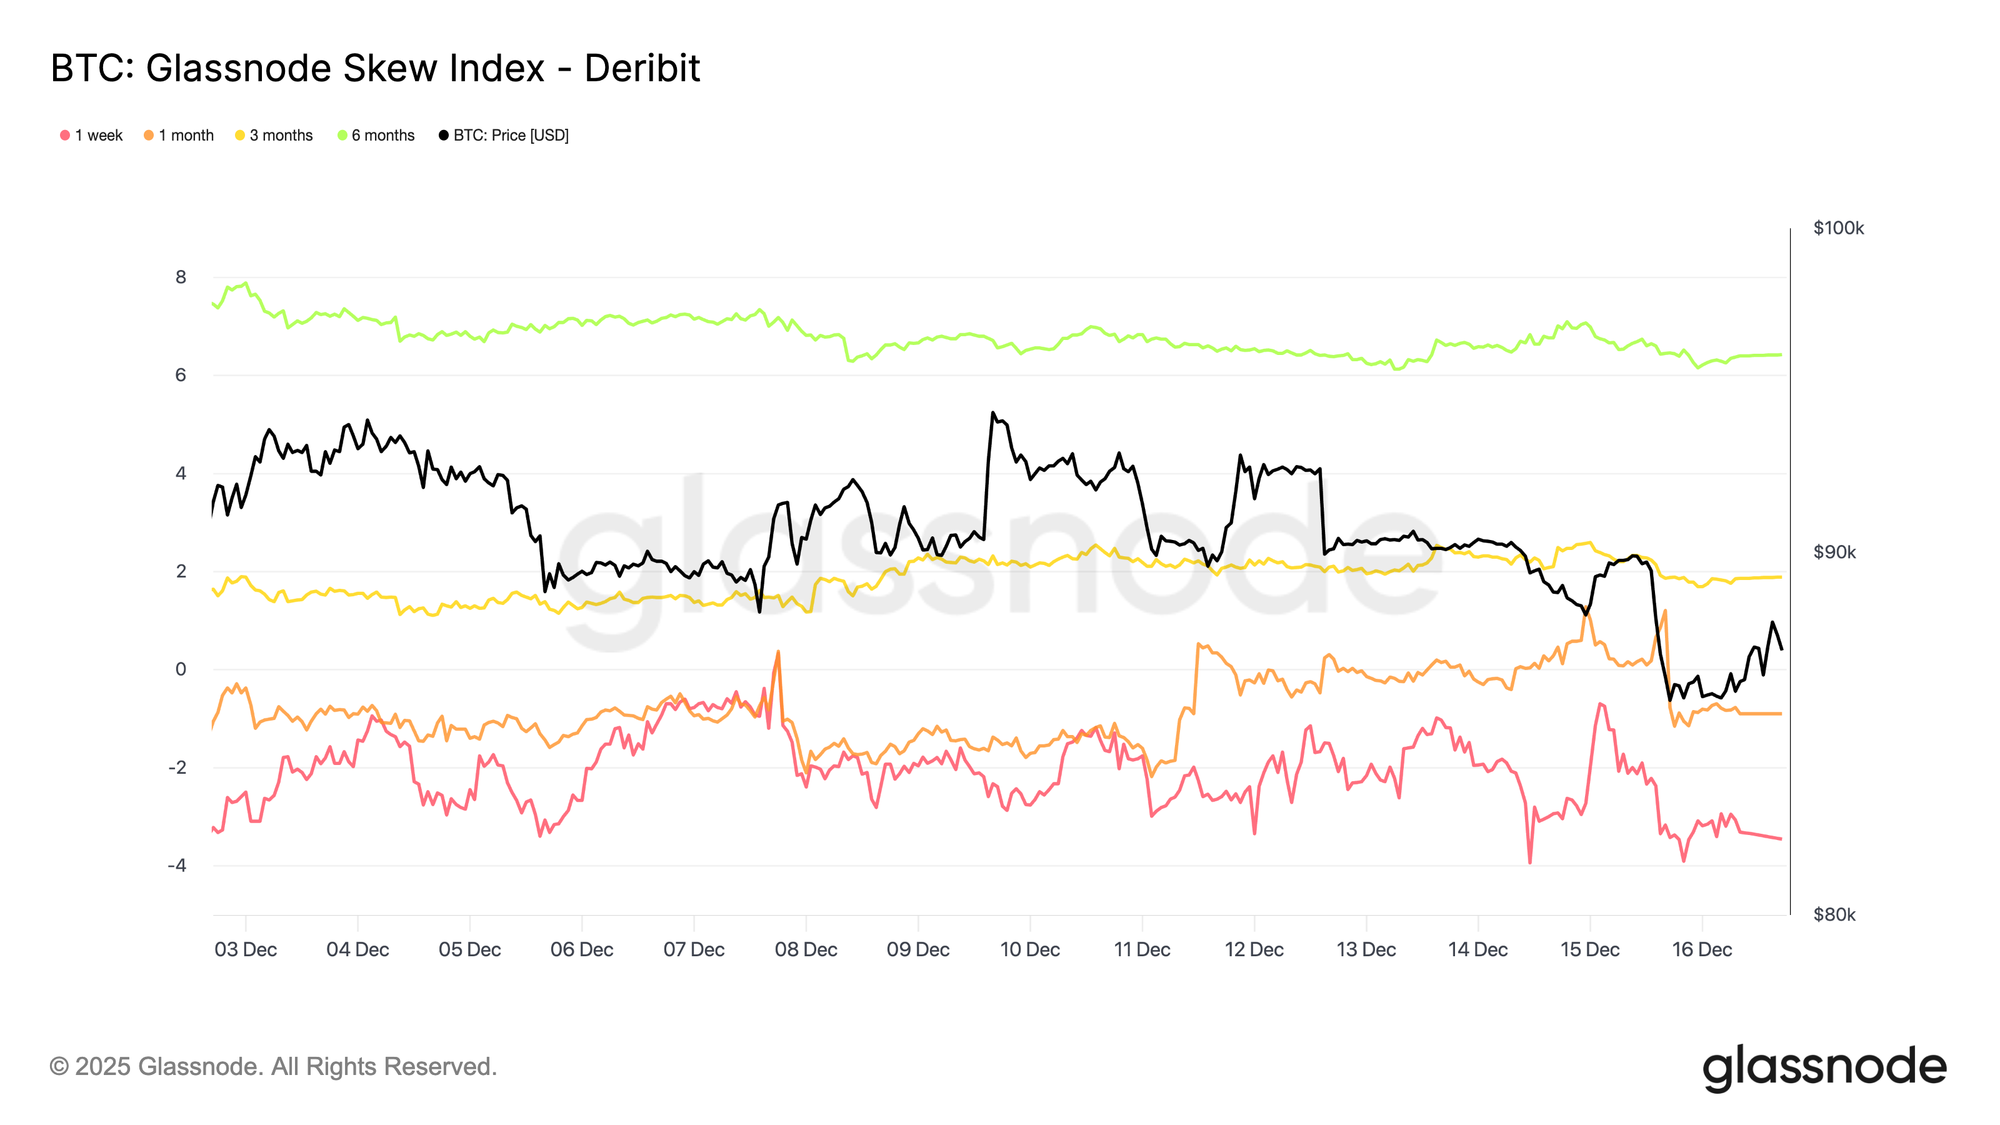
Скос сигнализирует о разделенных горизонтах
Смотря дальше по кривой, в то время как 25-дельта скос indicates, что защита от снижения остается оцененной across сроков, индекс скоса добавляет контекст о том, как этот риск распределен. На коротких сроках индекс остается отрицательным, что согласуется с 25-дельта скосом и подтверждает, что downside риск continues to command премию в near term. Дальше, однако, индекс скоса становится положительным, indicating relatively более высокая оценка exposure к росту на longer горизонтах.
Прочитанные вместе, эти меры suggest, что осторожность persists в short term, в то время как более долгосрочное позиционирование reflects растущий интерес к сценариям роста, а не увеличение хеджирования от снижения. Риск поддерживается в ближайшей перспективе и rebalanced дальше по кривой, а не смещается решительно в одном направлении.
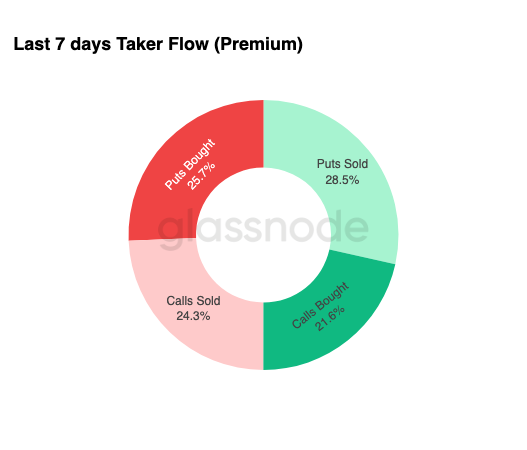
Потоки favoreствуют сбору премии
В соответствии со стабилизированным профилем скоса, потоки опционов показывают, как трейдеры выражают эту среду на практике. За последнюю неделю, taker flow был dominated by проданными путами, followed closely by купленными путами, indicating active монетизация премии alongside continued хеджирование. Taker flow reflects агрессивное исполнение, а не пассивное позиционирование, что делает его полезным сигналом current намерения. Продажа путов typically ассоциируется с генерацией дохода и уверенностью, что движения вниз останутся сдержанными, в то время как наличие покупки путов shows, что защита не была полностью abandoned.
Взятые вместе, потоки suggest, что трейдеры менее focused на позиционировании для пробоя и более comfortable собирают премию в сбалансированном, range-движимом рынке, а не оценивают imminent событие хвостового риска.
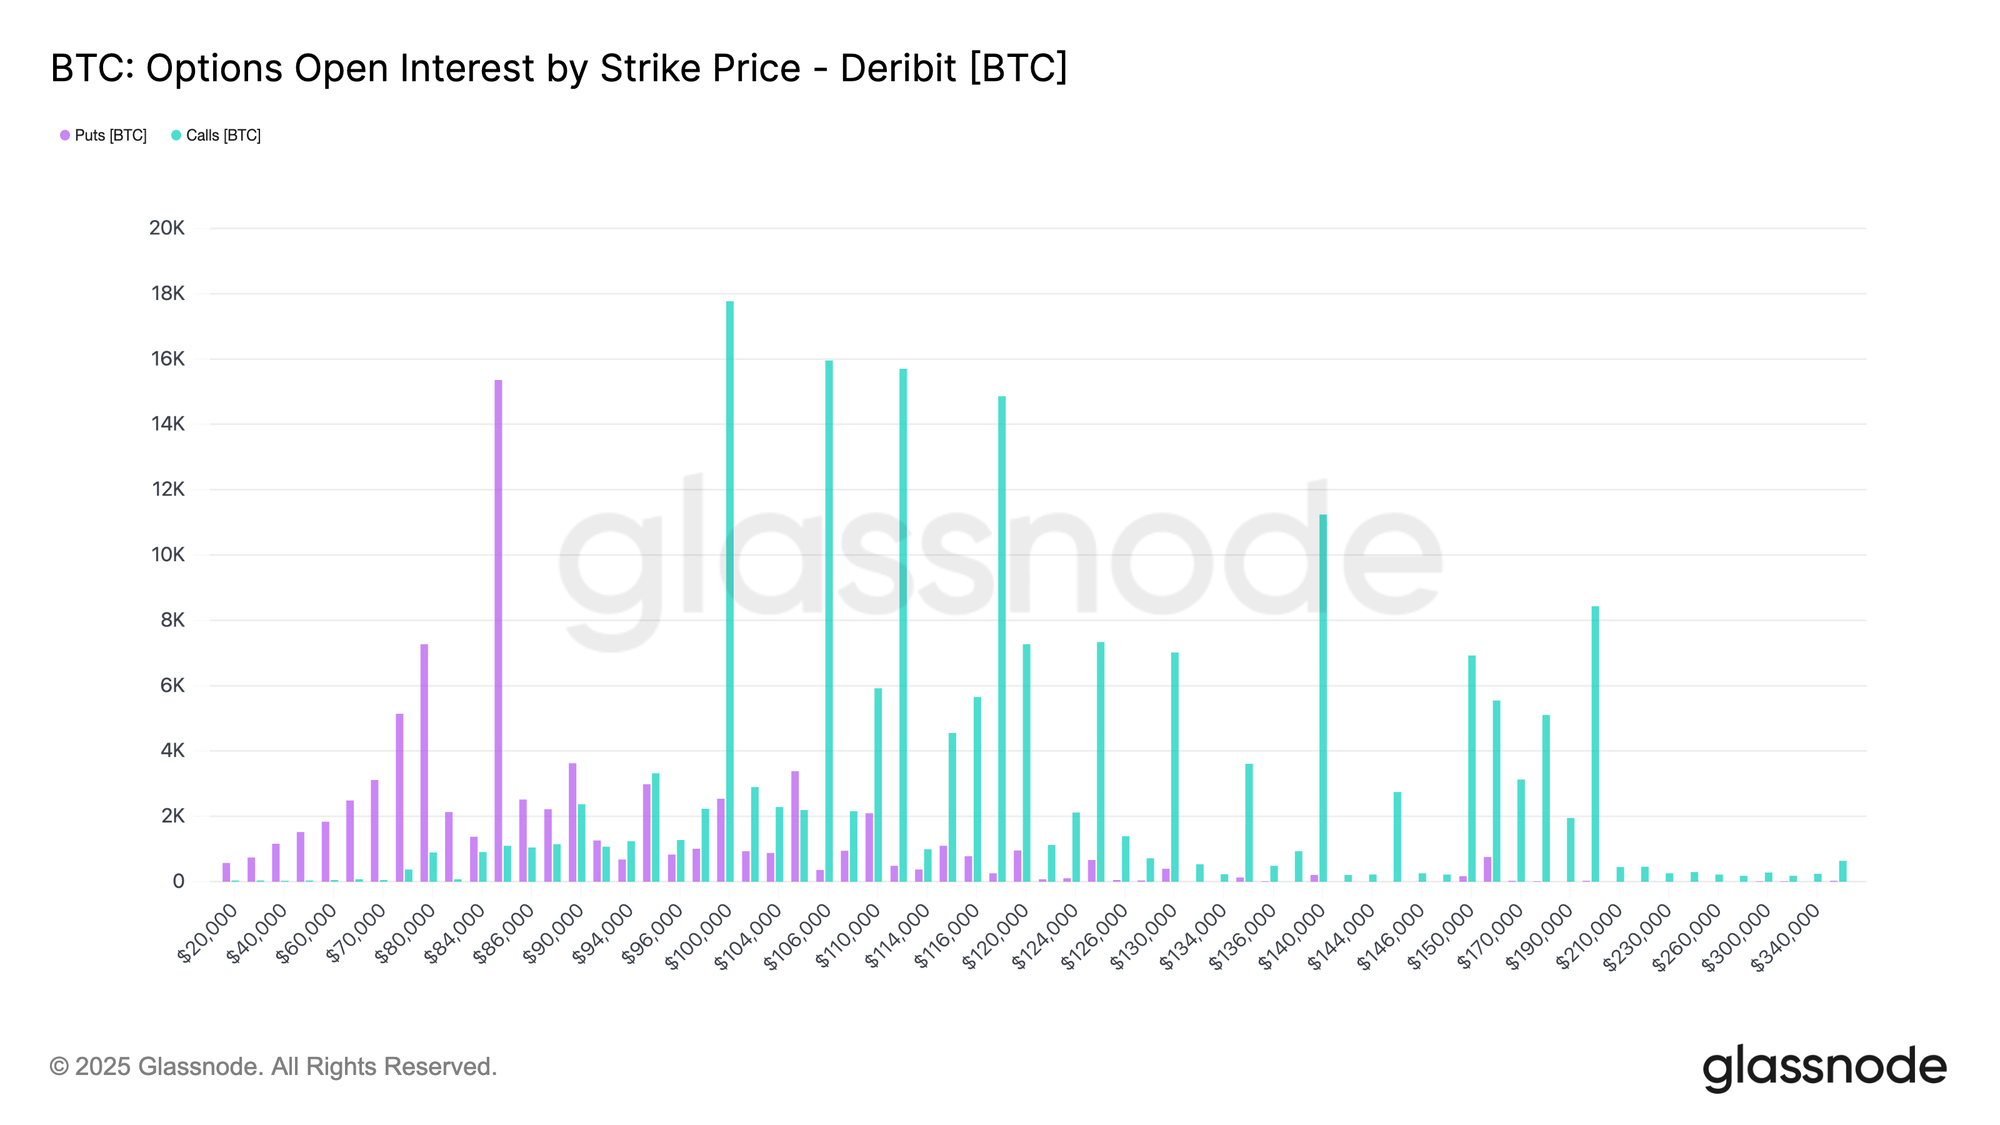
Экспирация приковывает рынок
На дальнем конце картины опционов, открытый интерес shows, что риск сильно сконцентрирован в двух экспирациях конца декабря, со значительной частью, сходящей 19 декабря, followed by much larger концентрацией 26 декабря. Крупные экспирации имеют значение, потому что они сжимают позиционирование и хеджирующую активность в specific даты, усиливая их влияние на краткосрочную динамику цены.
На current уровнях, эта концентрация оставляет дилеров long гамма по обе стороны рынка, incentivizing их продавать ралли и покупать снижения, чтобы оставаться хеджированными. Это поведение mechanically усиливает range-ограниченное ценовое действие и подавляет волатильность по мере приближения экспирации.
Эффект усиливается к крупнейшей экспирации года 26 декабря. Как только эта экспирация пройдет и связанные хеджи снимутся, ценовая гравитация, созданная этим позиционированием, естественно ослабнет, позволяя структуре рынка reset и новым динамикам emerge.
Заключение
Рынок continues to торговать within хрупкой, чувствительной ко времени структуре, сформированной тяжелым предложением сверху, растущей реализацией убытков и fading устойчивостью спроса. Отклонение цены near $93 тыс. и последующий дрейф к $85,6 тыс. отражают плотное предложение, накопленное между $93–120 тыс., где прежние крупные покупатели continue to ограничивать попытки восстановления. До тех пор пока цена остается ниже 0,75 квантиля (~$95 тыс.) и не может вернуть себестоимость краткосрочных держателей на уровне $101,5 тыс., восходящий прогресс, вероятно, останется ограниченным.
Despite это давление, терпеливый спрос до сих пор защищал Истинную Рыночную Среднюю near $81,3 тыс., предотвращая более глубокий слом. Спотовый спрос остается избирательным, потоки корпоративных казначейств эпизодическими, а позиционирование на фьючерсах continues to снижать риски, а не восстанавливать уверенность. Рынки опционов усиливают этот range-ограниченный режим, с сжатием краткосрочной волатильности, сохранением оцененного, но стабильного риска снижения, и экспирационно-движимым позиционированием, приковывающим ценовое действие к концу декабря.
В сумме, Bitcoin остается caught между структурной поддержкой near $81 тыс. и persistent давлением продаж сверху. Значимый сдвиг потребует либо истощения продавцов выше $95 тыс., либо renewed притока ликвидности, способного поглотить предложение и вернуть ключевые уровни себестоимости.
Отказ от ответственности: Этот отчет не предоставляет каких-либо инвестиционных рекомендаций. Все данные предоставляются исключительно в информационных и образовательных целях. Ни одно инвестиционное решение не должно основываться на информации, предоставленной здесь, и вы solely несете ответственность за свои собственные инвестиционные решения.
Балансы бирж, представленные здесь, получены из комплексной базы данных Glassnode с метками адресов, которые собираются как через официально опубликованную информацию бирж, так и через проприетарные алгоритмы кластеризации. Хотя мы стремимся обеспечить максимальную точность в представлении биржевых балансов, важно отметить, что эти цифры могут не всегда охватывать всю полноту резервов биржи, particularly когда биржи воздерживаются от раскрытия своих официальных адресов. Мы призываем пользователей проявлять осторожность и осмотрительность при использовании этих метрик. Glassnode не несет ответственности за любые несоответствия или потенциальные неточности.
Пожалуйста, прочитайте наше Уведомление о прозрачности при использовании данных бирж.