Количество открытых вакансий в США выросло в апреле до 7,62 миллиона, что является самым высоким показателем за последние почти два года и на 750 000 превышает консенсус-прогноз. В ответ доходность 10-летних облигаций вернулась выше уровня 4,45%, а рынки пересмотрели ожидания по ФРС: теперь вероятность повышения ставки к концу года оценивается более чем в 50%, а сокращений ставки в прогнозе не осталось. Индекс DXY держится выше 99. Финансовые условия ужесточаются, а не смягчаются.
Биткоин воспринял этот сдвиг острее любого другого рискового актива. За прошедшую неделю цена снизилась на 13% до диапазона 67 000 долларов. Спотовые ETF США зафиксировали отток средств в размере 4,21 млрд долларов за три недели — это крупнейшая полоса институциональных погашений за 2026 год. Институты снижают риски еще до падения цены, а не реагируют на него. Ключевыми данными для мониторинга станет отчет по занятости в несельскохозяйственном секторе (Nonfarm Payrolls) в пятницу. Сильные данные продолжат текущее давление распределения (дистрибуции); слабые данные создадут первые условия для перезагрузки.
Обзор цепочки (On-chain)
Снова внутри медвежьего диапазона
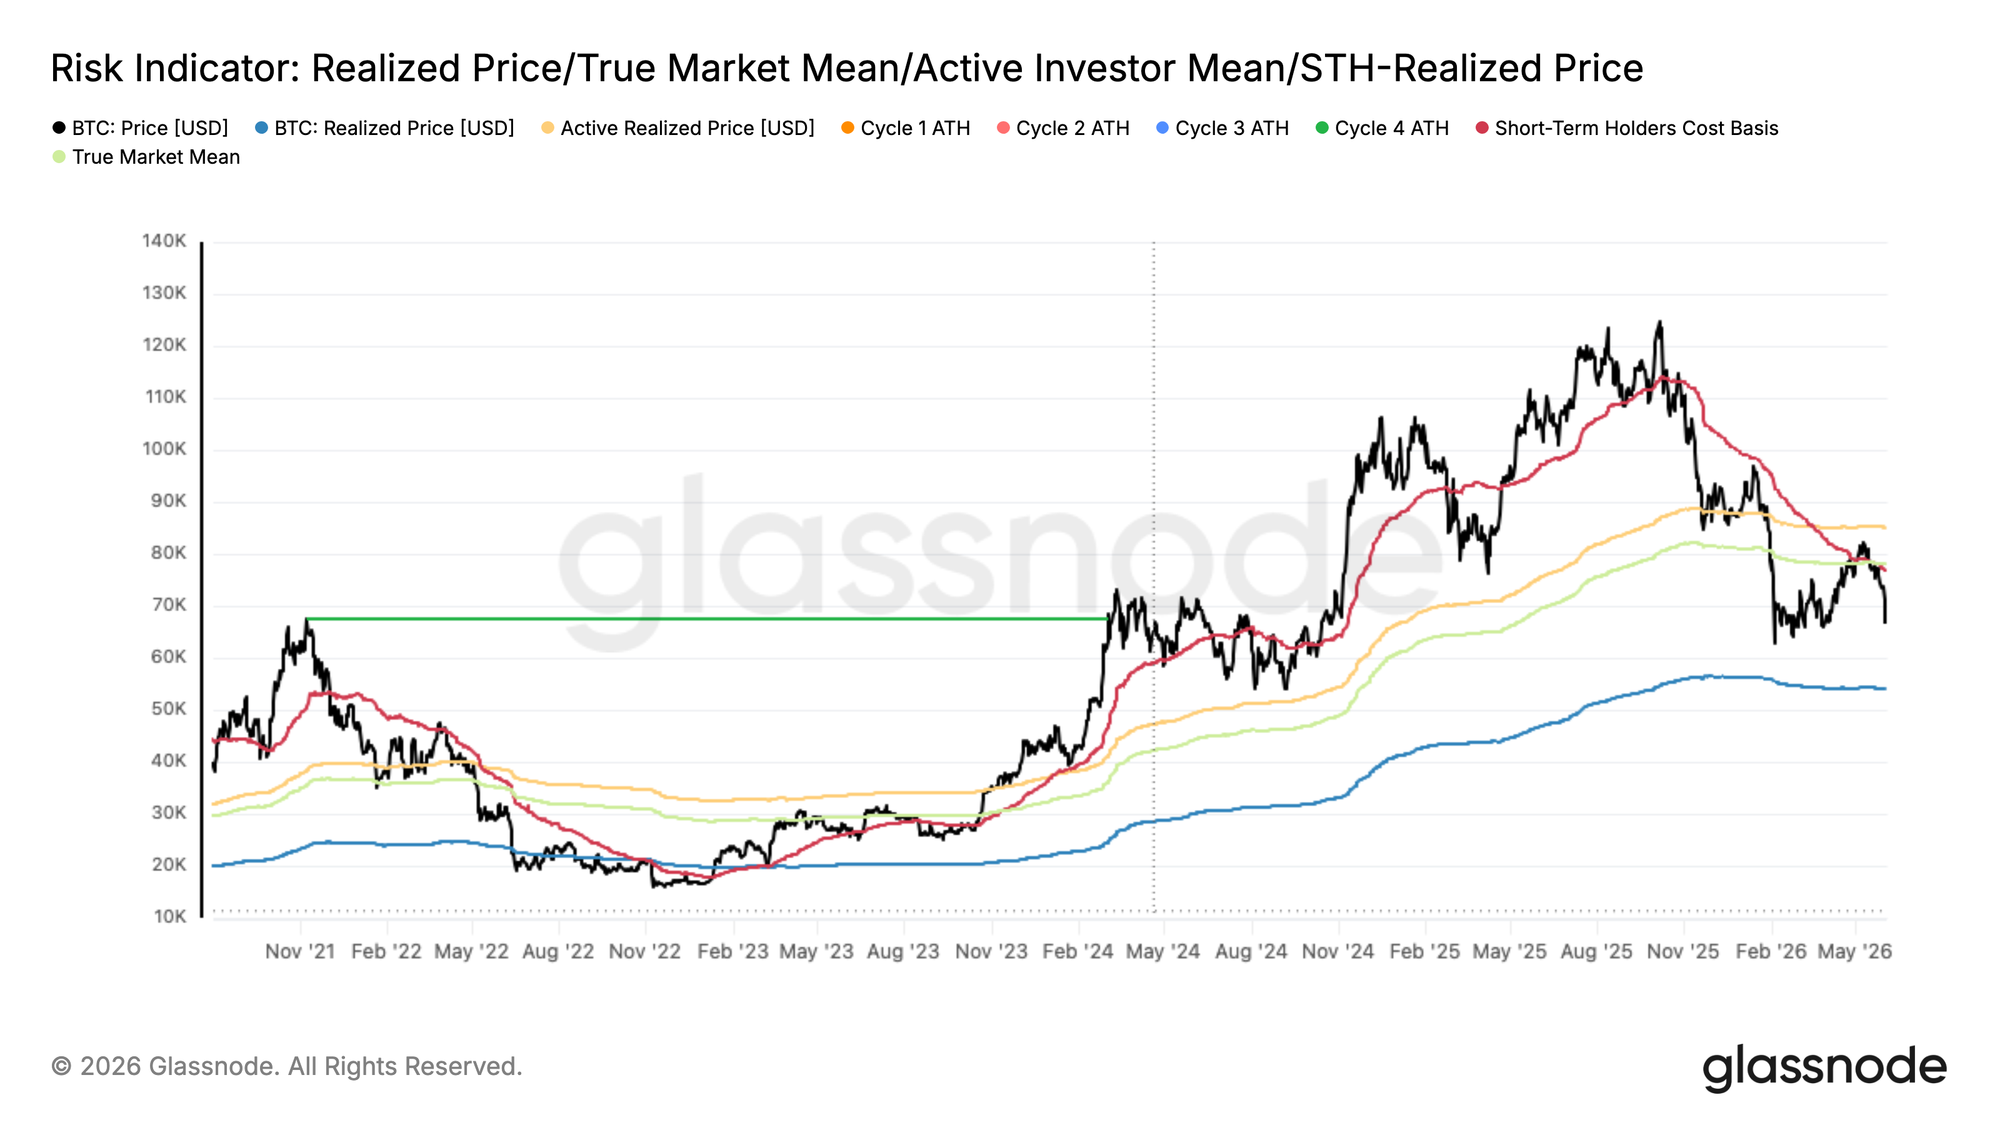
Макроэкономические риски, описанные выше, напрямую вылились в ухудшение ончейн-структуры. Снижение на 13% за прошедшую неделю решительно оттянуло цену от Истинного рыночного среднего (True Market Mean) на уровне 77,8 тыс. долларов (который отслеживает себестоимость активно перемещаемого предложения и исторически обозначает границу между медвежьим и бычьим режимами рынка) к нижней границе зоны стоимости медвежьего рынка, определяемой Реализованной ценой (Realized Price) на уровне 53,9 тыс. долларов (измеряющей среднюю стоимость приобретения всего циркулирующего предложения). На уровне 67 000 долларов биткоин торгуется вблизи середины этого диапазона, а неспособность удержаться выше Истинного рыночного среднего повторно подтверждает, что продолжение медвежьего рынка остается преобладающим режимом.
Что интересно, Себестоимость краткосрочных держателей (Short-Term Holder Cost Basis) на уровне 76,4 тыс. долларов сейчас опустилась ниже Истинного рыночного среднего — такая структура в последний раз наблюдалась в январе 2022 года. Эта конфигурация указывает на то, что новые покупатели накапливают актив ниже ключевого для рынка уровня средней оценки, что является отличительной чертой поздней стадии медвежьего рынка, когда временная составляющая просадки начинает подрывать уверенность инвесторов и когда структурные сбои или капитуляция более крупных игроков исторически становятся более частыми.
Перекос в прибыльности рухнул на нисходящем движении
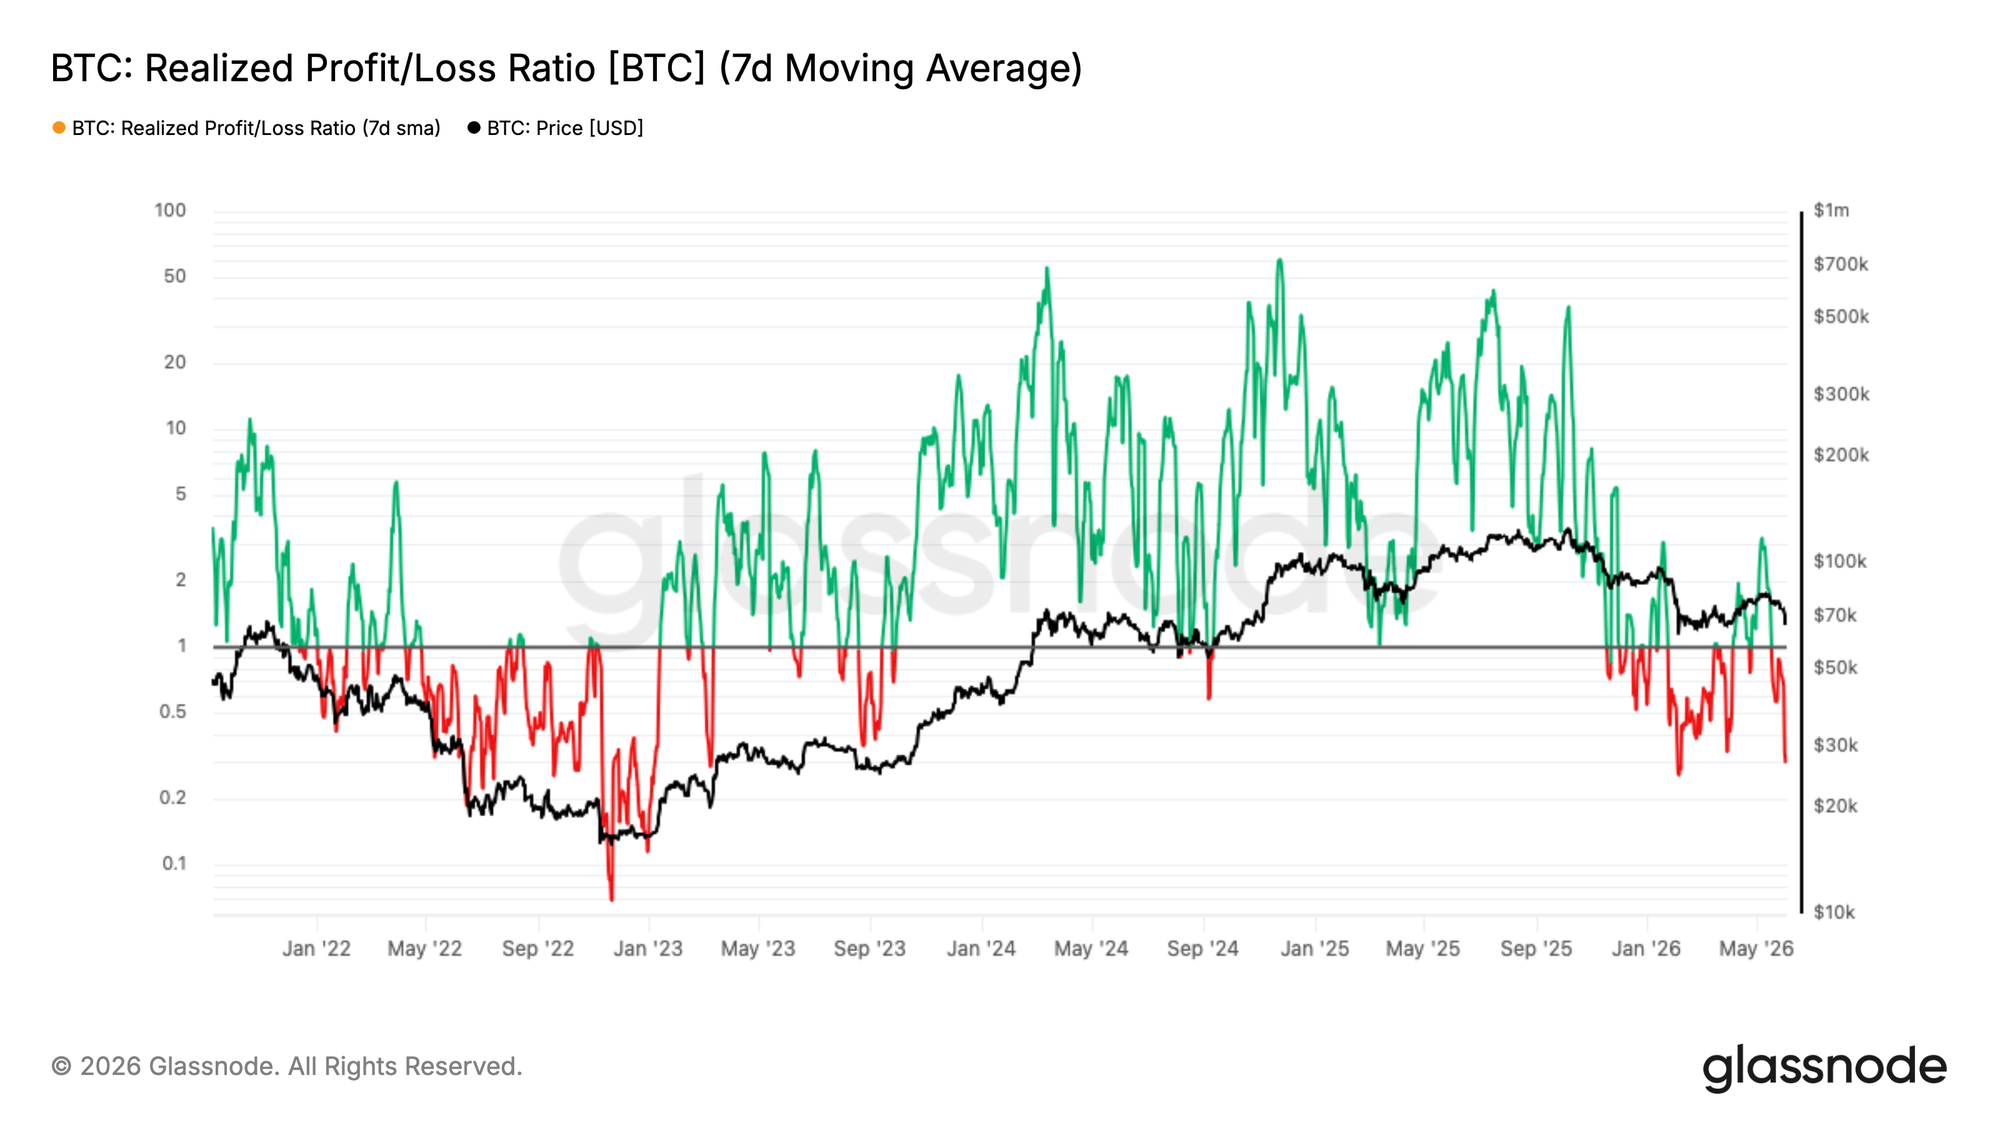
Продолжая тему структурного ухудшения, краткосрочная среда движения капитала резко изменилась в ответ на недавнее падение цены. Скользящая средняя за 7 дней коэффициента Реализованной прибыли/убытка (Realized Profit/Loss Ratio), который измеряет краткосрочный баланс между фиксируемыми в ончейне прибылями и убытками, сократилась до 0,29, что указывает на то, что фиксация убытков теперь значительно преобладает в активности расходования средств. Это почти в точности повторяет вызванную паникой волну, наблюдавшуюся в первую неделю февраля. 7 мая 7-дневная скользящая средняя взлетела до 3,16, поскольку инвесторы бросились фиксировать прибыль на ралли до 82 тыс. долларов, но 90-дневная скользящая средняя так и не преодолела порог в 2, связанный с подлинными бычьими условиями движения капитала. Это расхождение между краткосрочными и долгосрочными показателями было красноречивым сигналом того, что ралли не имело структурной убежденности, и эта картина соответствует формированию локального максимума на медвежьем рынке, а не достоверной смене режима. Последующий коллапс обратно до 0,29 подтверждает эту интерпретацию.
Новые покупатели под давлением
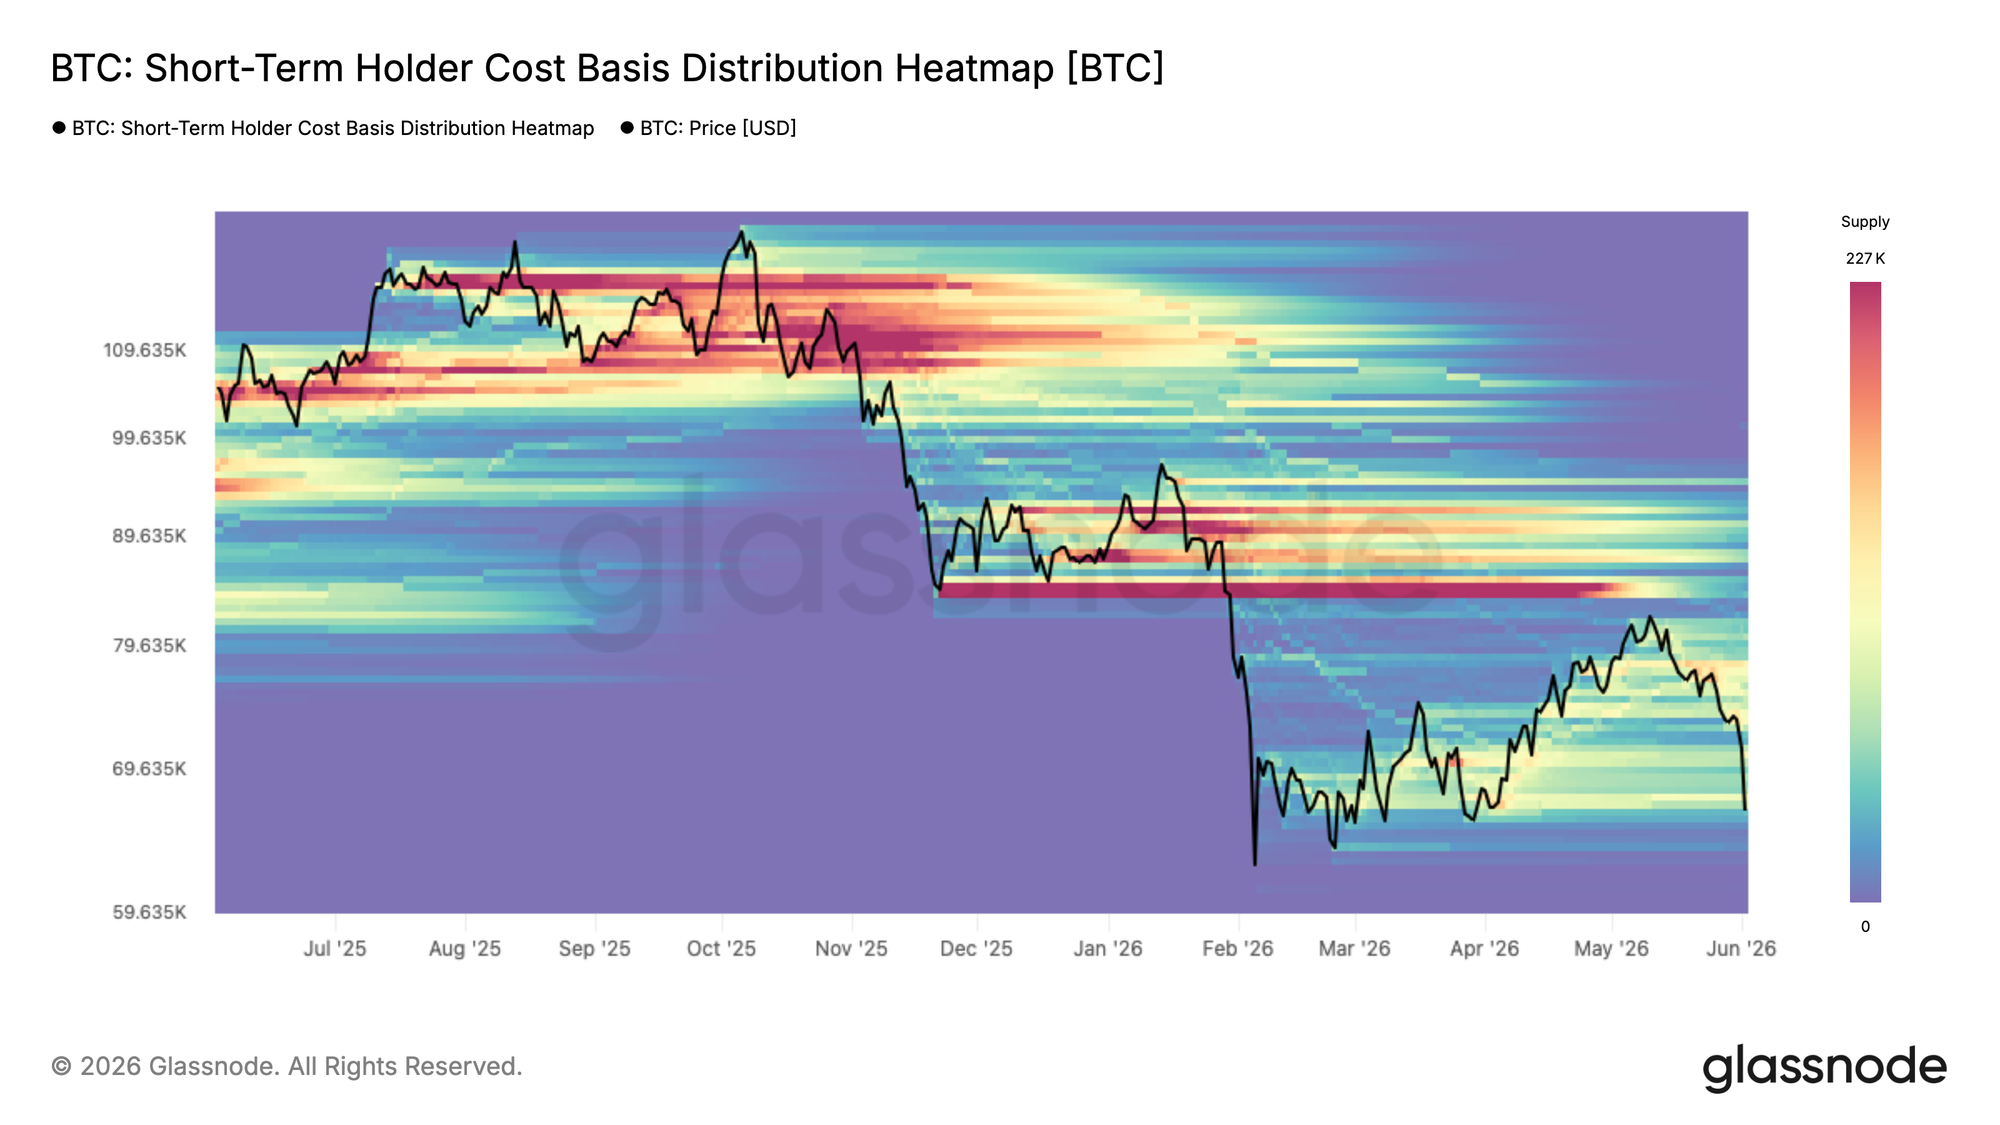
Отскок от потолка медвежьего рынка поставил под удар предложение, накопленное в самое последнее время. Тепловая карта распределения себестоимости краткосрочных держателей (Short-Term Holder Cost Basis Distribution Heatmap) визуализирует плотность предложения, принадлежащего недавним покупателям, по ценовым уровням, показывая, где сконцентрирована себестоимость краткосрочных держателей и, следовательно, где с наибольшей вероятностью может возникнуть поведенческое давление.
Теперь, когда цена откатывается к 67 тыс. долларов, она приближается к нижней границе кластера предложения, накопленного с февраля, — зоны, где значительный объем краткосрочных держателей наблюдает, как их нереализованная прибыль сжимается к точке безубыточности или переходит в убыток. Те, кто накапливал актив в диапазоне от 78 тыс. до 82 тыс. долларов вблизи локального пика, сейчас испытывают самое непосредственное давление, и от того, будут ли они держать или капитулировать, во многом зависит, поглотят ли текущие уровни продажи или уступят место более глубокому падению.
Фиксация убытков ускоряется во всех когортах
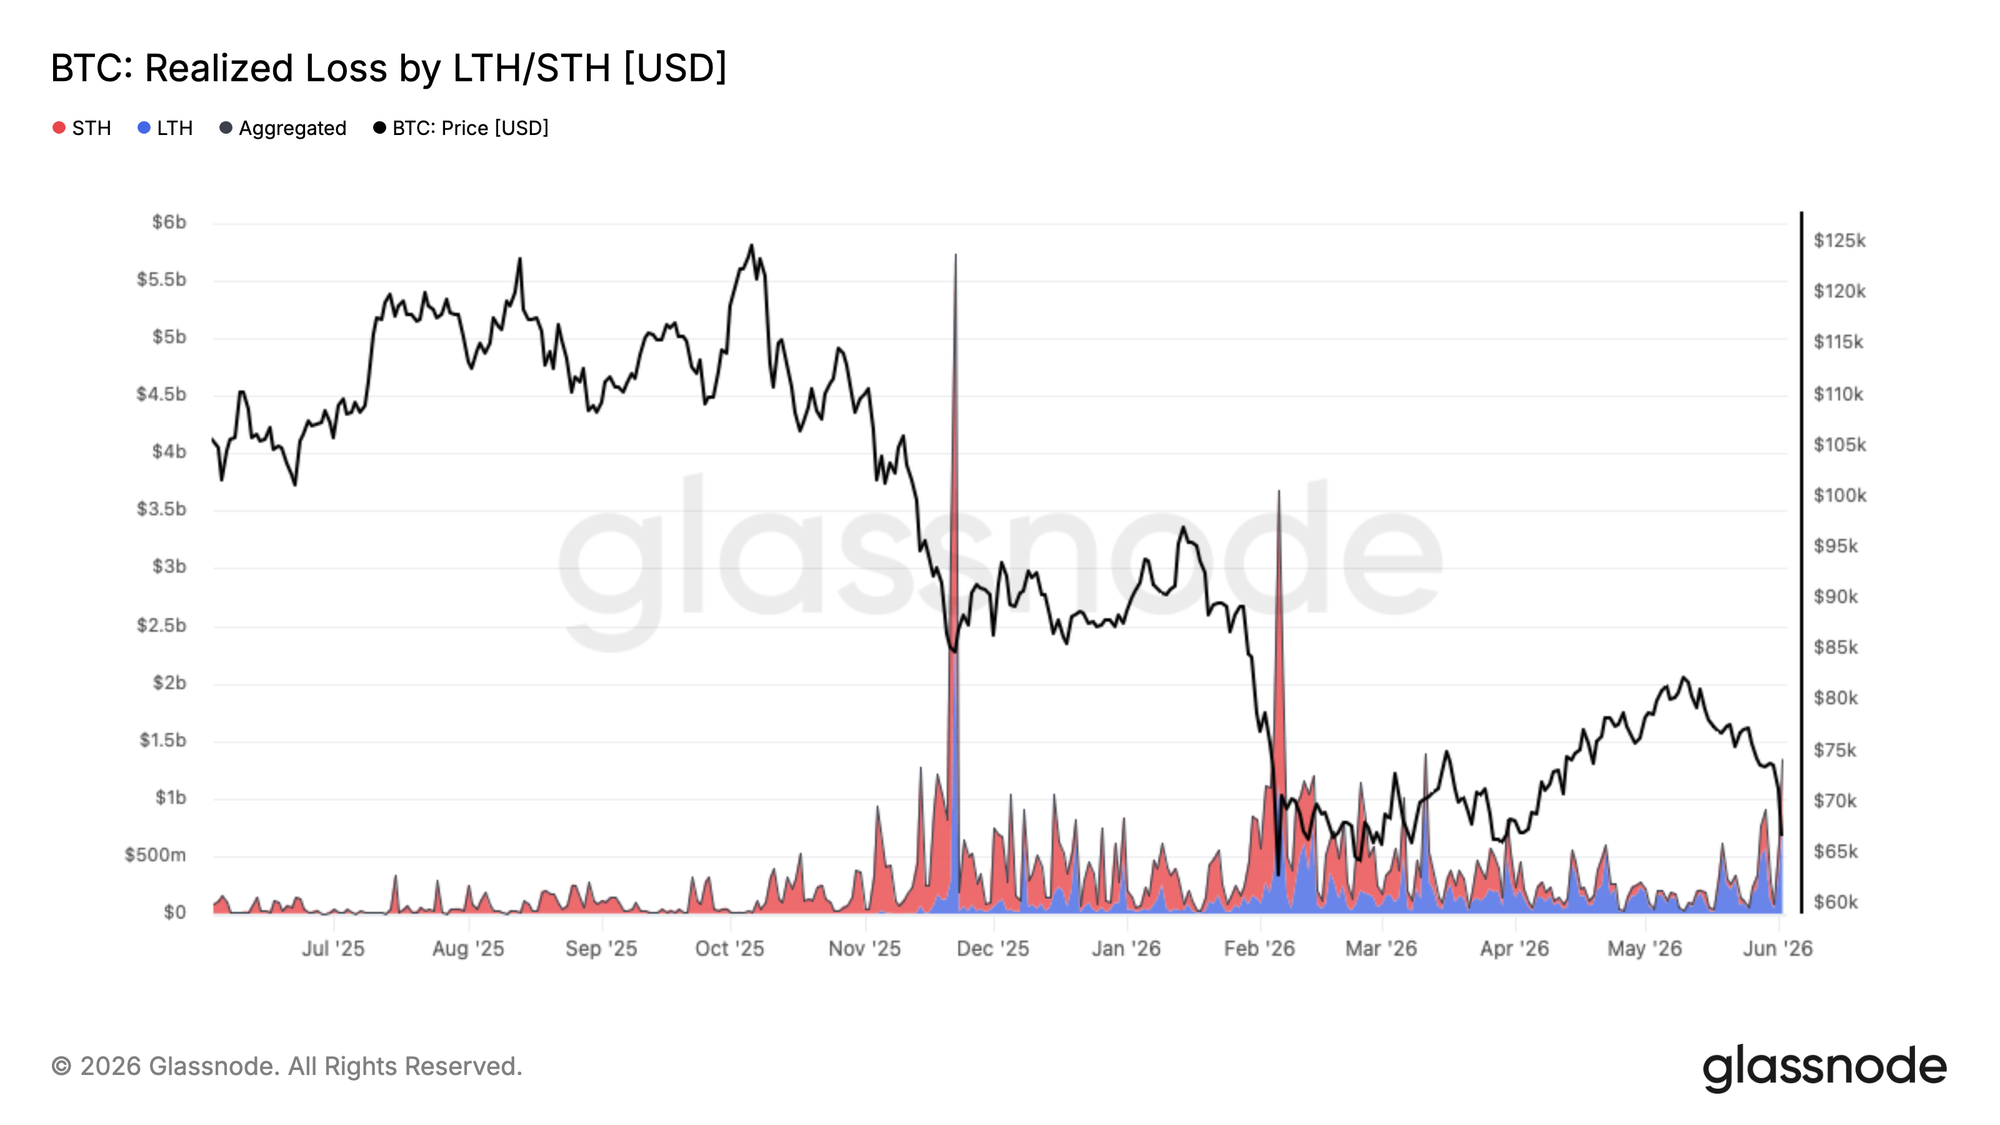
Теперь, когда недавние покупатели сталкиваются со сжатием к нижней границе трехмесячного диапазона, давление на фиксацию убытков расширяется за пределы лишь самого последнего накопленного предложения. Текущая коррекция до 67 тыс. долларов привела к росту суммарных Реализованных убытков (Realized Loss) до 1,35 млрд долларов в день — резкое ускорение по сравнению с базовыми уровнями, наблюдавшимися в предшествующий период консолидации.
Из этого объема 770 млн долларов в день фиксируется долгосрочными держателями, которые приобрели свои монеты до января 2026 года, что отражает продолжающуюся капитуляцию покупателей на пике цикла по мере того, как медвежий рынок растягивается во времени. Оставшийся объем приходится на недавних покупателей, которые накапливали актив в диапазоне от 67 тыс. до 82 тыс. долларов в течение 2026 года и теперь вынуждены выходить с убытком, поскольку цена опускается ниже их себестоимости.
По мере созревания медвежьего рынка эта модель капитуляции долгосрочных держателей, передающих предложение в новые руки по более низким ценам, является повторяющейся и необходимой чертой процессов формирования дна цикла, хотя текущие темпы фиксации убытков позволяют предположить, что этот процесс остается незавершенным.
Обзор вне цепочки (Off-chain)
Ниже себестоимости ETF
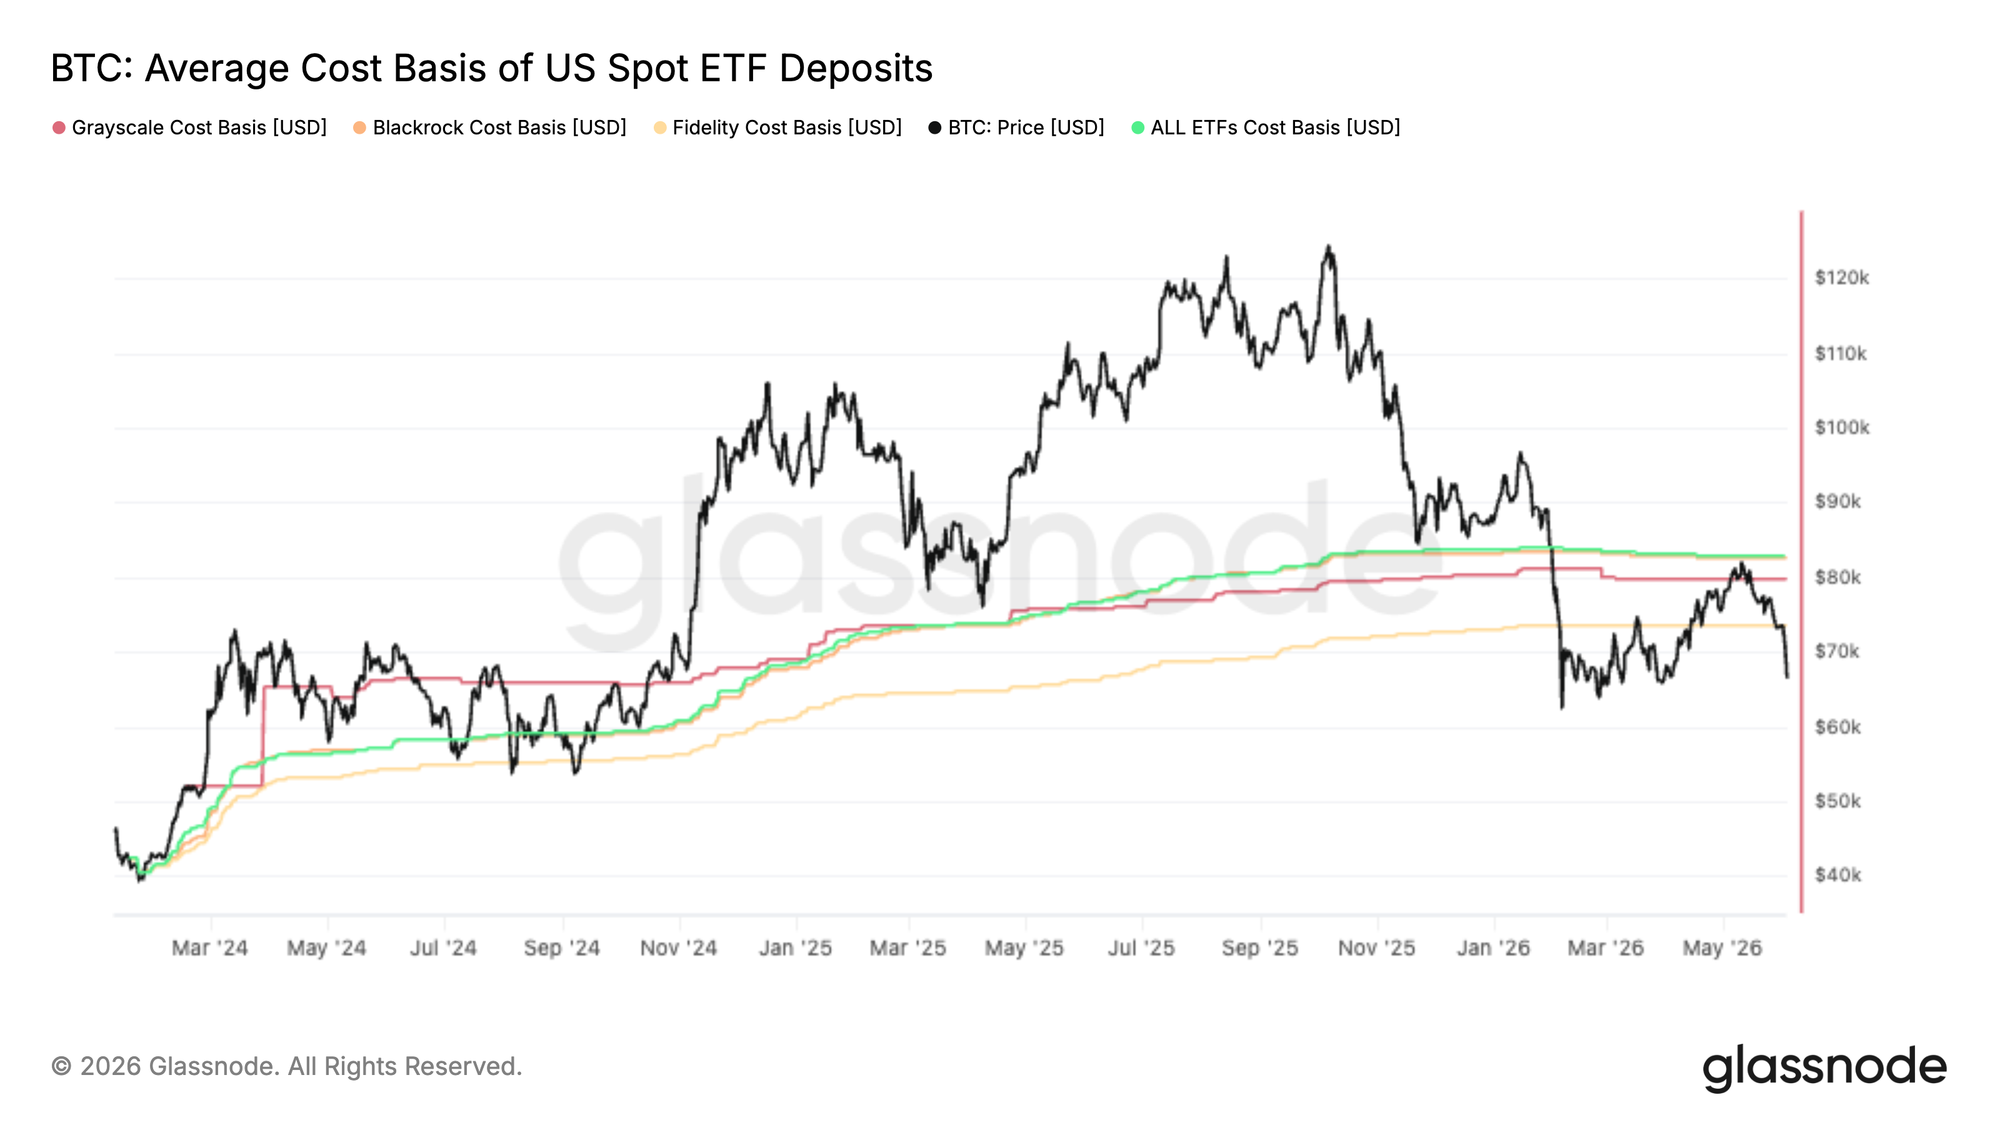
Последнее ралли биткоина остановилось почти точно на уровне совокупной себестоимости спотовых ETF США, составляющей около 83 тыс. долларов, превратив то, что ранее выступало в качестве поддержки, в четкую зону сопротивления. Это говорит о том, что значительная часть инвесторов ETF, которые были в убытке, воспользовались восстановлением, чтобы сократить подверженность или выйти в безубыток.
Отскок особенно примечателен, поскольку потоки ETF были одним из основных источников спроса на протяжении всего этого цикла. Когда цена не может вернуться выше средней себестоимости держателей, это может сигнализировать о том, что предложение от «запертых» инвесторов перевешивает новый спрос, создавая сопротивление сверху.
Если смотреть вперед, совокупная себестоимость ETF остается ключевым уровнем для наблюдения. Решительное возвращение выше этого уровня вернет среднего инвестора ETF в прибыль и, вероятно, улучшит настроения в этой когорте. До тех пор неспособность удержаться выше этого уровня указывает на то, что позиционирование ETF остается встречным ветром, и инвесторы по-прежнему используют силу для снижения рисков, а не для накопления.
Спотовый спрос исчез
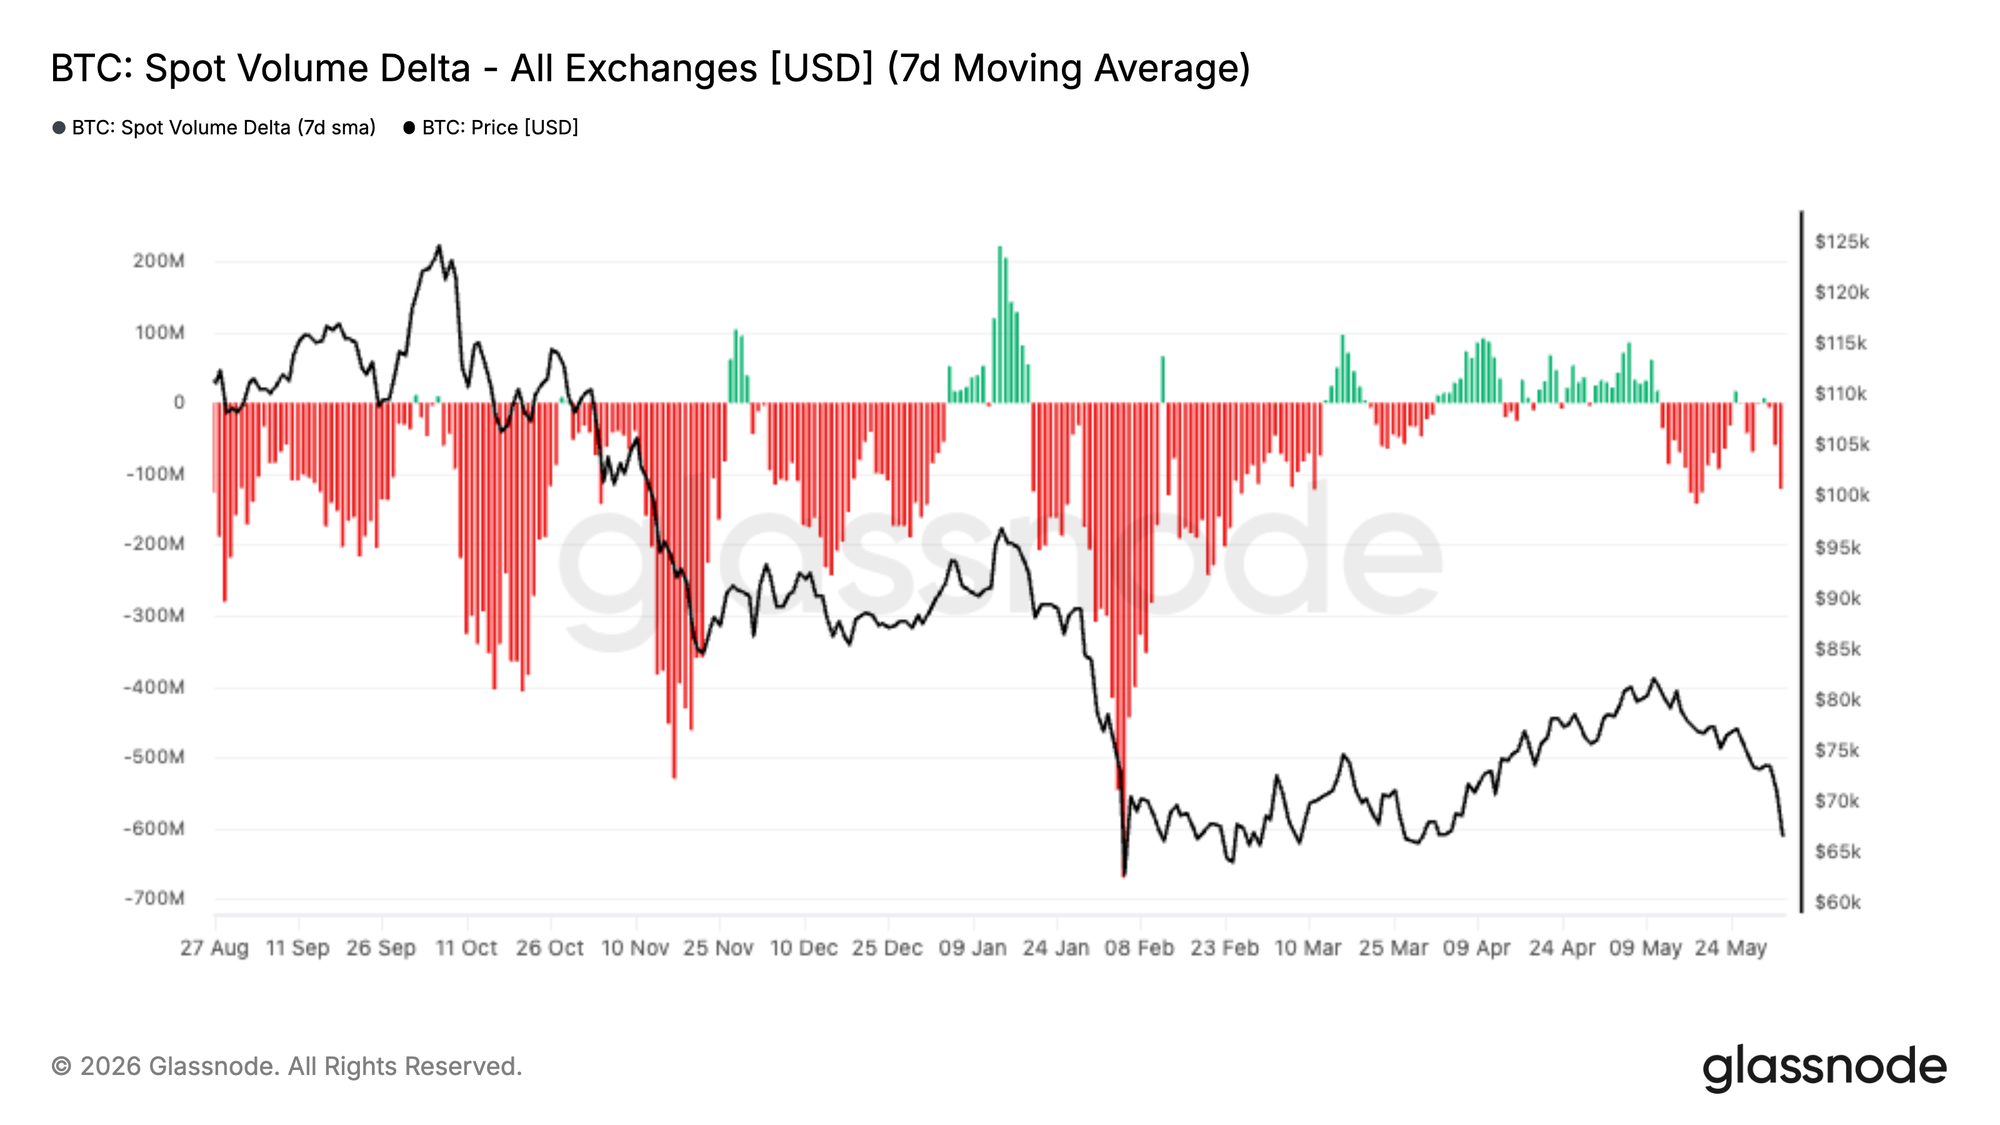
Спотовые потоки резко ухудшились за последние две недели: 7-дневная дельта спотового объема (Spot Volume Delta) решительно перешла в отрицательную зону и достигла уровней, невиданных с февраля. Это указывает на то, что агрессивные продавцы снова доминируют в спотовых стаканах заявок, усиливая слабость, наблюдаемую в недавнем ценовом действии.
Текущее движение примечательно тем, что оно следует за периодом устойчивого накопления, возглавляемого спотом, на протяжении апреля и начала мая. Во время этого роста покупатели последовательно поднимали предложения и толкали дельту спотового объема в положительную территорию, помогая подпитывать восстановление биткоина с уровня середины 60 тысяч долларов к 80 тысячам долларов. Этот импульс спроса теперь угас, и продавцы вернули контроль, когда цена не смогла пробиться выше.
Стойкая отрицательная дельта спотового объема обычно сопровождает либо события капитуляции, либо ранние стадии более широкого разворота тренда. Пока это говорит о том, что рынок остается в фазе дистрибуции (распределения), и спотовые участники используют ралли для продажи на силе, а не для накопления. Значительное улучшение спотового спроса остается одним из ключевых сигналов, необходимых для поддержки устойчивого восстановления.
Ликвидации фьючерсов
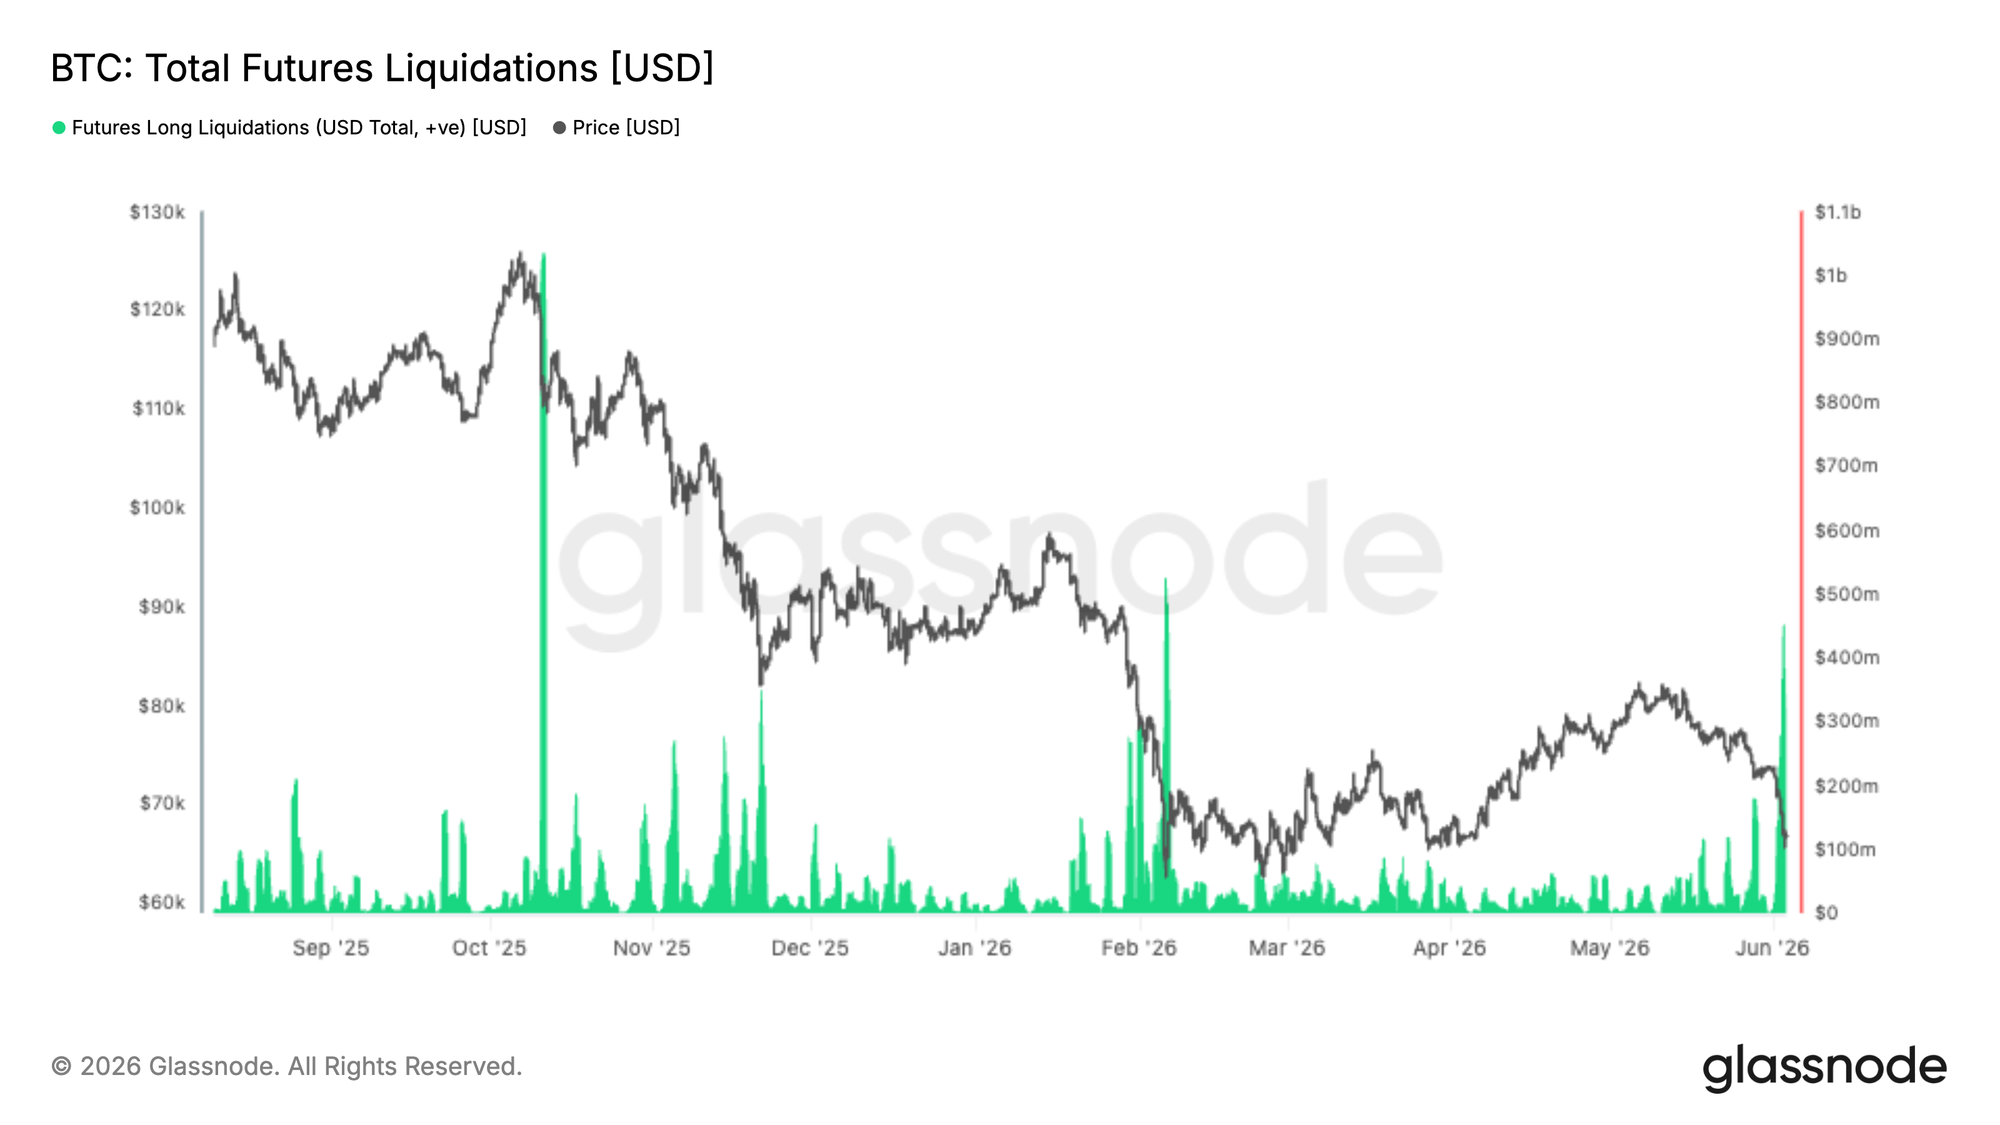
Последний рыночный спад вызвал одно из крупнейших событий ликвидации длинных позиций в текущем цикле: свыше 400 млн долларов в позициях с левериджем были принудительно закрыты, когда биткоин упал ниже 70 тыс. долларов. Хотя это болезненно для поздно вошедших, такие события часто помогают вымыть чрезмерный леверидж из системы и сбросить рыночное позиционирование.
Примечательно, что масштаб ликвидаций остается ниже крупнейших распродаж, наблюдавшегося во время коррекций в октябре 2025 и феврале 2026 года, что позволяет предположить, что леверидж не был столь экстремальным перед этим падением. Исторически крупные ликвидации длинных позиций совпадали с локальными точками истощения, поскольку давление вынужденных продаж каскадируется через рынки деривативов и очищает систему от слабых рук.
Ключевой вопрос на будущее — появится ли спотовый спрос, чтобы поглотить предложение. Если продажи, вызванные ликвидациями, начнут ослабевать, а спотовые покупатели вернутся, рынок может оказаться с более чистым позиционированием и сниженным левериджем, создавая условия для более устойчивого восстановления.
Подразумеваемая волатильность продолжает снижаться
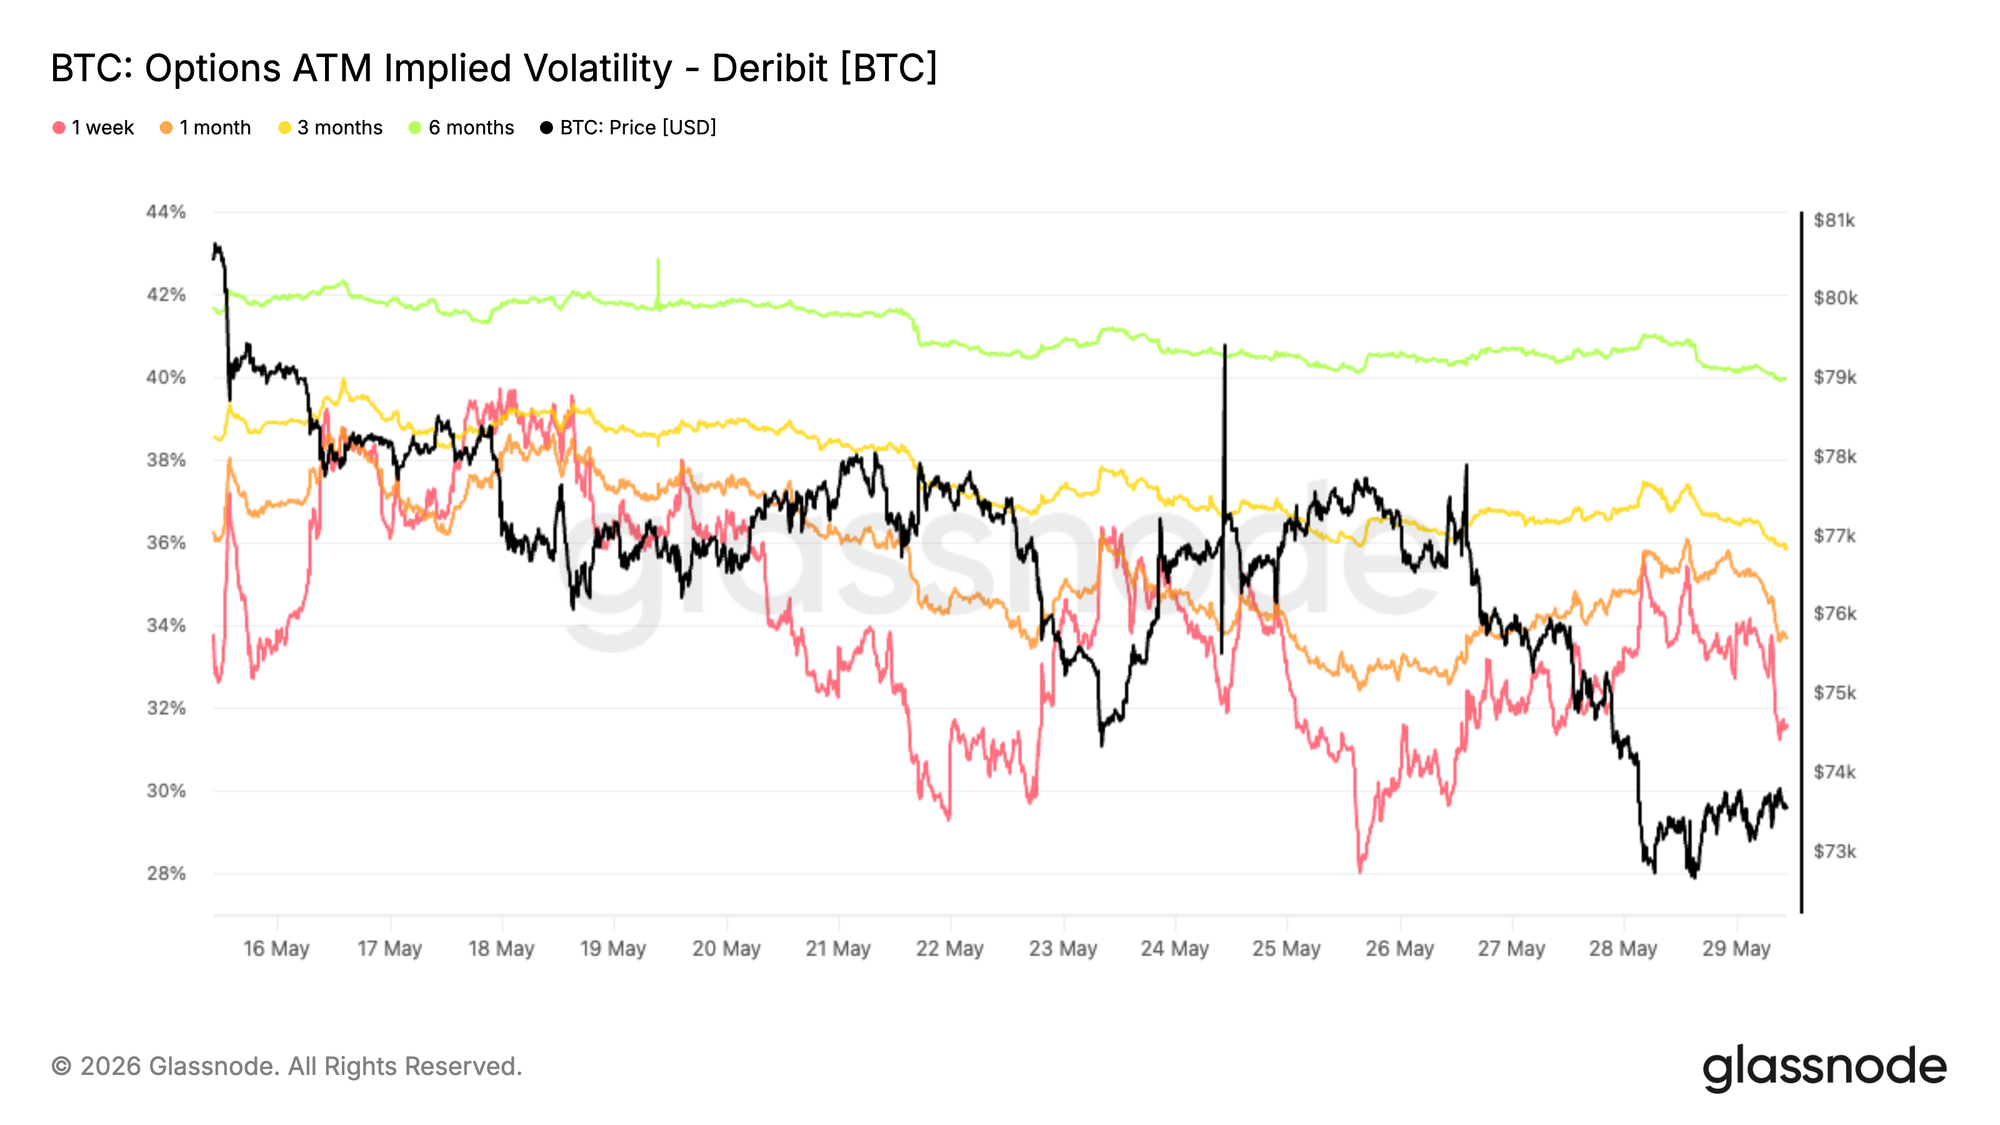
Начиная с подразумеваемой волатильности (IV), доминирующим трендом на всей кривой остается снижение, несмотря на недавний прорыв на споте. Показатель для 1 месяца упал примерно с 38% до 34%, а показатели для 3 и 6 месяцев также сжались примерно на 3 пункта волатильности за последние две недели.
Это движение отражает рынок, который по-прежнему не желает платить за опционы, даже несмотря на то, что биткоин пробил нижнюю границу своего недавнего диапазона. Хотя краткосрочная волатильность кратковременно реагировала на резкие движения спота, эти всплески быстро продавались, сохраняя более широкий нисходящий тренд.
Срочная структура остается в контанго (contango), при этом более долгосрочная волатильность по-прежнему торгуется с премией к краткосрочной. Это говорит о том, что трейдеры продолжают рассматривать недавнюю слабость цены как локальное событие, а не как катализатор для более широкого пересмотра волатильности.
Продавцы волатильности остаются под контролем, а спрос на защиту не ускоряется, несмотря на более слабое ценовое действие.
Премия за волатильность приближается к трехмесячным максимумам
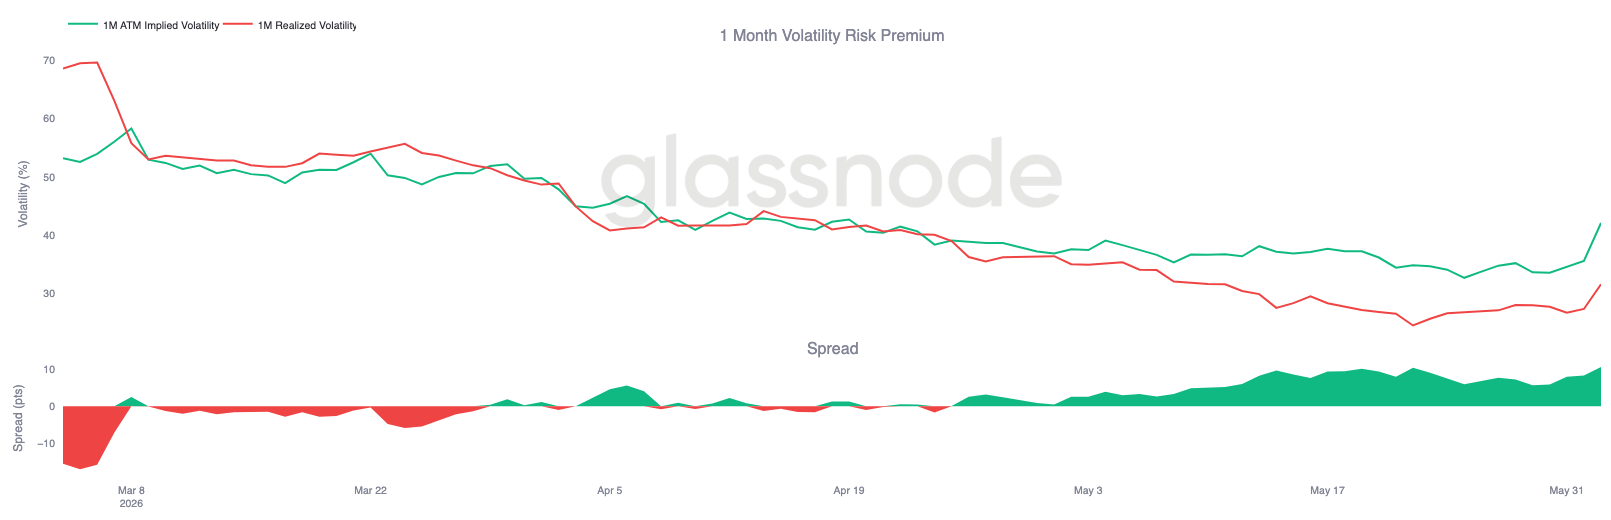
После снижения подразумеваемой волатильности взаимосвязь между подразумеваемой и реализованной волатильностью (RV) рисует другую картину. Хотя биткоин переживал волатильный период, рынки опционов продолжают закладывать значительно больше движения вперед, чем спот демонстрировал недавно.
Подразумеваемая волатильность на 1 месяц восстановилась примерно до 42%, в то время как реализованная волатильность остается ближе к 32%. В результате премия за волатильность (volatility risk premium) расширилась до уровней, близких к самым высоким, наблюдаемым за последние три месяца.
Это движение было особенно заметно во время недавнего снижения. Хотя реализованная волатильность выросла, когда биткоин пробил ключевые уровни поддержки, подразумеваемая волатильность росла еще быстрее, что отражает возросший спрос на опционы и защиту.
Рынки опционов продолжают закладывать более высокую вероятность будущей волатильности, чем можно было бы предположить, исходя только из недавнего ценового действия, сохраняя премию за волатильность устойчиво высокой.
Премии за пут-опционы остаются повышенными
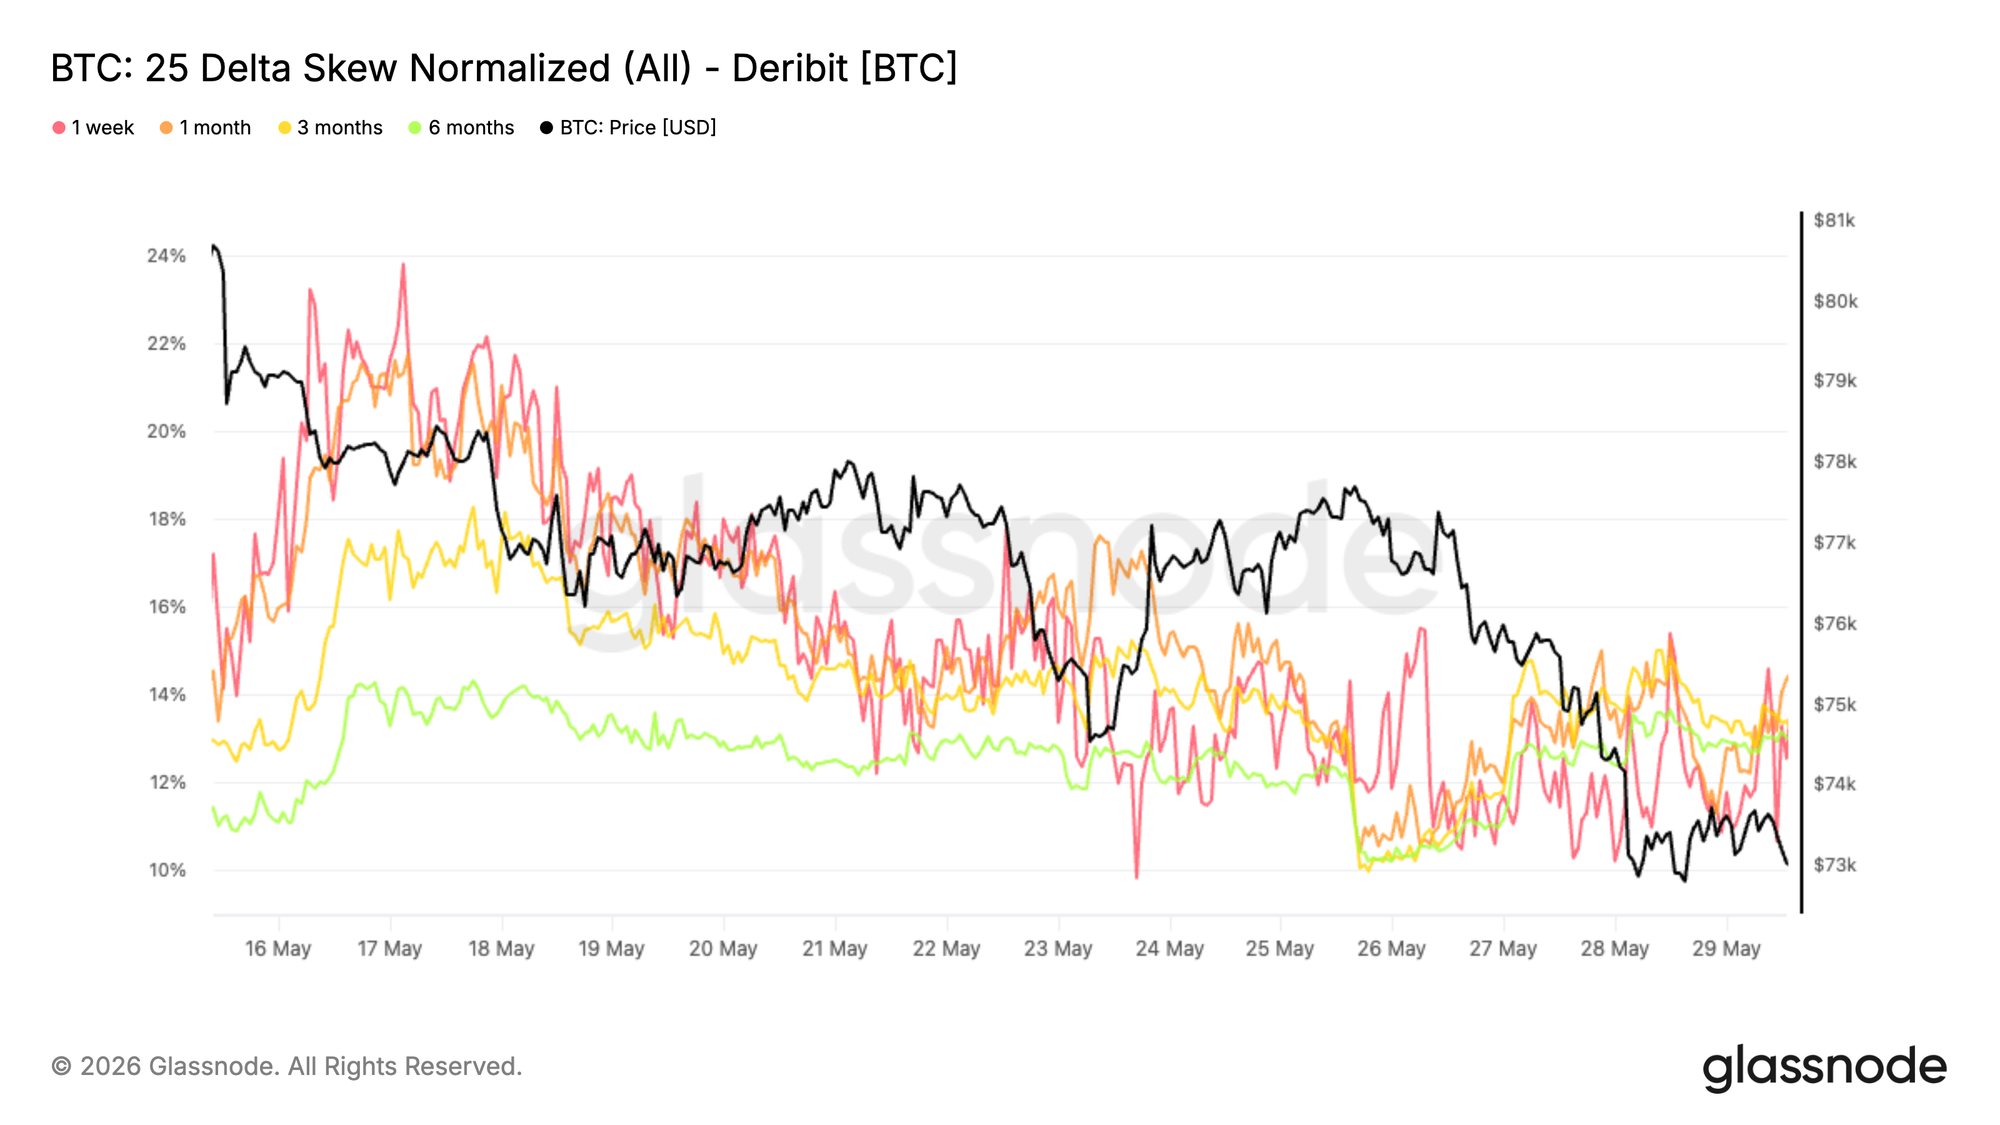
После расширения премии за волатильность скос (skew) показывает, где трейдеры продолжают концентрировать этот спрос на опционы. Несмотря на недавний прорыв на споте, пут-опционы по всей кривой остаются стабильно дороже колл-опционов.
Поскольку этот скос рассчитывается как «пут минус колл», положительные значения по всем срокам указывают на то, что защита от падения продолжает пользоваться премией. Показатели для 1, 3 и 6 месяцев в настоящее время находятся в районе 13–14%, оставаясь устойчиво в области «путов», несмотря на более широкое снижение с максимумов середины мая.
Примечательно, что недавнее движение ниже поддержки не вызвало значительного расширения скоса. Вместо того чтобы агрессивно гнаться за дополнительной защитой, трейдеры, по-видимому, сохраняют существующее оборонительное позиционирование, поскольку риски снижения все больше отражаются в рыночных ценах.
Спрос на защиту остается структурно повышенным, но отсутствие резкого расширения скоса предполагает, что недавние распродажи не спровоцировали новую волну хеджирования от падения.
Кластеры гаммы формируются вокруг текущего спота
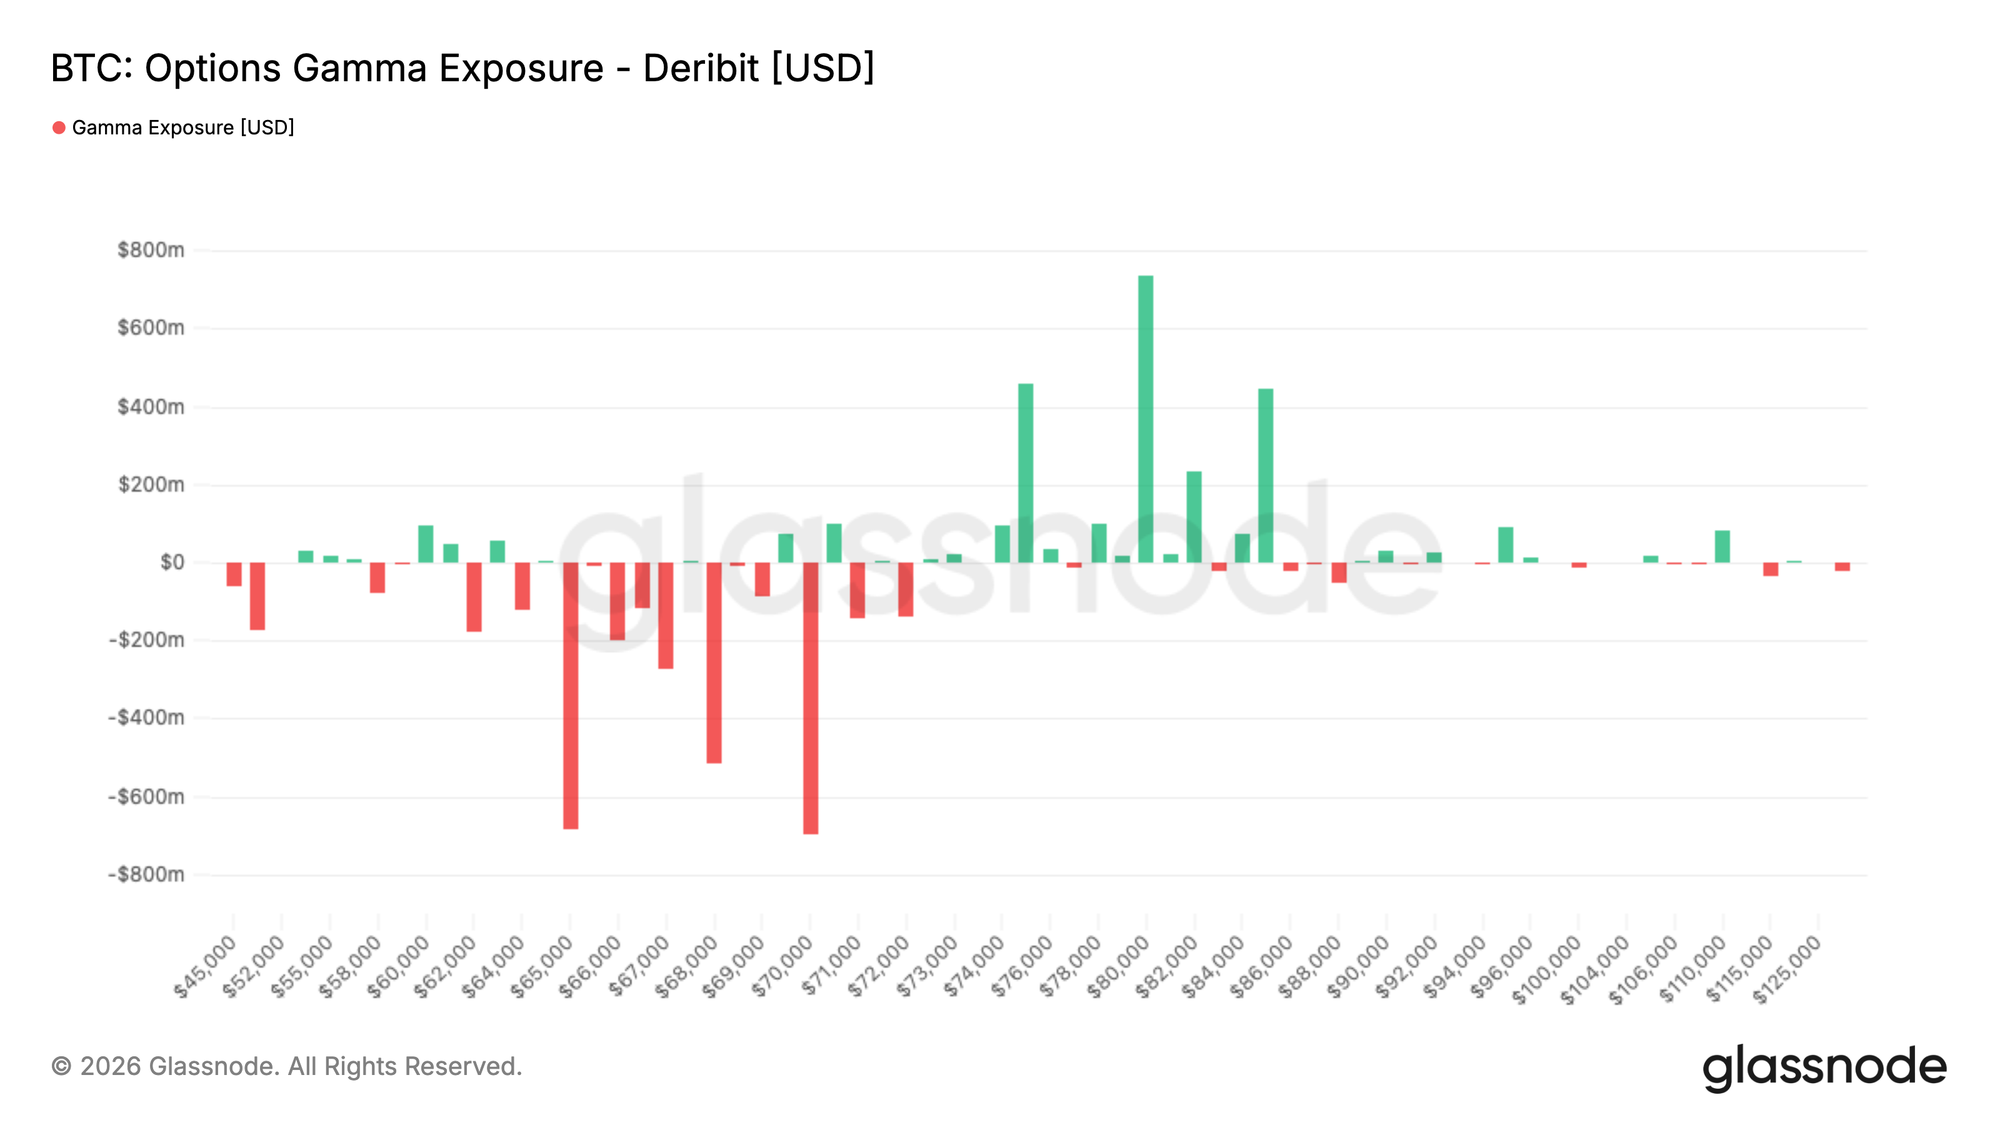
Сохраняющийся спрос на защиту от падения приводит к тому, что позиционирование дилеров остается сильно сконцентрированным вокруг текущих рыночных уровней. Самые большие кластеры отрицательной гаммы находятся вблизи 65 тыс. и 70 тыс. долларов, в то время как самая сильная положительная гамма сейчас недосягаема.
Поскольку биткоин в настоящее время торгуется около 66,7 тыс. долларов, спот находится прямо над крупнейшей зоной отрицательной гаммы. В этих областях хеджирование дилеров может усиливать краткосрочные движения цены, поскольку маркет-мейкеры вынуждены торговать по тренду.
Данные о потоках (flow data) помогают объяснить это позиционирование. За последние семь дней активность «тейкеров» (taker) носила оборонительный характер, при этом покупка путов составила наибольшую долю в торгуемой премии. Последние 24 часа показывают аналогичную картину, хотя покупка коллов увеличилась наряду с сохраняющимся спросом на путы, что позволяет предположить, что трейдеры остаются активными по обе стороны рынка.
Позиционирование в опционах остается сконцентрированным вокруг текущего спота, в то время как потоки «тейкеров» продолжают благоприятствовать спросу на защиту, усиливая осторожный тон на рынке опционов.
Заключение
Последнее снижение биткоина укрепило мнение о том, что рынок остается в хрупком положении, со слабостью, заметной в прибыльности, поведении инвесторов, позиционировании ETF и спотовом спросе. Отскок от совокупной себестоимости ETF на уровне около 83 тыс. долларов подчеркивает, что многие инвесторы остаются «запертыми» выше текущих цен, создавая источник предложения сверху, который продолжает сдерживать попытки восстановления.
В то же время реализованные убытки ускорились, долгосрочные держатели начинают распродавать в больших масштабах, а спотовый поток заявок твердо вернулся в пользу продавцов. Хотя недавнее событие ликвидации помогло очистить систему от левериджа, пока мало свидетельств того, что появился устойчивый спрос, чтобы поглотить образовавшееся предложение.
Рынки опционов отражают аналогичную картину. Трейдеры продолжают платить за защиту от падения и будущую волатильность, но без той степени паники, которая обычно ассоциируется с крупными днами капитуляции. Пока спотовый спрос не усилится, инвесторы ETF не вернутся в прибыль, а давление продаж не начнет ослабевать, рынок, вероятно, останется уязвимым для дальнейшего снижения и продолжения консолидации в рамках более широкой медвежьей рыночной структуры.
Отказ от ответственности: Данный отчет не предоставляет каких-либо инвестиционных рекомендаций. Все данные предоставляются исключительно в информационных и образовательных целях. Ни одно инвестиционное решение не должно основываться на информации, предоставленной здесь, и вы несете полную ответственность за свои собственные инвестиционные решения.
Балансы на биржах, представленные здесь, получены из комплексной базы данных Glassnode с метками адресов, которая собирается как из официально опубликованной информации бирж, так и с использованием проприетарных алгоритмов кластеризации. Хотя мы стремимся обеспечить максимальную точность в представлении биржевых балансов, важно отметить, что эти цифры не всегда могут охватывать весь объем резервов биржи, особенно когда биржи отказываются раскрывать свои официальные адреса. Мы призываем пользователей проявлять осторожность и осмотрительность при использовании этих метрик. Glassnode не несет ответственности за любые расхождения или возможные неточности.