Криптовалюты восстанавливаются, но индекс страха показывает, что трейдеры не убеждены
Криптовалютные рынки продемонстрировали широкое восстановление 25 февраля после резкого падения на предыдущей неделе. Bitcoin вырос примерно на 5,6%, достигнув $67 400, а Ethereum поднялся почти на 9,6%, вернувшись к уровням выше $1 950. Такие альткоины, как Solana, XRP и BNB, также показали рост от 6% до 11,5%.
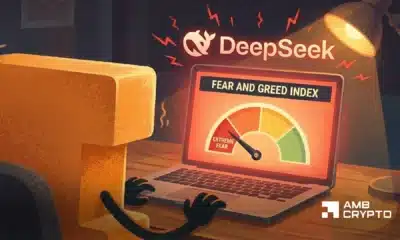
Однако, согласно индексу страха и жадности, который находится на отметке 11 («крайний страх»), настроения трейдеров остаются осторожными. Это указывает на сохраняющееся избегание риска, несмотря на краткосрочное восстановление цен.
Аналитики считают, что данный отскок был скорее вызван тактическими покупками на минимумах и закрытием коротких позиций, чем возобновлением уверенности быков. До тех пор, пока настроения не улучшатся, а цены не закрепятся выше ключевых уровней, восстановление может оставаться уязвимым для новой волатильности.
ambcrypto02/25 16:25