Solana: Краткосрочная боль, долгосрочная надежда? SOL сталкивается с испытанием ликвидацией
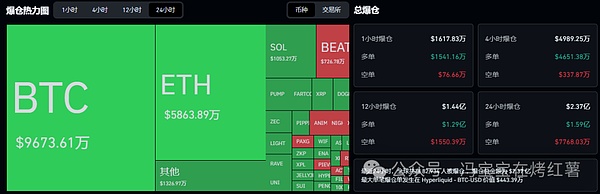
Падение цены Solana (SOL) до уровня $124,30 вызвало опасения у внутридневных трейдеров: почти $90 млн длинных позиций находятся под угрозой ликвидации. Несмотря на снижение рынка, объем торгов SOL вырос на 17%, достигнув $3,55 млрд, что свидетельствует о высоком интересе к текущему тренду.
На деривативных рынках преобладает медвежье настроение: трейдеры ожидают, что цена не преодолеет уровень $129,5. Однако инвесторы продолжают накапливать SOL: с бирж выведено более $8,77 млн, что может ограничить дальнейшее падение. Также с начала декабря наблюются стабильные поступления в американские биржевые фонды (ETF) Solana, что указывает на растущий спрос со стороны институциональных инвесторов.
Технический анализ показывает, что SOL находится на ключевом уровне поддержки $117. При пробитии текущего диапазона консолидации ($123,50–$128,23) возможен резкий спад до $117. Для роста необходимо закрепление выше $128,23. Краткосрочные риски сохраняются, но долгосрочные перспективы остаются оптимистичными благодаря активному накоплению.
ambcrypto12/23 22:05


![Ethena [ENA] под давлением – Заставят ли продавцы совершить последнее падение до $0,1315?](https://d1x7dwosqaosdj.cloudfront.net/images/2025-12/fd4b71d1cb7c4d6c897e0c41c0b55448.jpg)