# Сопутствующие статьи по теме Market Rally

Новостной центр HTX предлагает последние статьи и углубленный анализ по "Market Rally", охватывающие рыночные тренды, новости проектов, развитие технологий и политику регулирования в криптоиндустрии.
Soaring Over Tenfold Within the Year: The Frenzy Over SK Hynix Leveraged Products

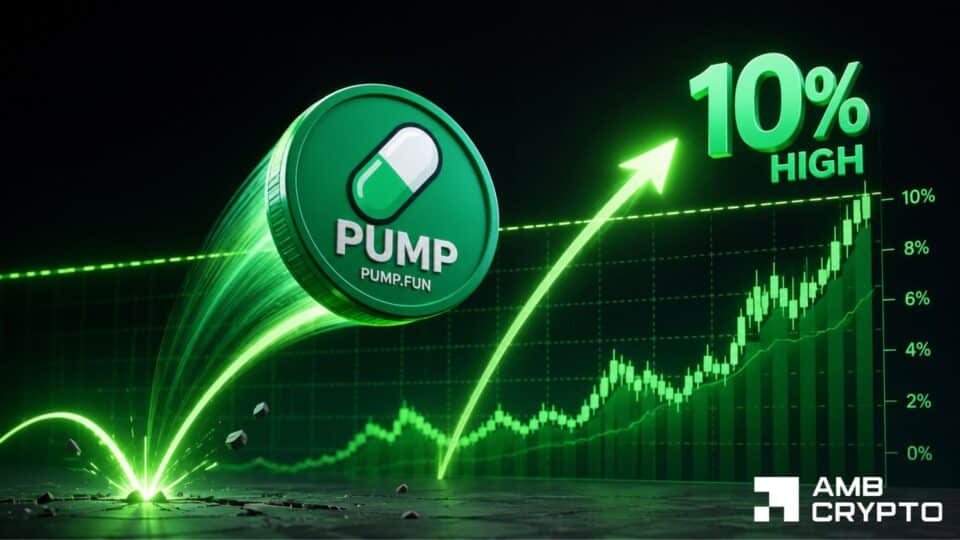
South China Morning Post The leveraged ETF tracking SK Hynix has surged over tenfold year-to-date, fueled by intense market speculation on the memory chip sector. By June 22, the value of the 'South Korea 2x Long SK Hynix ETF' listed in Hong Kong had skyrocketed by more than 1,061% since the start of the year, while its asset size exploded over twenty times from the end of last year. The rally is driven by AI-driven demand for high-bandwidth memory (HBM), with SK Hynix recently sampling its next-generation HBM4E product. However, industry professionals warn of significant risks. Leveraged ETFs magnify both gains and losses. During a recent market correction, while the underlying SK Hynix stock fell 19.1%, its double-leveraged ETF dropped nearly 38%. Korean regulators noted that such products could theoretically lose 60% in a single day. Additionally, these ETFs face risks like time decay in volatile markets, liquidity spirals during mass redemptions, and extreme price dislocations from market-making failures, as seen in early June when an ETF moved opposite to its underlying stock. The trading is predominantly driven by retail investors, with institutional capital largely absent due to the products' high volatility. Analysts caution that with the semiconductor sector at elevated valuations and facing geopolitical and supply chain uncertainties, leveraged ETFs pose a substantial threat of amplified losses for uninformed investors.

marsbit06/23 02:04

Soaring Over Tenfold Within the Year: The Frenzy Over SK Hynix Leveraged Products

marsbit06/23 02:04

U.S.-Iran Ceasefire: How Much of a Bitcoin Rally Can a Truce Agreement Support?

Headline: "U.S.-Iran Truce: How Much Can a Ceasefire Agreement Propel Bitcoin's Rebound?" On June 15th, Bitcoin rebounded to around $67,255, marking its first return to the $67,000 level since falling below $60,000 earlier in June. Ethereum and Solana also saw significant gains. The immediate driver for this market-wide recovery in crypto and global risk assets was the signing of a U.S.-Iran ceasefire memorandum, with a formal ceremony scheduled for June 19th. The agreement, which includes reopening the Strait of Hormuz, caused oil prices to plunge roughly 5%, easing inflation expectations and boosting prospects for Federal Reserve rate cuts. This macroeconomic shift fueled a rally in U.S. equities, with the Dow Jones hitting a record high. SpaceX's spectacular post-IPO performance further energized market sentiment. However, on-chain and derivatives data from Glassnode suggest this move is more indicative of a technical rebound from deeply oversold conditions rather than a confirmed trend reversal. The crypto market is undergoing noticeable capital rotation. While Bitcoin ETFs recently saw their worst outflows on record, the bleeding has slowed significantly. Meanwhile, new altcoin ETFs for assets like XRP and Solana are attracting substantial inflows, causing Bitcoin's market dominance to drop to 58%. Despite the rebound, the Crypto Fear & Greed Index remains in "Extreme Fear" territory at 22. The price quickly retreated after touching the $67,000 resistance level, indicating selling pressure persists. Analysis shows short-term speculative supply has been heavily washed out, with holder structure shifting toward a more long-term profile. While panic is subsiding and some on-chain metrics point to accumulation at lower prices, the market currently lacks the strong, sustained institutional buying needed to establish a new bullish trend.

Foresight News06/16 03:16

U.S.-Iran Ceasefire: How Much of a Bitcoin Rally Can a Truce Agreement Support?

Foresight News06/16 03:16

UBS: The Crowdedness of A-Share Tech Stocks Is Far From Reaching Historical Peaks

UBS: A-share tech stocks still far from peak crowding levels A-shares' technology sector has seen a strong rebound, with trading activity hitting record highs, raising concerns about market crowding. However, UBS Securities argues that a key indicator of institutional positioning suggests the current crowding level remains well below historical peaks. While the large-cap tech sector's share of total A-share trading volume and market capitalization have reached historical highs, the overweight ratio of domestic mutual funds in this sector stood at 9.9% in Q1 2026. This is down from 11.6% in Q3 2025 and significantly lower than the historical peak of 14.1% in Q4 2015. It also pales in comparison to the historical peak overweight of 18.7% for the consumer sector. UBS notes that typical cycles from a low to a peak in fund overweighting last about three years, and the current outperformance of the tech/growth style has lasted less than two years since the policy pivot in September 2024. UBS expects A-share earnings recovery to accelerate, providing fundamental support. It forecasts 2026 A-share profit growth to rise to 11% from 3.9% in 2025. Non-financial A-share profits grew 11.8% YoY in Q1 2026, with gross and net profit margins at their highest since 2023. Persistent fund inflows, the expansion of thematic ETFs, and a recovery in private fund issuance are supporting market liquidity. In tactical allocation, UBS favors growth and cyclical styles under its "slow bull" base case, with overweight ratings on six sectors: Electronics (benefiting from semiconductor inventory recovery and AI innovation), Communications (driven by AI computing demand), Machinery (aided by domestic capex recovery), Non-ferrous Metals (due to rising copper/aluminum prices), Chemicals (supported by anti-involution policies), and Electrical Equipment (driven by policy support and AI data center power demand).

marsbit06/05 02:48

UBS: The Crowdedness of A-Share Tech Stocks Is Far From Reaching Historical Peaks

marsbit06/05 02:48

活动图片