Оригинальное название: The Bond Market Is Flashing Red, The Next "Phase" Of The Iran War
Автор: The Kobeissi Letter
Компиляция: Peggy, BlockBeats
Примечание редактора: На фоне эскалации геополитических конфликтов фокус внимания рынка незаметно смещается. Изначально обсуждения концентрировались на нефтяном шоке и ситуации на Ближнем Востоке, но по мере того, как война переходит в тупиковую стадию, на поверхность начинает всплывать более системная переменная: сами финансовые условия ужесточаются.
Ключевой тезис, представленный в данной статье, заключается в том, что текущим рынком управляет уже не сама война, а разбалансировка рынка облигаций.
За последний месяц доходность 10-летних казначейских облигаций США быстро выросла, напрямую изменив ожидания по процентным ставкам — с «траектории снижения» к «повторному обсуждению повышения» — и оказав давление на рынки акций, товаров и даже на пространство для манёвров политики. В этом процессе продолжающееся ослабление рынка труда и вновь растущие инфляционные ожидания усиливают дилемму ФРС.
Что ещё более важно, автор помещает эти рыночные колебания в функцию реакции политики: когда доходность приближается к диапазону «разворота политики» в 4,50%–4,70%, вероятность государственного вмешательства значительно возрастает. Как историческая приостановка тарифов, так и недавние изменения в ритме «мирных переговоров» интерпретируются как конкретные проявления передачи давления с рынка облигаций на уровень политиков.
Это поднимает более глубокий вопрос: когда рынок облигаций начинает доминировать в ценообразовании активов и ритме политики, на какие сигналы должны ориентироваться участники рынка? На нарратив геополитики или на маргинальные изменения кривой доходности?
В этом структурном сдвиге статья пытается дать чёткий ответ — следите за рынком облигаций. Потому что он не только отражает риски, но и определяет их границы.
Далее оригинальный текст:
Поскольку мирные переговоры по иранской войне зашли в тупик, на американском рынке возникает насущный вопрос: рынок облигаций «даёт сбой». Среди сильной турбулентности на рынке облигаций мы считаем, что вероятность «вмешательства» быстро растёт. Что это значит? Объясним ниже.
Прежде чем начать, советуем сохранить эту статью, она станет справочным руководством по рыночной динамике на следующие несколько недель.
Когда иранская война началась 28 февраля (с убийства США и Израилем верховного лидера Ирана Хаменеи), цены на нефть изначально выросли менее чем на 15%. Тогда в США считали, что убийство Хаменеи быстро приведёт к смене режима в Иране и, таким образом, к относительно быстрому и малозатратному результату. Но сейчас, на 27-й день иранской войны, «15-пунктный мирный план», предложенный США, был отвергнут Ираном, и мирные переговоры явно зашли в тупик.
Уже невозможно определить, хочет ли какая-либо из сторон чётко положить конец этой войне. Поэтому цены на нефть остаются на высоком уровне, а цена нефти WTI вновь приближается к 100 долларам за баррель. Но это уже не самая большая проблема для рынка. Реальная проблема сместилась на рынок облигаций, и он быстро становится крупнейшим источником сопротивления для глобальной экономики.
Ключевая проблема
В начале войны фокус рынка был на нефти, и он остаётся таковым до сих пор. Причина проста: нефтяной рынок наиболее прямо и быстро отражает шок от войны.
Но теперь更大的 проблема заключается во внезапном скачке доходности казначейских облигаций США.
Как показано ниже, за 27 дней с начала иранской войны доходность 10-летних казначейских облигаций США выросла с примерно 3,92% до 4,42%, увеличившись в общей сложности на 50 базисных пунктов. Примечательно, что до начала войны фокус рыночных дискуссий заключался в том, сколько именно раз ставки будут снижены в 2026 году.
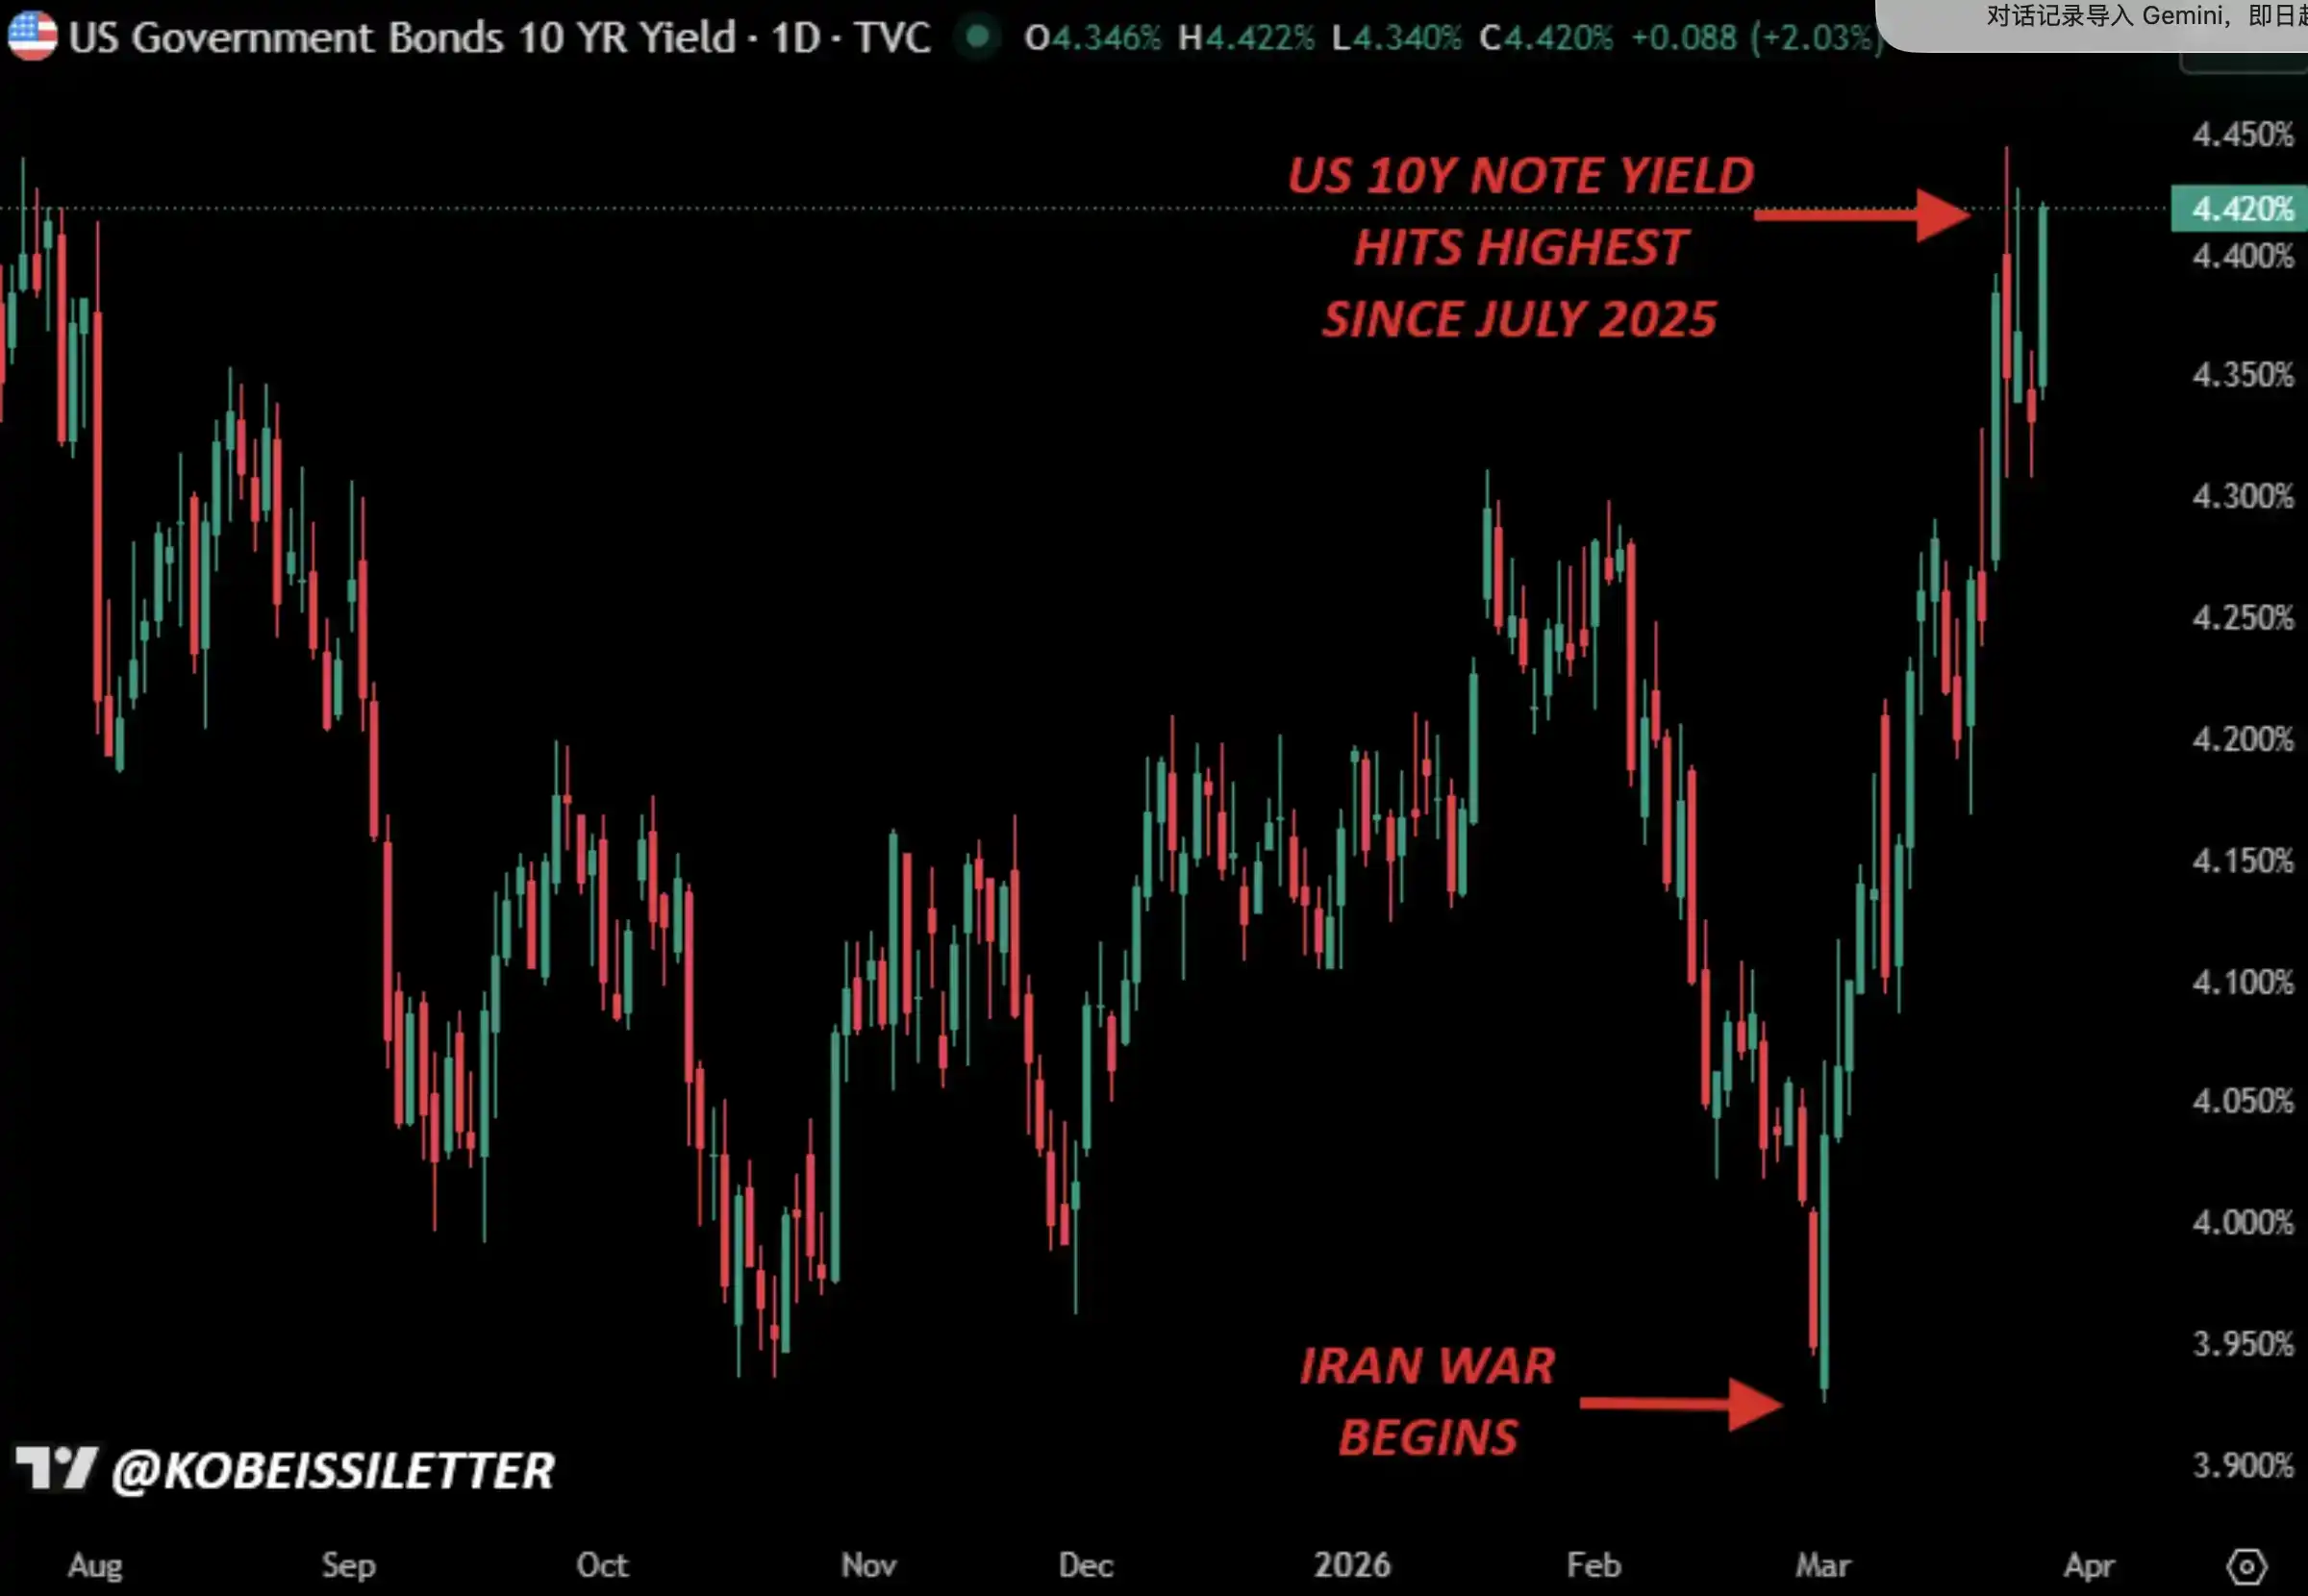
Доходность 10-летних казначейских облигаций США с начала иранской войны
Текущая скорость роста доходности 10-летних казначейских облигаций США, а также более широкий темп роста доходности гособлигаций в целом, примерно сопоставимы с показателями в период «Дня освобождения» (Liberation Day) в апреле 2025 года.
Но на этот раз фон значительно сложнее, и стабилизация рынка облигаций далеко не так проста, как кажется на поверхности. Это скоро станет ключевым нарративом рынка.
От ожиданий снижения ставок к давлению повышения
Чтобы лучше понять резкость этого сдвига, можно оглянуться на рыночные ожидания по ставкам в конце 2025 года.
Как показано ниже, тогда «базовым сценарием» рынка было: к 2026 году ставка ФРС (федеральные фонды) снизится до диапазона 2,75% – 3,00%. Более того, была вероятность свыше 25%, что ставки упадут ещё ниже.
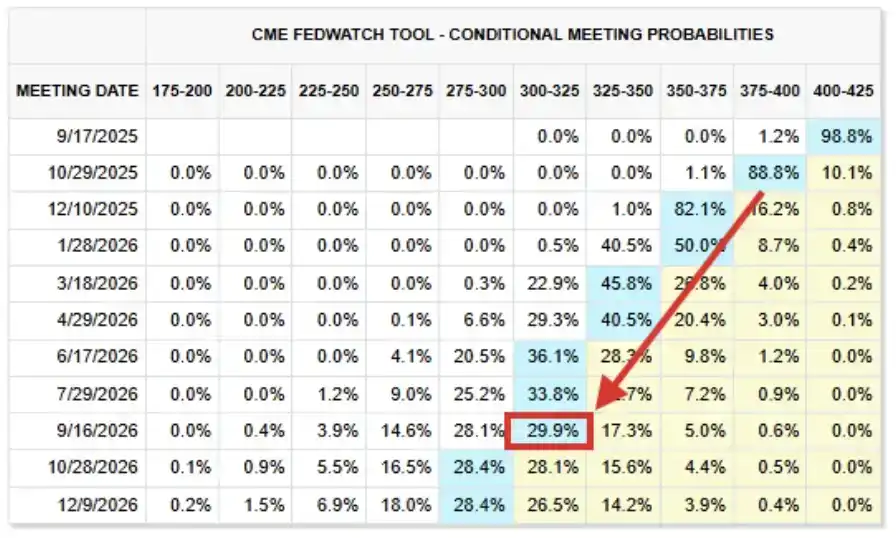
Ожидания по ставкам на 2026 год (скриншот сентября 2025)
Теперь посмотрим на текущие цены процентных фьючерсов. Текущий «базовый сценарий» показывает: ставки останутся в основном неизменными на текущих уровнях как минимум до сентября 2027 года, ожидается, что ставка ФРС по федеральным фондам будет в целевом диапазоне 3,50% – 3,75%.
Этот уровень на 75–100 базисных пунктов выше, чем ожидалось несколько месяцев назад, и это суждение распространяется уже на конец 2027 года.
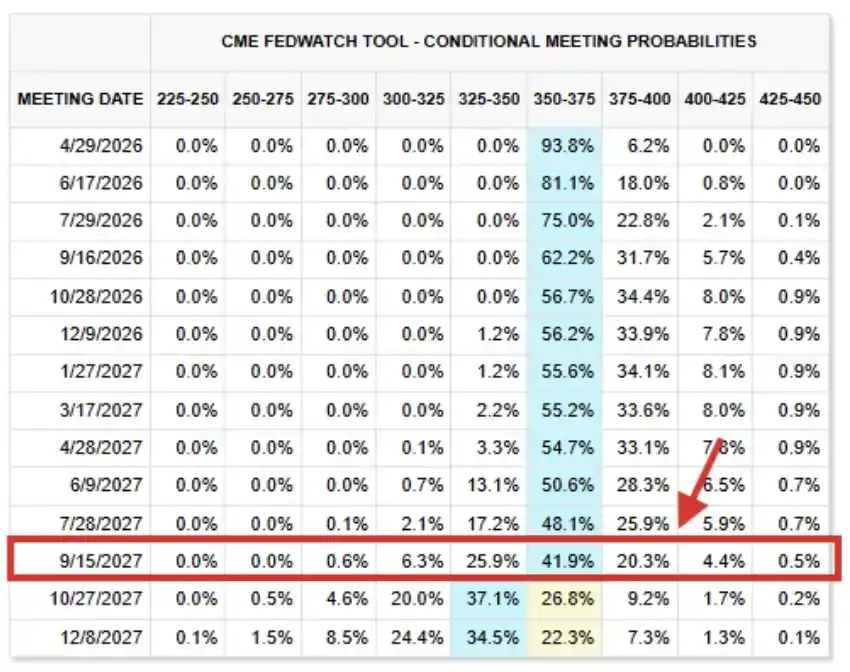
Ситуация с процентными фьючерсами по состоянию на 26 марта 2026 года
Фактически, рынок вновь начал обсуждать возможность «повышения ставок»: в настоящее время существует около 43% вероятности того, что ФРС повысит ставки до конца 2026 года. Объективно говоря, рынку будет трудно выдержать такой шок.
Далее мы объясним почему.
Ситуация на рынке труда только ухудшится
17 сентября 2025 года ФРС, как и ожидалось рынком, снизила ставки и намекнула на ещё два снижения до конца года. Тогда, хотя инфляция всё ещё была заметно выше долгосрочной цели ФРС в 2,00%, усиливалось беспокойство по поводу рынка труда США.
В послекризисном заявлении Комитет ФРС охарактеризовал экономическую активность как «несколько замедлившуюся», добавив, что «рост занятости снизился», и отметив, что инфляция «выросла и остаётся на относительно высоком уровне». Ослабление занятости и рост инфляции фактически одновременно отклонились от двойного мандата ФРС по «стабильности цен» и «полной занятости», но тогда проблема рынка труда была более突出.
А на сегодняшний день ситуация на рынке труда только ухудшилась. По сравнению с сентябрём 2025 года, способность рынка выдерживать более высокие ставки сейчас фактически слабее.
Реальность такова: во-первых, данные по занятости в США за 2025 год были значительно пересмотрены в сторону снижения на 1,029 миллиона рабочих мест, что стало крупнейшим годовым пересмотром в сторону понижения как минимум за 20 лет. Ранее данные по занятости за 2024 и 2023 годы также были пересмотрены вниз на 818 000 и 306 000 соответственно.
В совокупности за последние три года 2,153 миллиона рабочих мест «исчезли» из первоначально опубликованных данных в результате пересмотров. С 2019 года общее количество пересмотренных вниз рабочих мест достигло 2,5 миллиона, а за последние 7 лет в 6 из них наблюдались отрицательные пересмотры данных по занятости.
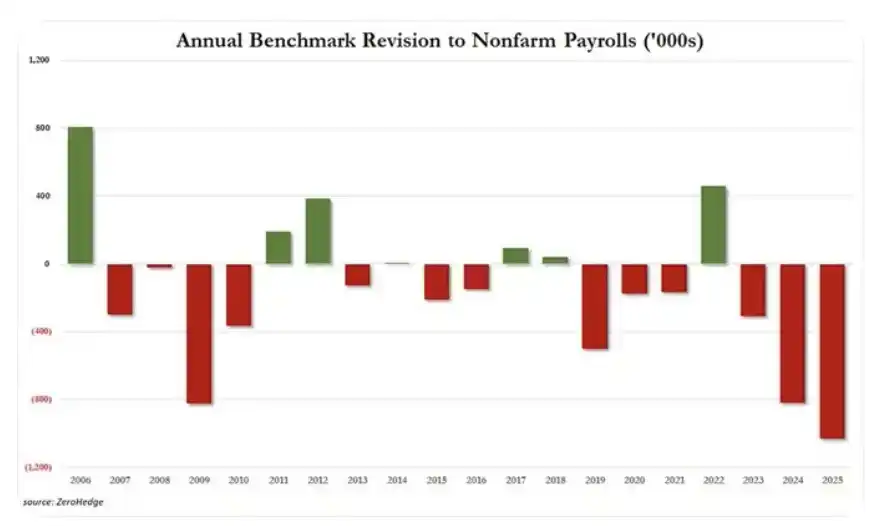
Годовые пересмотры данных по внесельскохозяйственной занятости (Nonfarm Payrolls)
Приведём ещё один пример, подобных случаев на самом деле много. Средняя продолжительность безработицы в США в феврале выросла на 2 недели, достигнув 25,7 недель, что стало 4-летним максимумом. С октября 2023 года продолжительность безработицы в совокупности увеличилась на 6,3 недели, что является самым быстрым темпом роста с 2020 по 2021 год. Сейчас этот уровень явно выше, чем в докандемический период 2018–2019 годов.
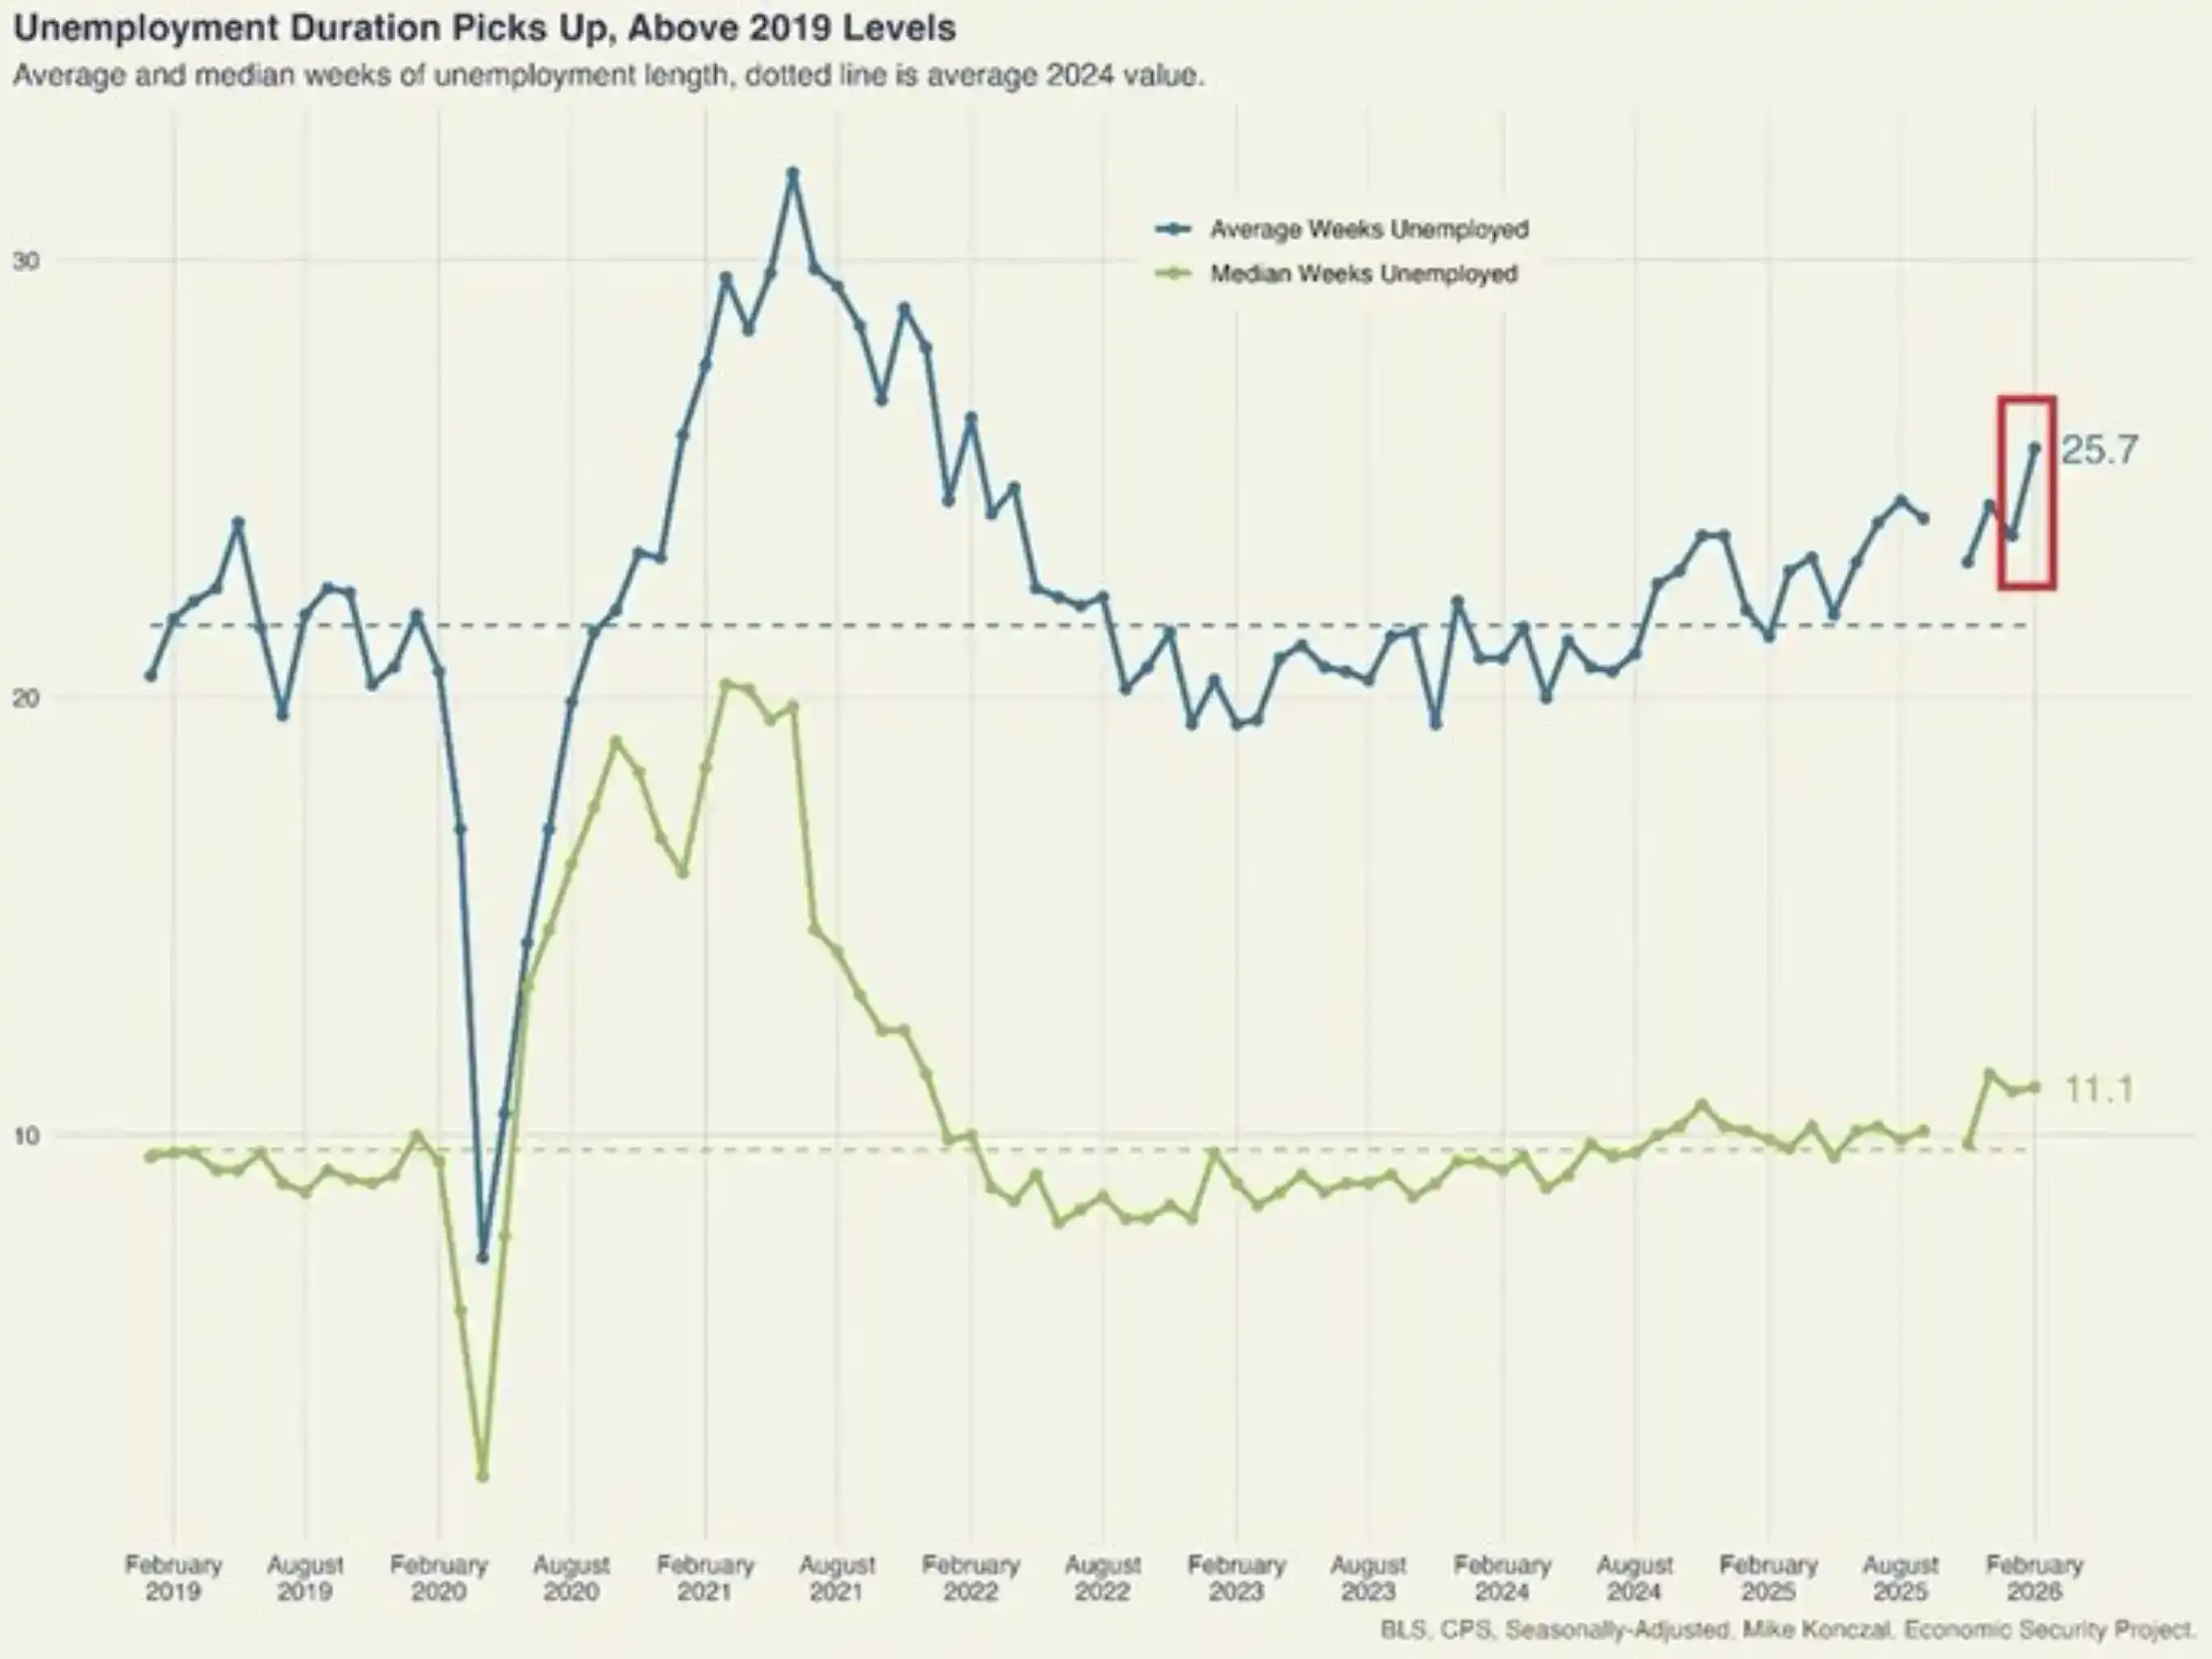
Резкий рост продолжительности безработицы в США
Ещё раз подчеркнём, что такие признаки не являются единичными, мы наблюдаем持续ющее и усиливающееся ослабление рынка труда.
По нашему мнению, экономика США не выдержит приближения доходности 10-летних казначейских облигаций к 4,50%, не говоря уже о росте выше 5,00%.
Почему это происходит?
На макроуровне скачок доходности казначейских облигаций США и разворот ожиданий по снижению ставок можно свести к одной ключевой переменной: инфляции.
«Двойной мандат» ФРС был установлен Конгрессом США в 1977 году и требует от центрального банка достижения двух основных целей с помощью денежно-кредитной политики: максимальная занятость и стабильность цен. Как упоминалось ранее, когда ФРС возобновила снижение ставок в 2025 году, Комитет по открытым рынкам (FOMC) считал, что слабость рынка труда была «более важной» проблемой по сравнению с всё ещё высокой инфляцией.
Но по мере роста цен на энергоносители, продолжения иранской войны и постоянного удлинения цикла восстановения энергетики после войны, инфляция вновь стала главным противоречием — не потому, что рынок труда улучшился, а потому, что сама инфляция стала более серьёзной.
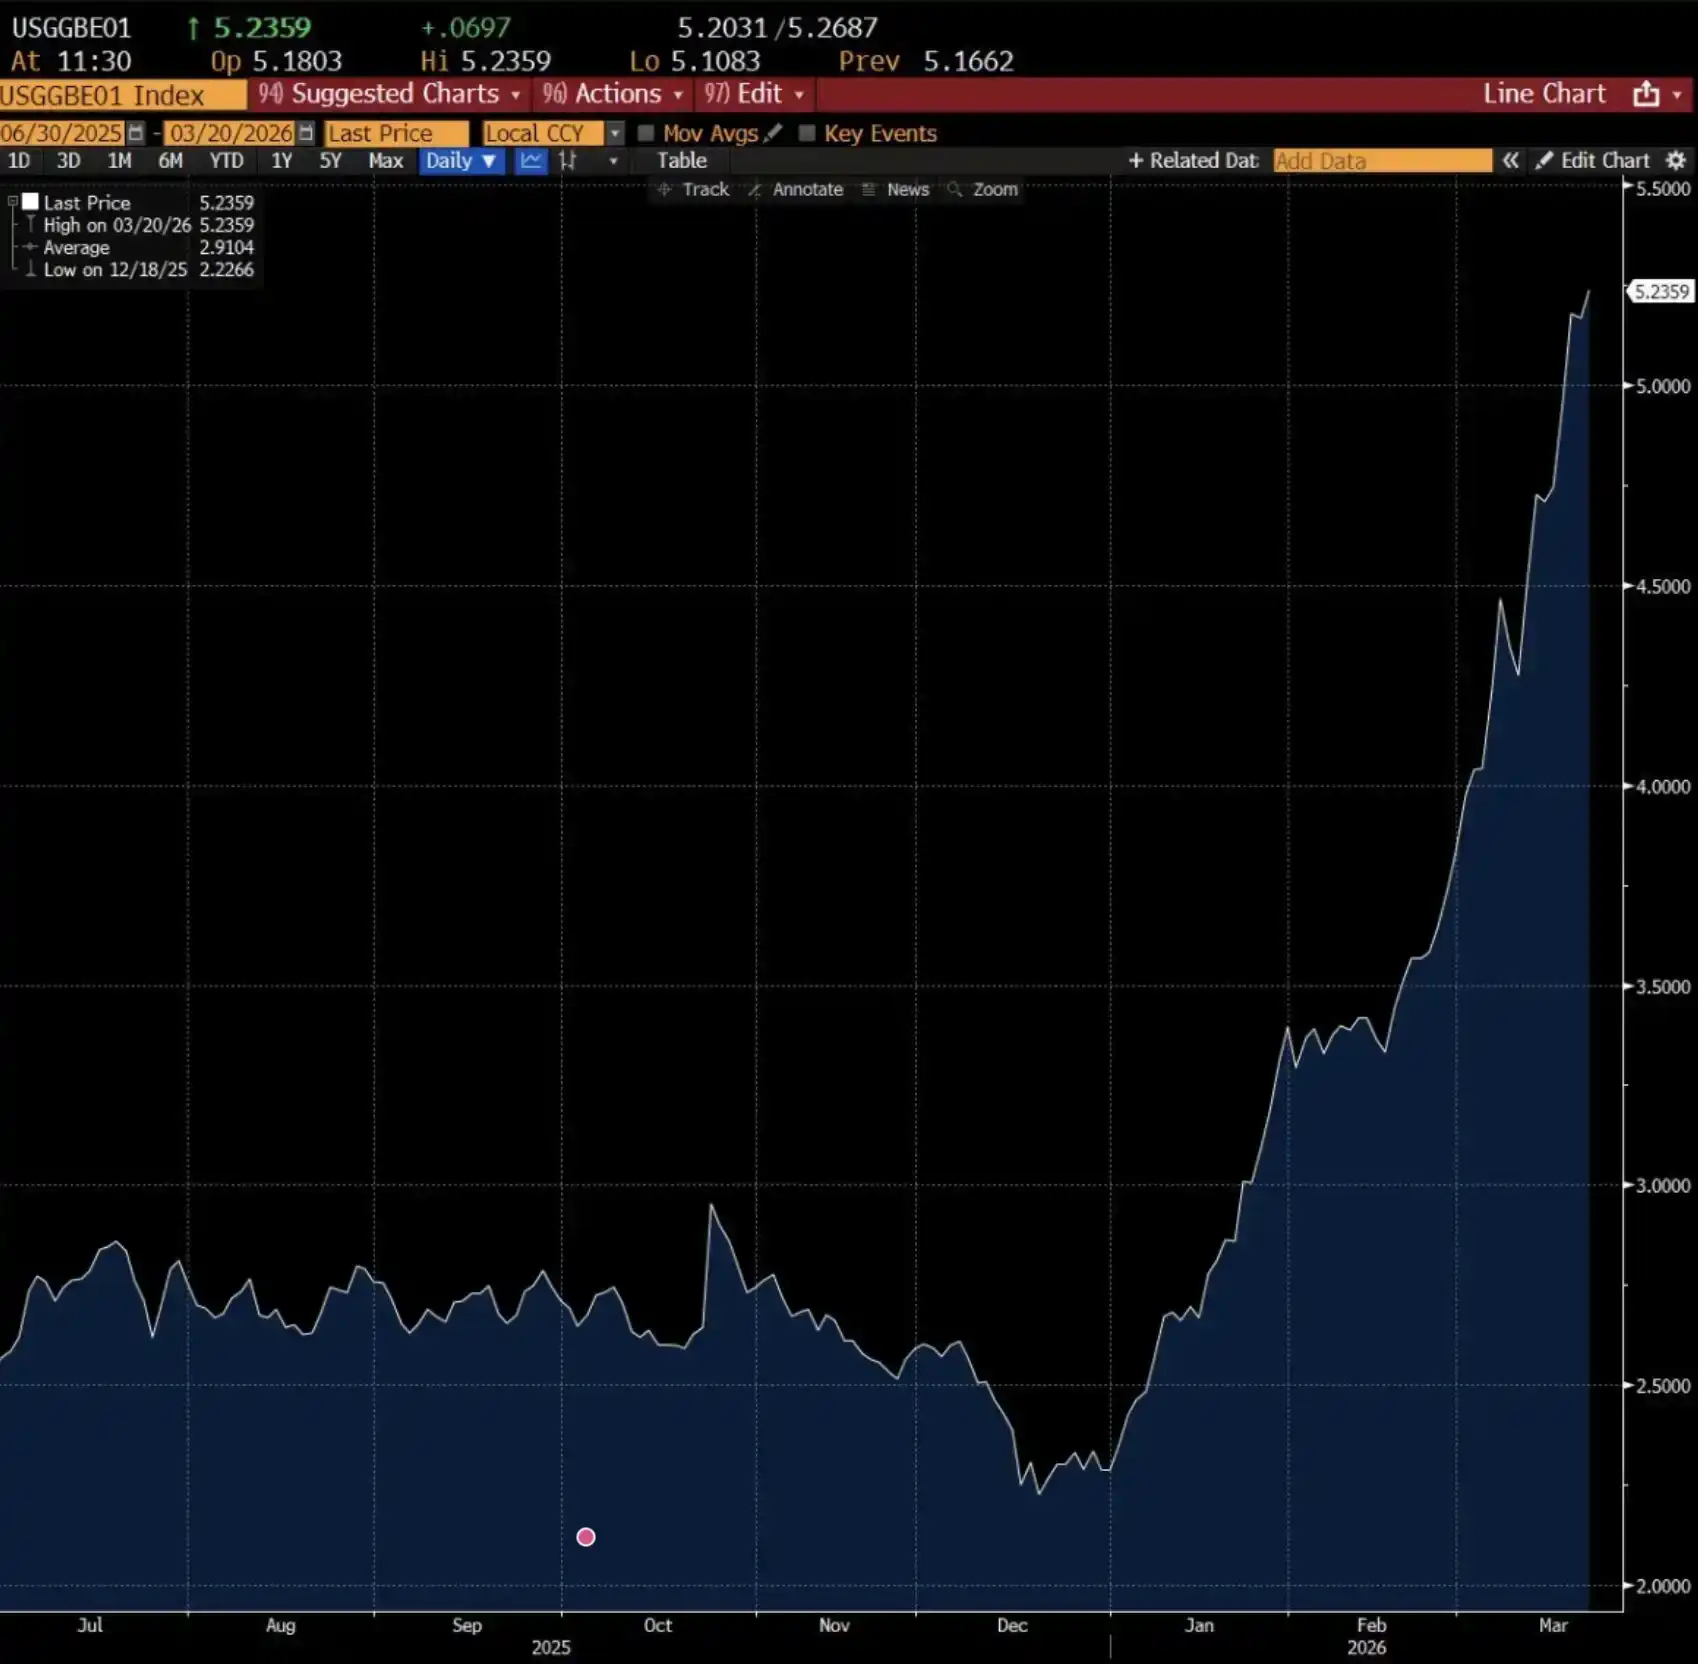
12-месячные инфляционные ожидания в США
Как показано выше, инфляционные ожидания в США на следующие 12 месяцев взлетели до 5,2%, достигнув самого высокого уровня с марта 2023 года. Примечательно, что разворот этих ожиданий начался в начале января и быстро ускорился по мере того, как президент Трамп угрожал Ирану, стягивал войска на Ближний Восток и вплоть до нанесения удара по Ирану 28 февраля.
Это возвращает нас к приведённому ниже графику инфляции CPI, рассчитанному на основе модели. Как мы неоднократно подчёркивали с начала войны, если цена на нефть в среднем будет оставаться на уровне 95 долларов за баррель в течение трёх месяцев, инфляция CPI в США вырастет до 3,2%.
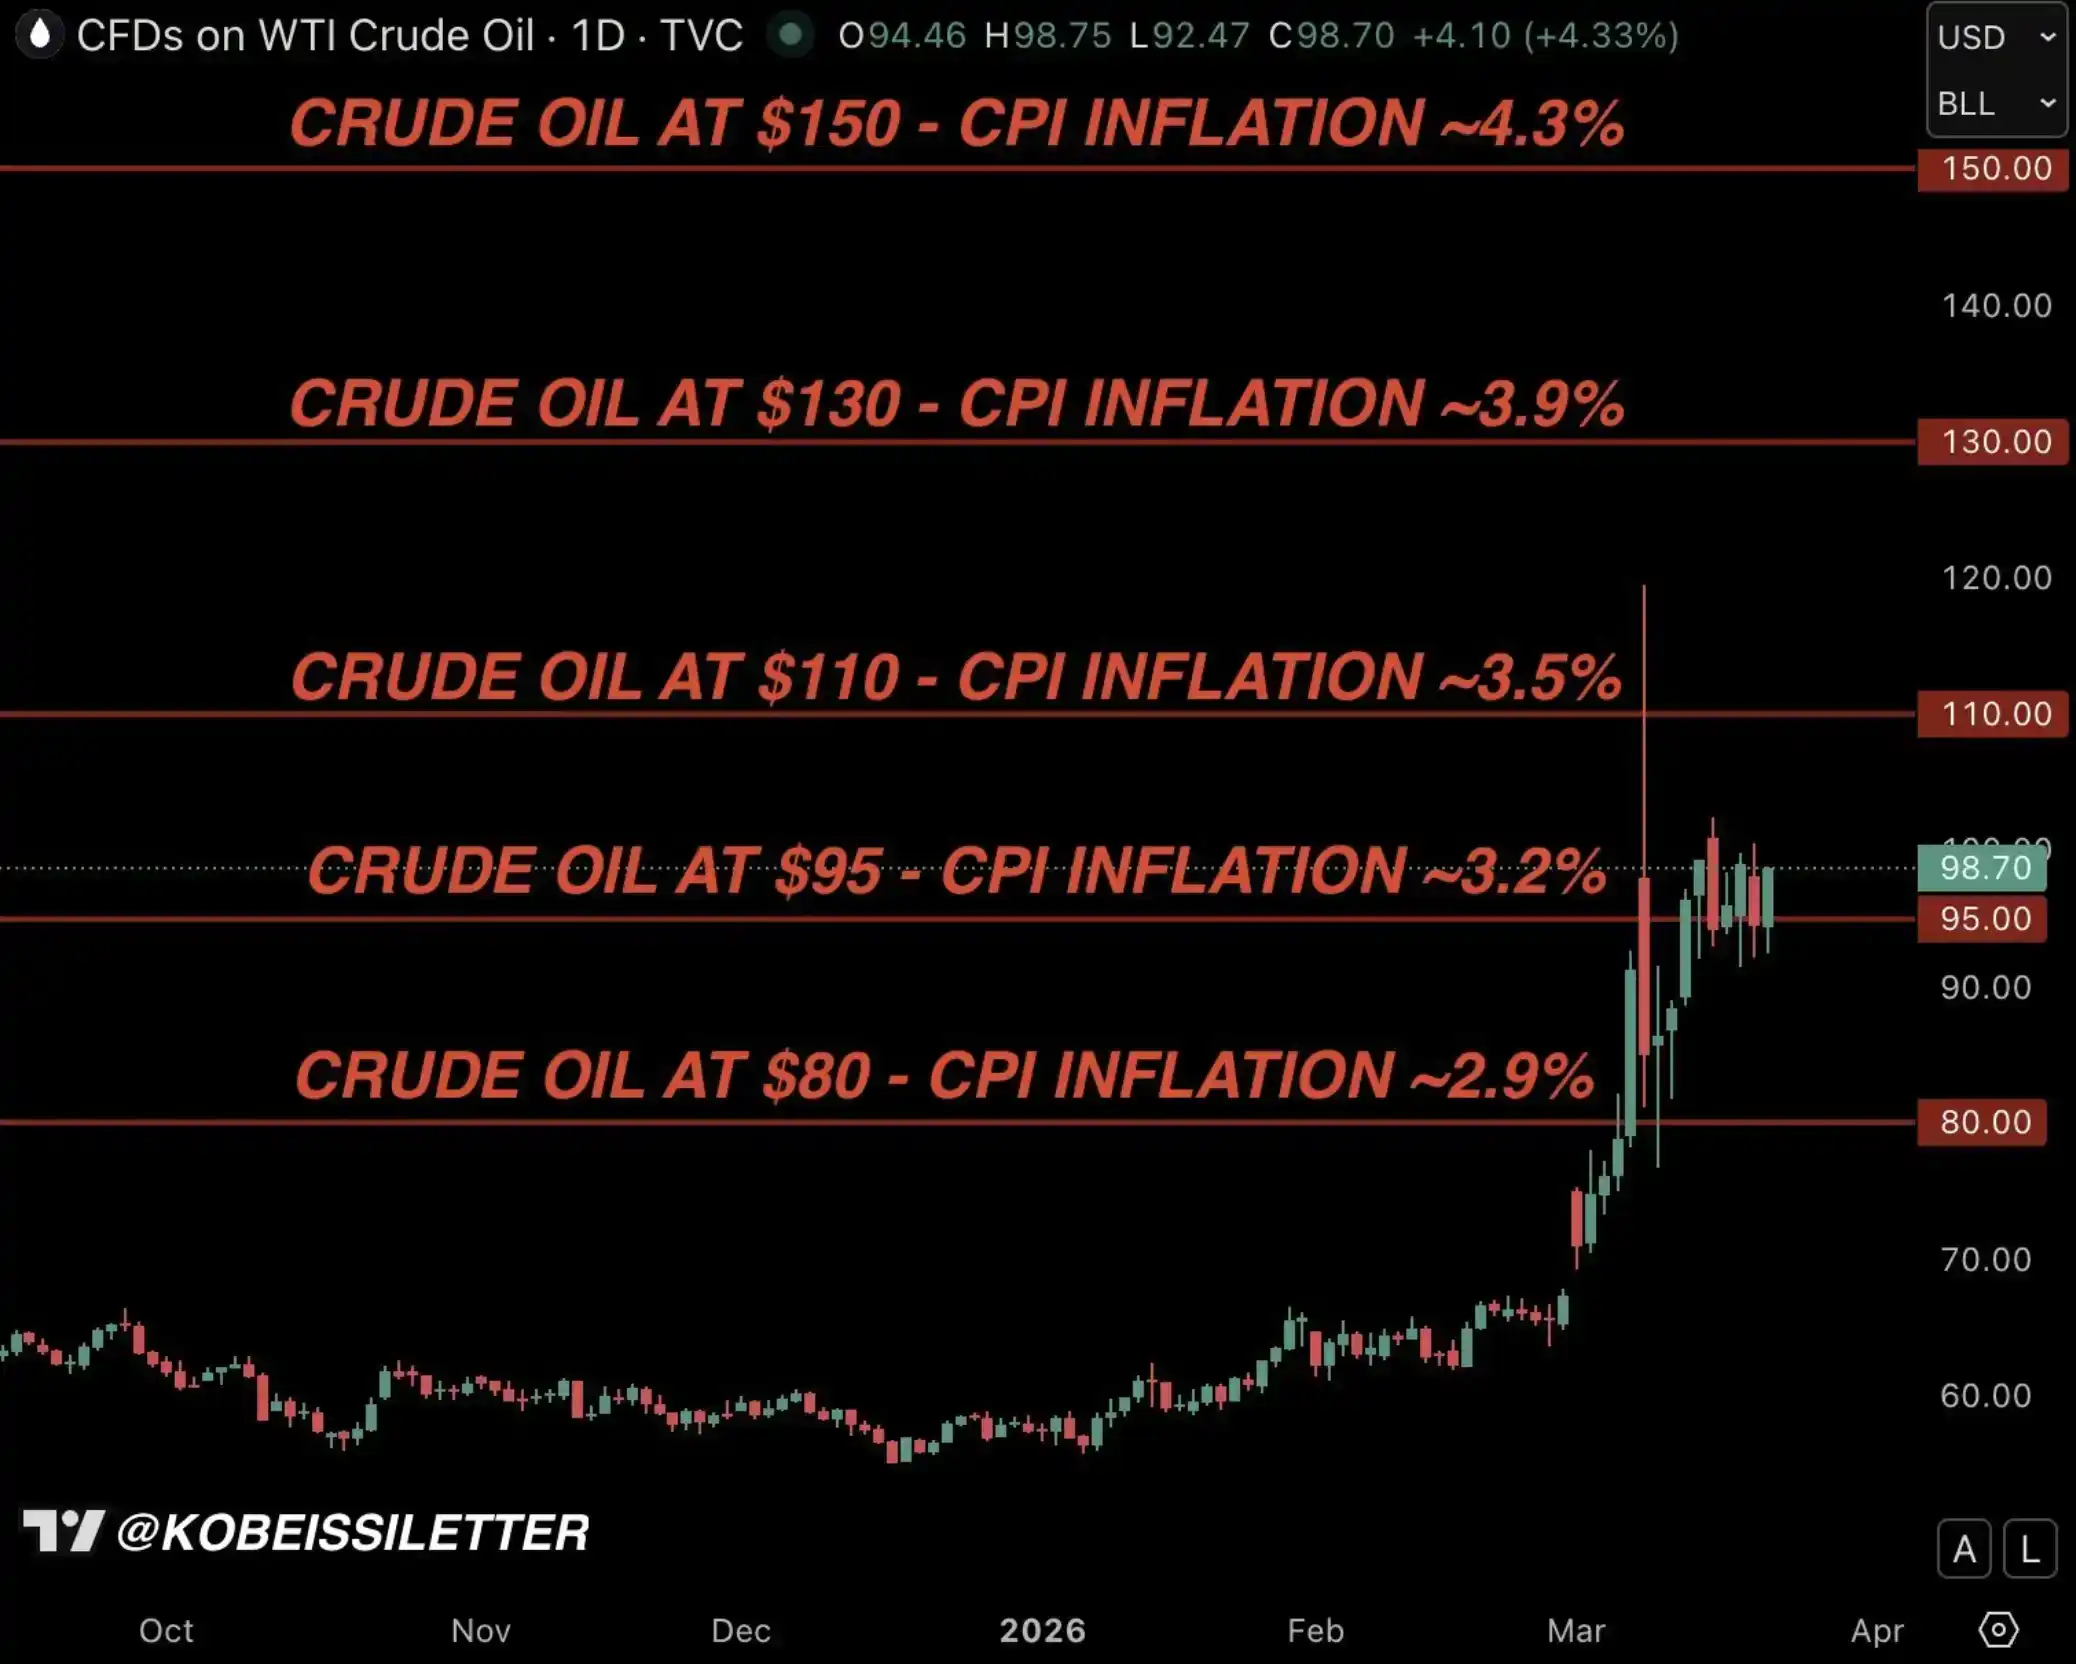
Kobeissi Letter: Модель цены на нефть и инфляции в США
Но реальность такова, что с учётом текущего каскадного эффекта рост инфляции, скорее всего, превысит 3,2%.
Мы считаем, что «вмешательство» уже не за горами
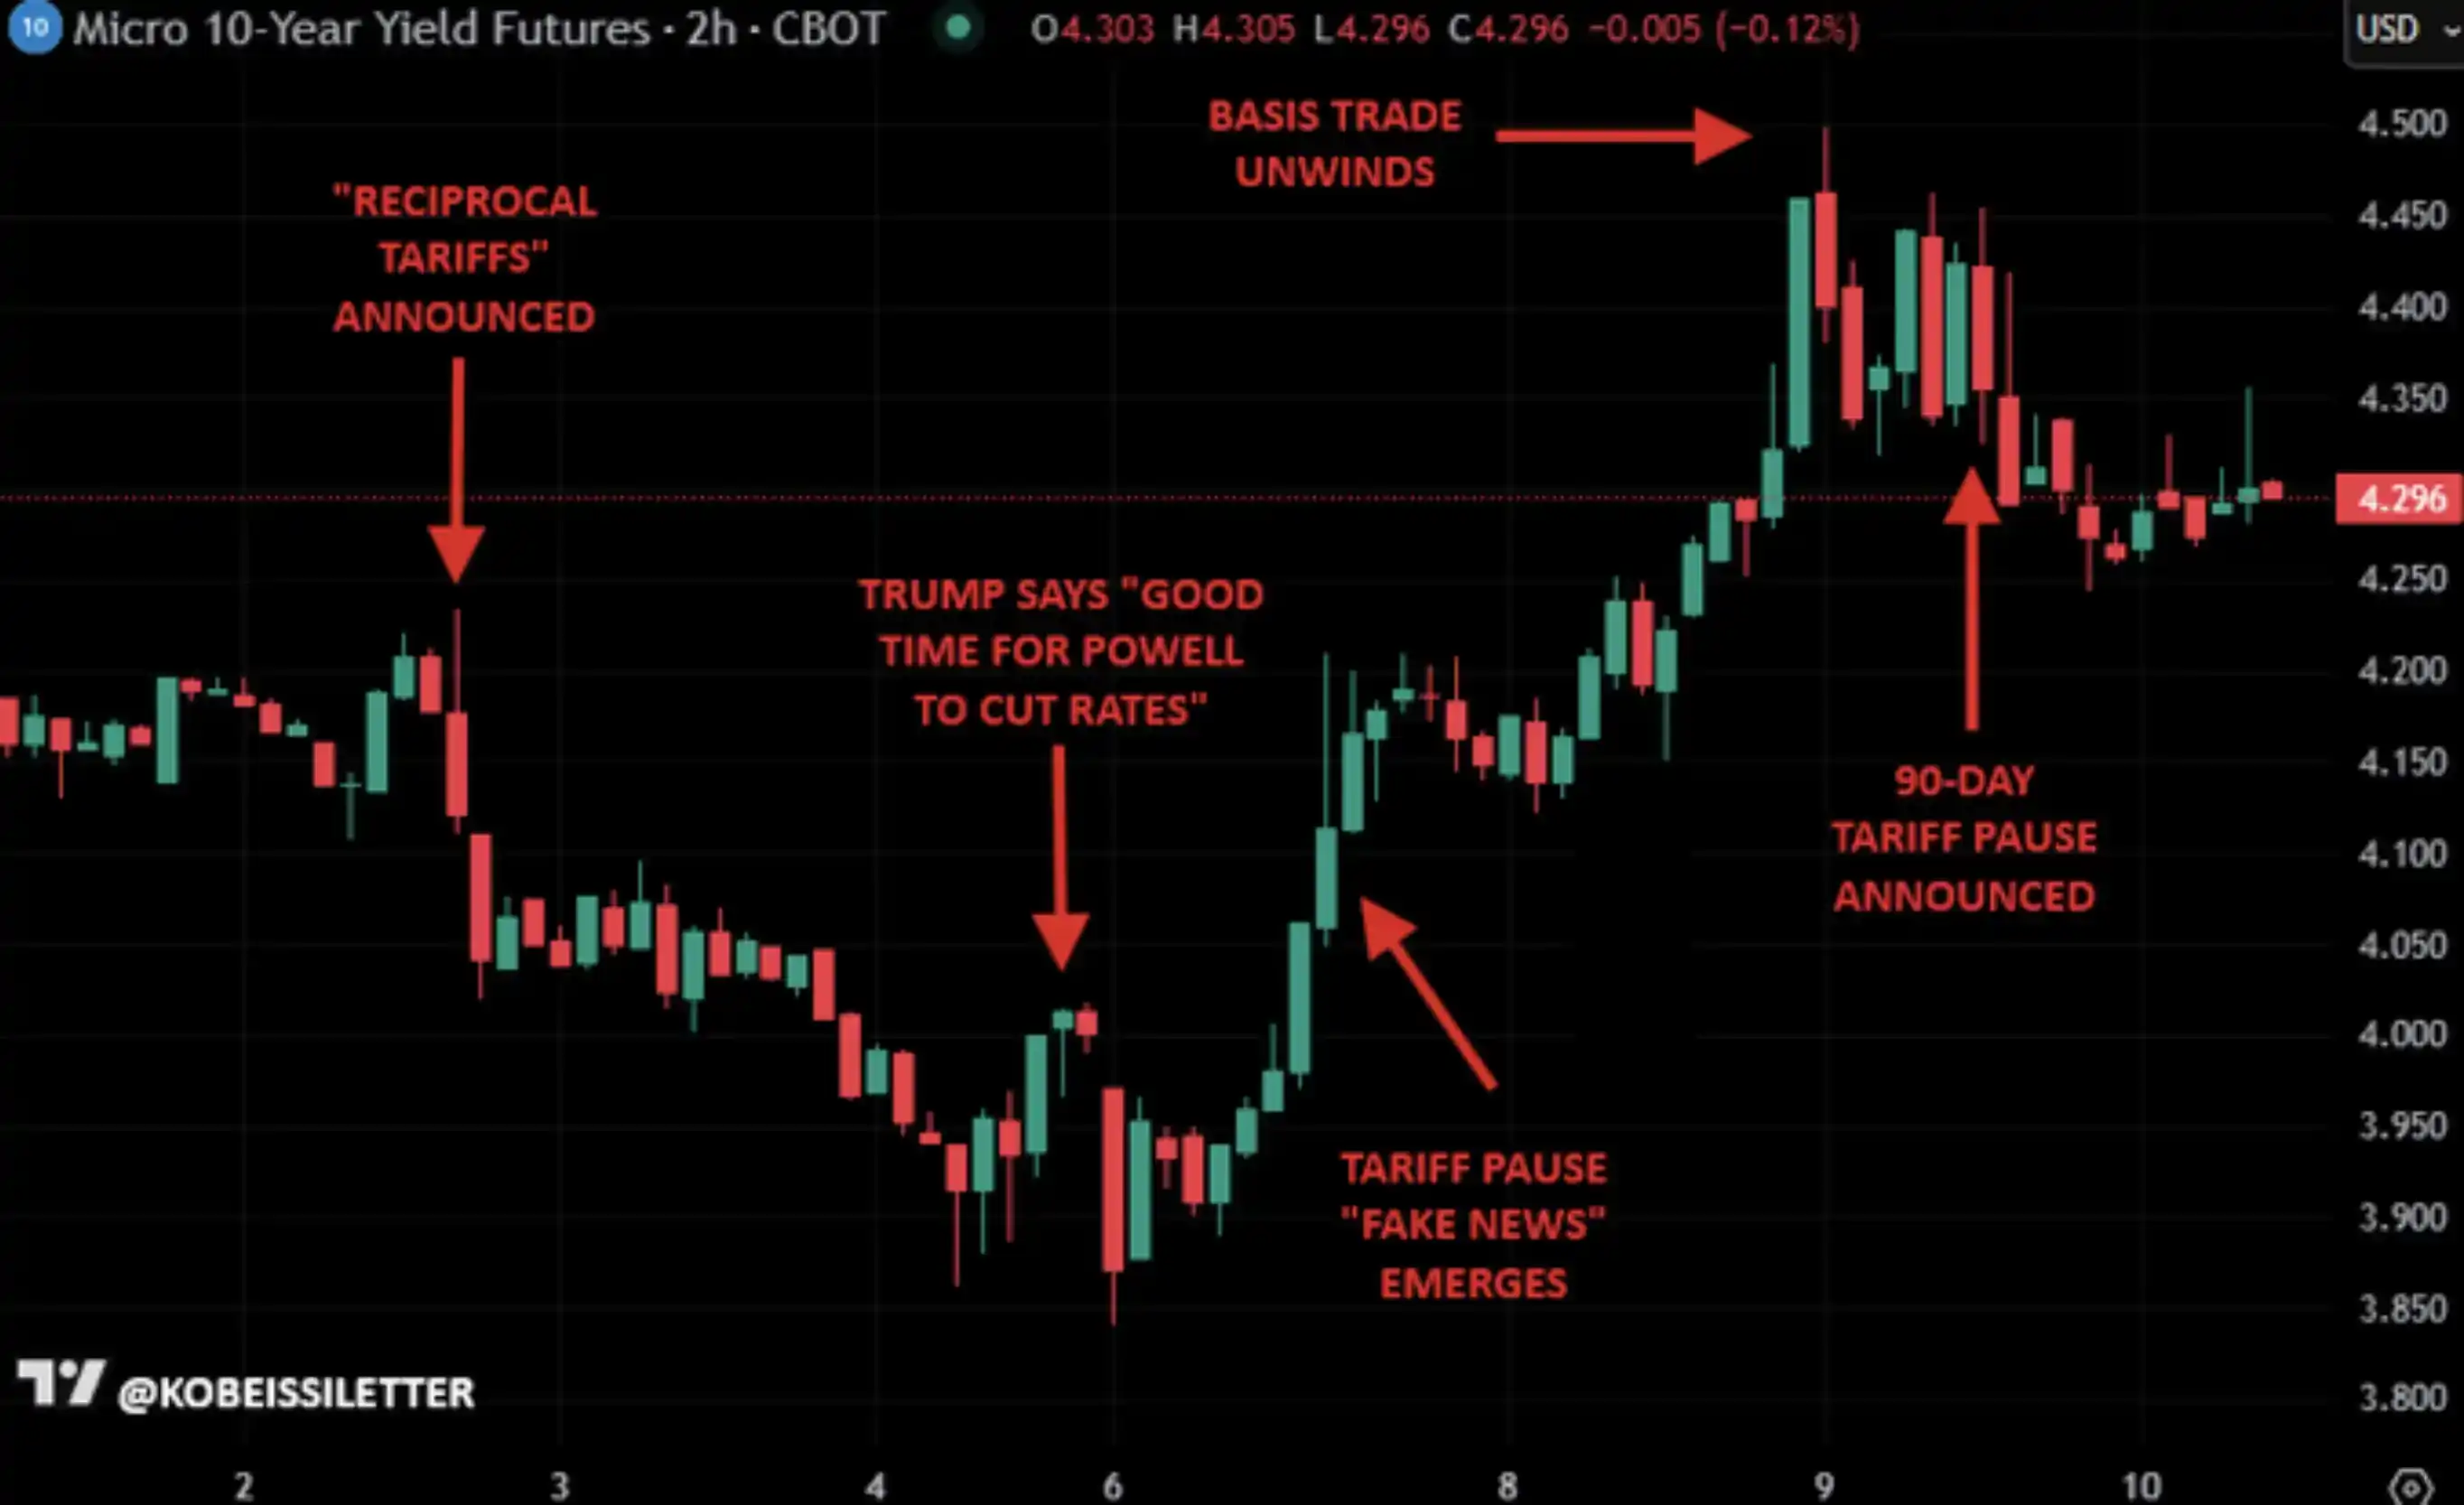
Во время сильной рыночной волатильности, вызванной торговой войной в начале 2025 года, был ключевой фактор, который в конечном итоге побудил президента Трампа объявить 9 апреля о приостановке тарифов на 90 дней — это был рынок облигаций.
На приведённом ниже графике мы проследили полную временную шкалу роста доходности казначейских облигаций США в период так называемого «Дня освобождения» (Liberation Day), и именно этот скачок доходности в конечном итоге привёл к развороту политики 9 апреля, что ослабило рыночное давление.
А в ходе прямого интервью 10 апреля Трамп также чётко заявил, что он внимательно следит за динамикой рынка облигаций.
Доходность 10-летних казначейских облигаций США в апреле 2025 года
Отсюда видно, что доходность 10-летних казначейских облигаций США в диапазоне 4,50% – 4,70%, скорее всего, составляет то, что мы называем «зоной разворота политики» (Policy Shift Zone) Трампа. Этот уровень немного выше текущего, и мы в целом согласны: как только доходность достигнет этого диапазона, для предотвращения серьёзного спада в экономике США политическое вмешательство станет необходимым.
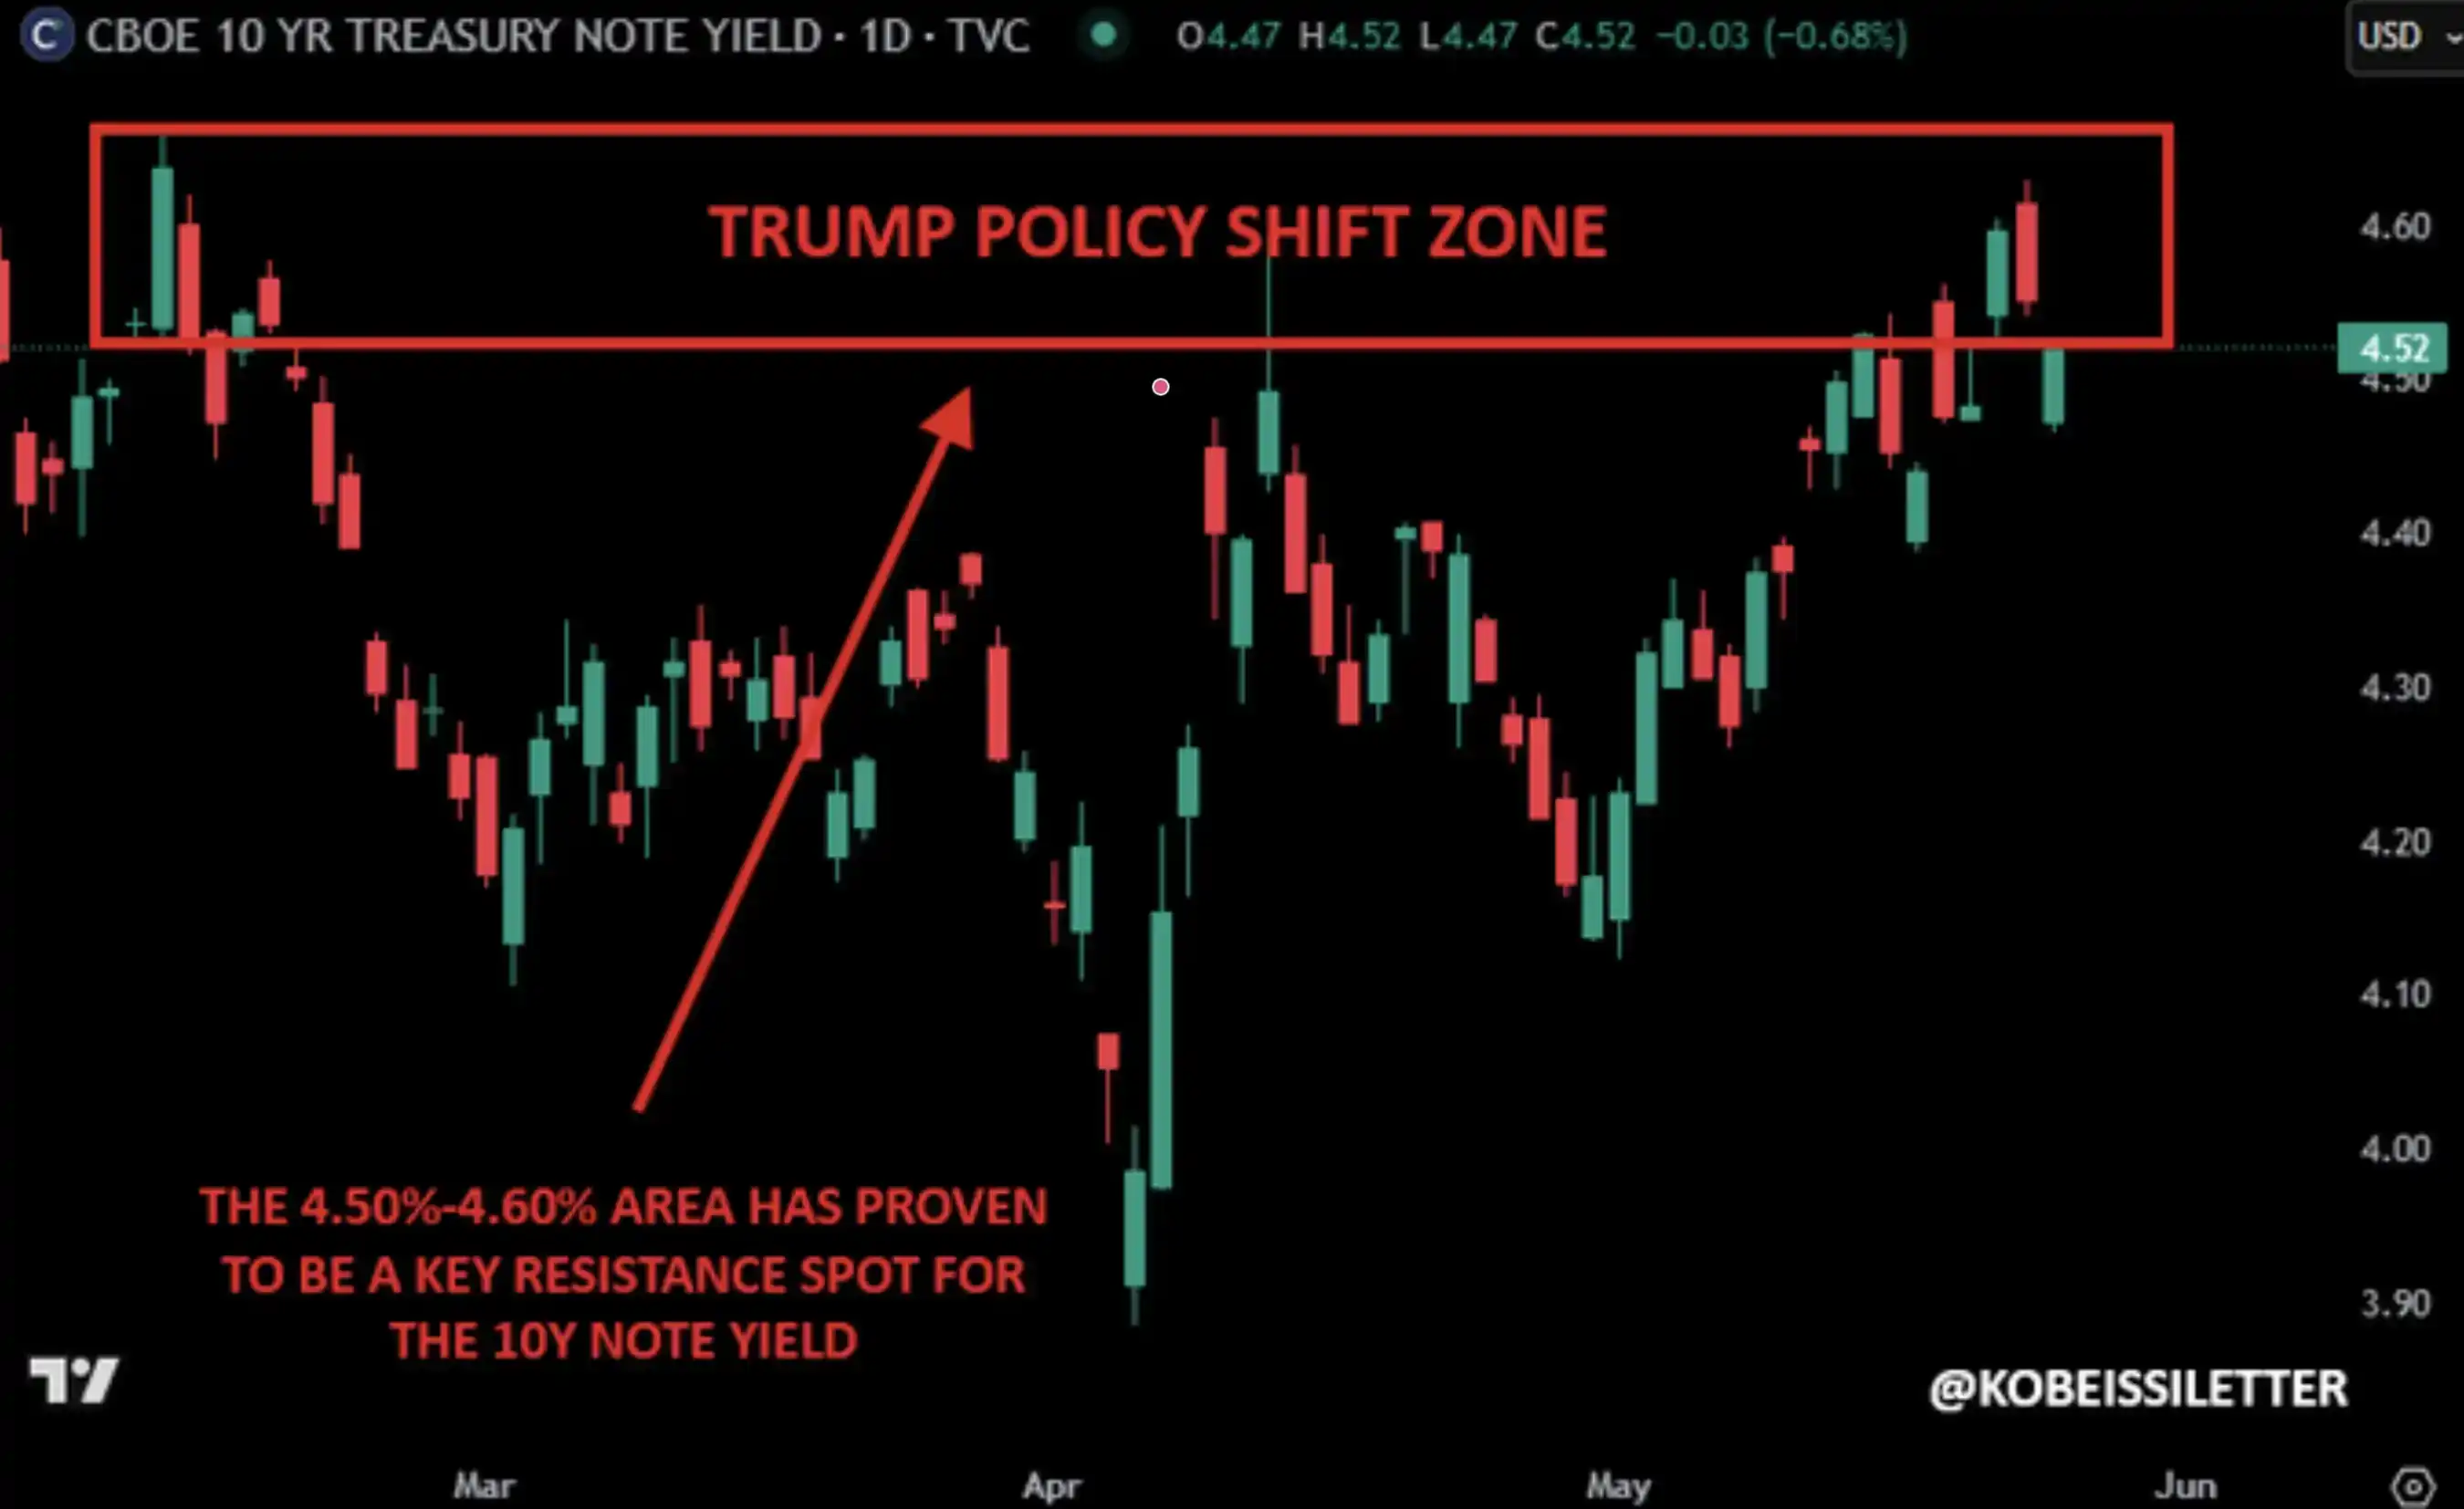
Доходность 10-летних казначейских облигаций США, «зона разворота политики» Трампа
По нашему мнению, на этот раз не будет исключений. Фактически, мы считаем, что объявление президентом Трампом о «мирных переговорах» 23 марта было не случайным, как показано ниже.
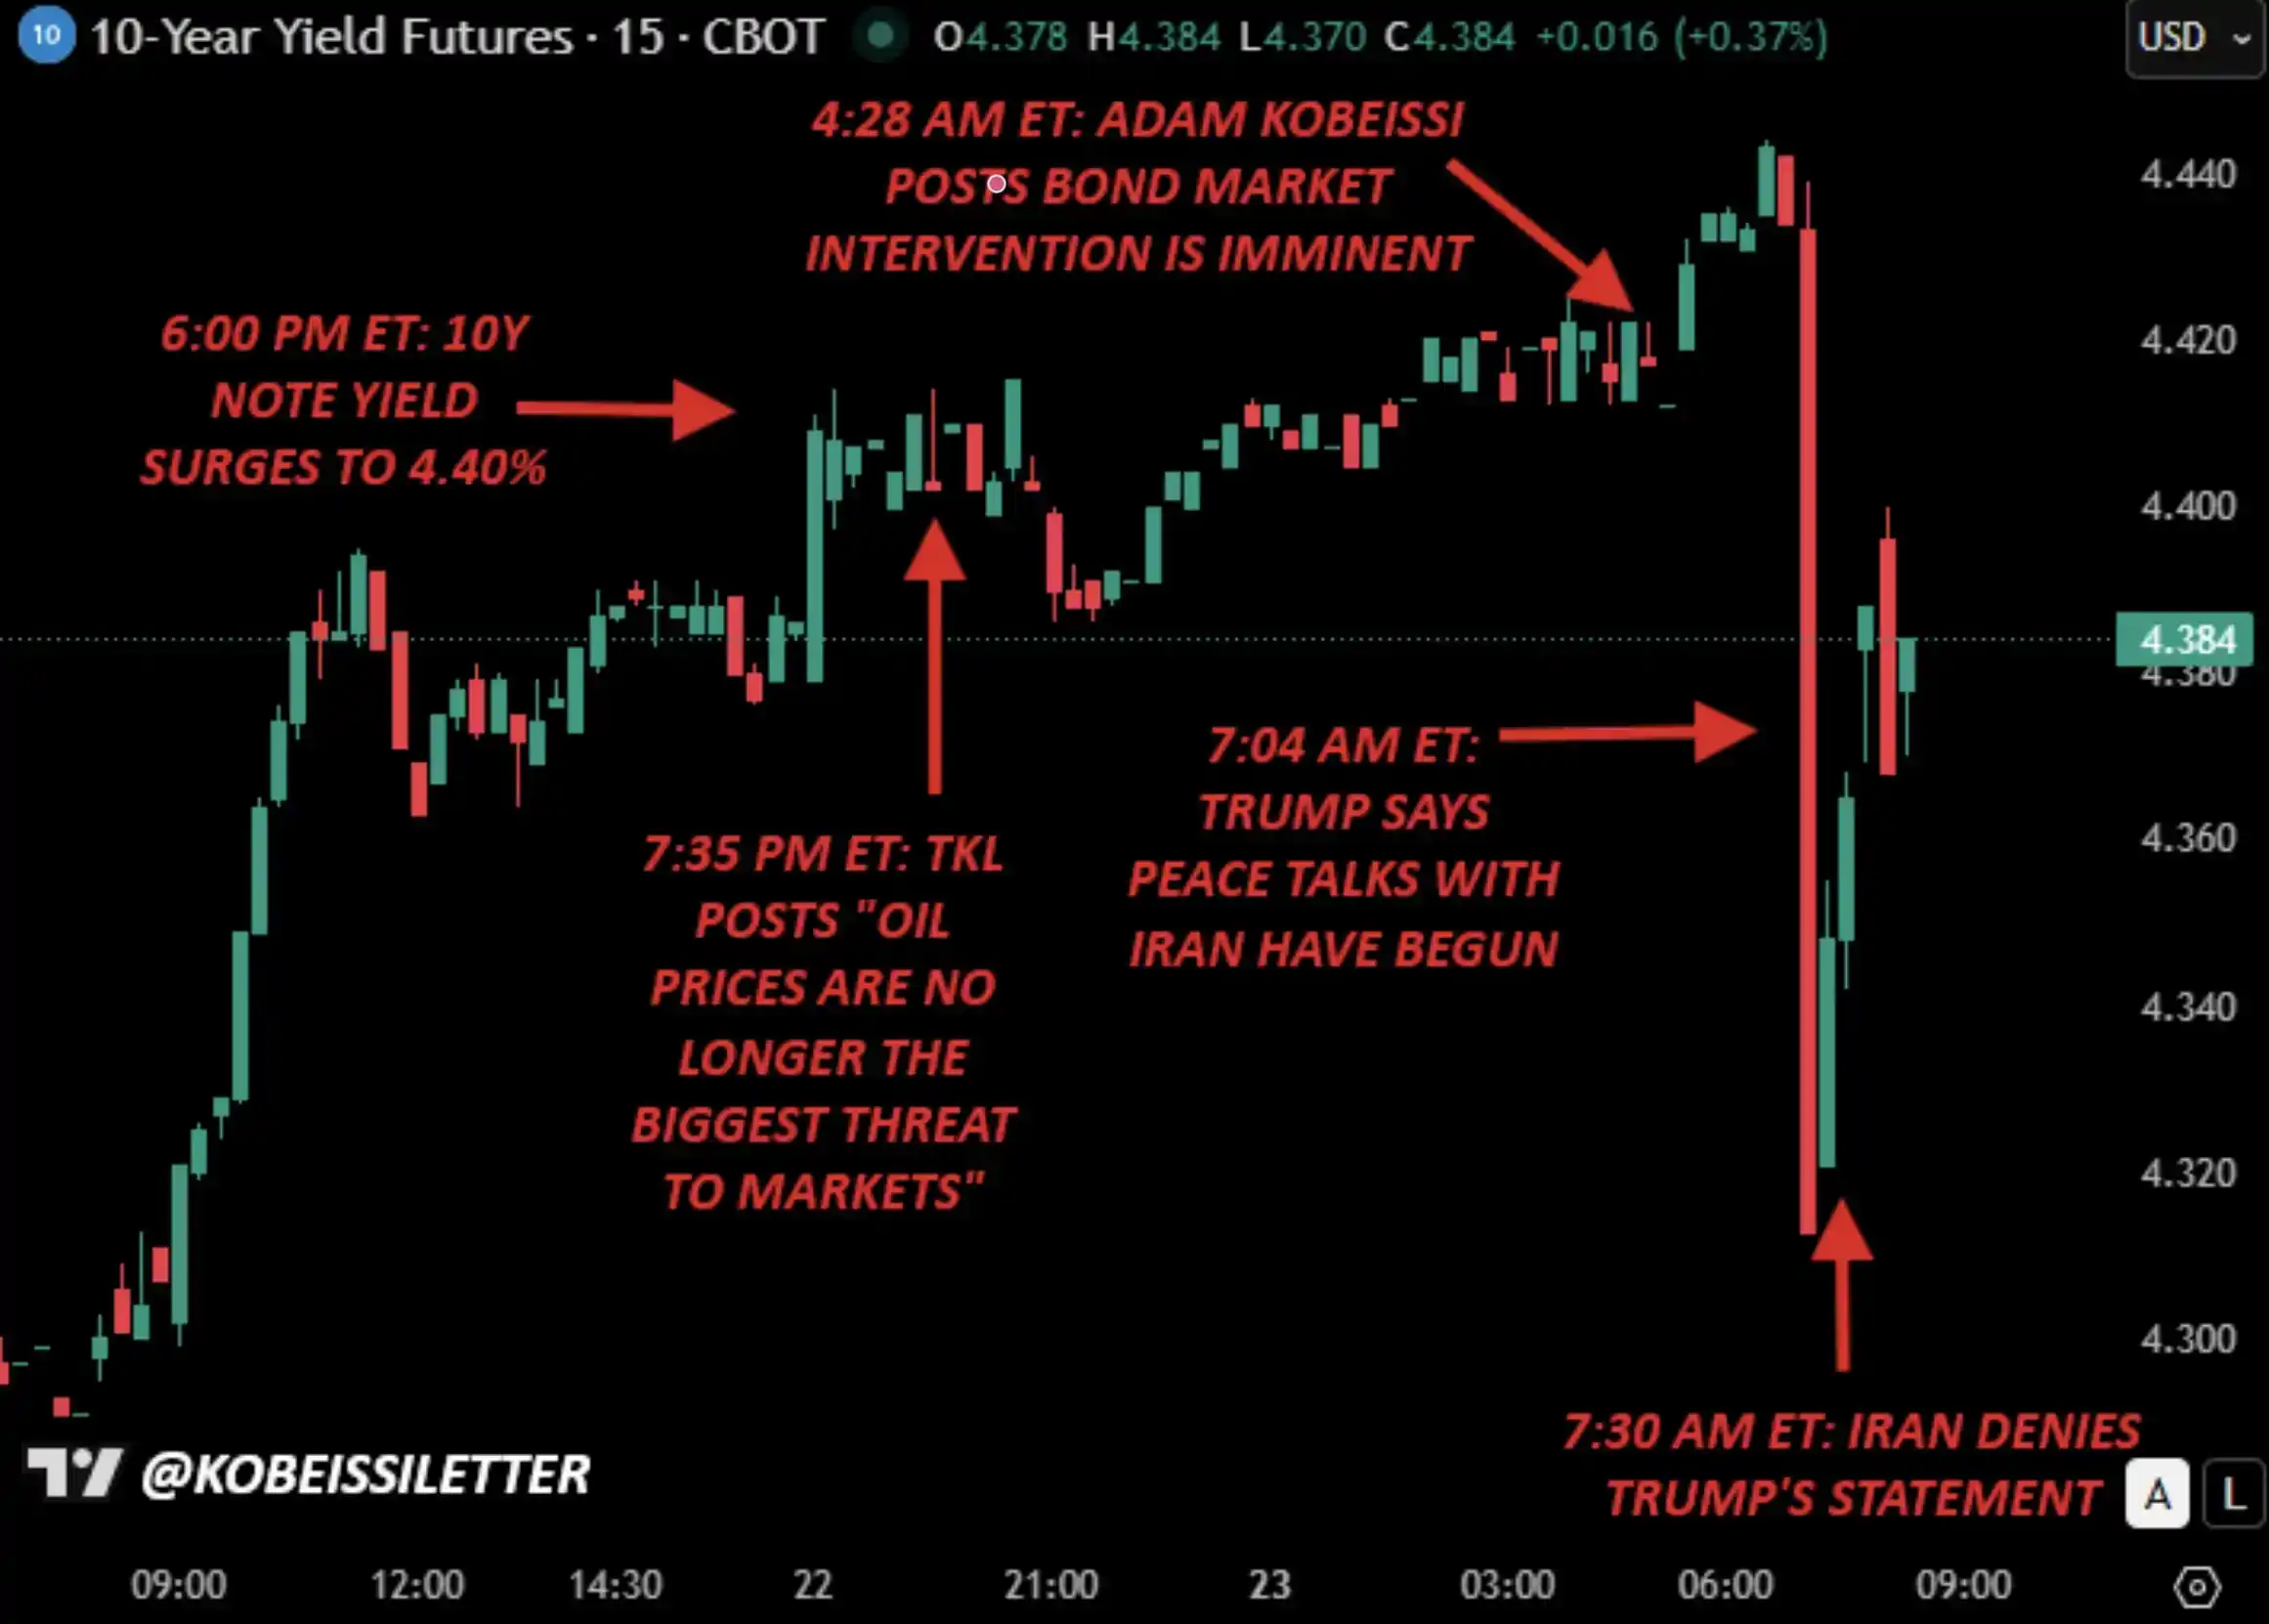
23 марта, первый сигнал вмешательства
23 марта в 4:30 по восточному времени мы отмечали: по сравнению с энергетическим рынком, проблема рынка облигаций стала более «разбалансированной». Затем, всего через 2 часа, доходность 10-летних казначейских облигаций выросла до 4,45%, и президент Трамп, вероятно, провёл обсуждение для принятия решения, подобное тому, что было 9 апреля 2025 года — тогда он объявил о приостановке тарифов на 90 дней.
Ещё через 1 час Трамп объявил об отсрочке на 5 дней удара по энергетическим объектам Ирана и заявил, что между США и Ираном начался «продуктивный» диалог, направленный на прекращение войны.
Возможно, это и был первый сигнал начала вмешательства.
Что вам теперь делать?
Самый частый вопрос, который мы получаем: что это значит?
На макроуровне мы хотим подчеркнуть один момент: администрация Трампа высокочувствительна к колебаниям на рынках акций, товаров и облигаций. Для инвесторов это хорошая новость — Трамп не хочет падения рынков, и его уровень внимания к этому явно выше, чем у предыдущих администраций.
Это также объясняет, почему цены на нефть после первоначального скачка в целом остаются под определённым контролем. Инвесторы в нефть в целом верят, что как только цены снова приблизятся к 120 долларам за баррель (как это было в начале войны), Трамп быстро примет меры вмешательства.
В более широком смысле, мы считаем, что по мере роста доходности 10-летних казначейских облигаций давление на снижение фондового рынка усилится; но когда доходность приблизится к упомянутому нами диапазону 4,50% – 4,70%, предстоящий разворот политики или «вмешательство» ограничат пространство для падения акций.
Кроме того, Трамп, ФРС и всё правительство понимают, что рынок труда США не может долго выдерживать более высокие ставки, что также означает, что текущая ситуация вряд ли перерастёт в «долгосрочную войну», а с большей вероятностью приведёт к某种ой степени разрядки или разрешения в течение недель, а не месяцев.
Наконец, за всей этой волатильностью и шумом мы хотим подчеркнуть: революция ИИ только ускоряется. Те компании ИИ, которые лидировали на рынке с 2022 года и сейчас испытывают давление из-за коррекции, на самом деле инвестируют больше и строятся быстрее.
Наша оценка фондового рынка и долгосрочного тренда ИИ не изменилась.
Продолжайте следить за рынком облигаций
То, что мы переживаем, — это не просто волатильность, а сдвиг «определяющей переменной».
За последние несколько недель внимание рынка было сосредоточено на ценах на нефть, новостях о войне и геополитической эскалации. Но под поверхностью накапливается более мощная сила и начинает доминировать в ситуации.
Рынок облигаций вновь определяет направление акций, товаров и даже самой политики. А история неоднократно доказывала, что когда финансовые условия ужесточаются слишком быстро, вопрос вмешательства никогда не в том, «произойдёт ли оно», а в том, «когда оно произойдёт».
Как мы подчёркивали в течение всего этого года, этот рынок всё больше становится игрой в «распознавание образов», где ключ в том, чтобы действовать на шаг впереди «толпы».
Мы считаем, что рынок облигаций станет следующим важнейшим нарративом.
Ссылка на оригинал