SIREN sings a warning even as bulls defend local support: What’s next?

ambcryptoОпубликовано 2026-03-30Обновлено 2026-03-30

Введение

AI-powered memecoin SIREN has exhibited significant volatility and bullish momentum since February, though it recently entered a corrective phase. The 3-day chart remains in a bullish trend, but the RSI is retreating from overbought levels, and trading volume has notably declined. A descending triangle pattern suggests a potential breakdown below the critical $0.78-$0.80 local support zone. If breached, this could trigger a deeper correction toward $0.70. For a sustained upward move, a high-volume breakout above $2 is necessary, but current low demand makes this unlikely. Traders are advised to wait for clearer signals, as a false breakout or further decline appears probable in the short term.

AI-powered memecoin Siren [SIREN] has been making waves among crypto traders and investors with its bullish performances recently. It has seen extreme volatility over the past week after making steady gains since February.

Source: SIREN/USDT on TradingView

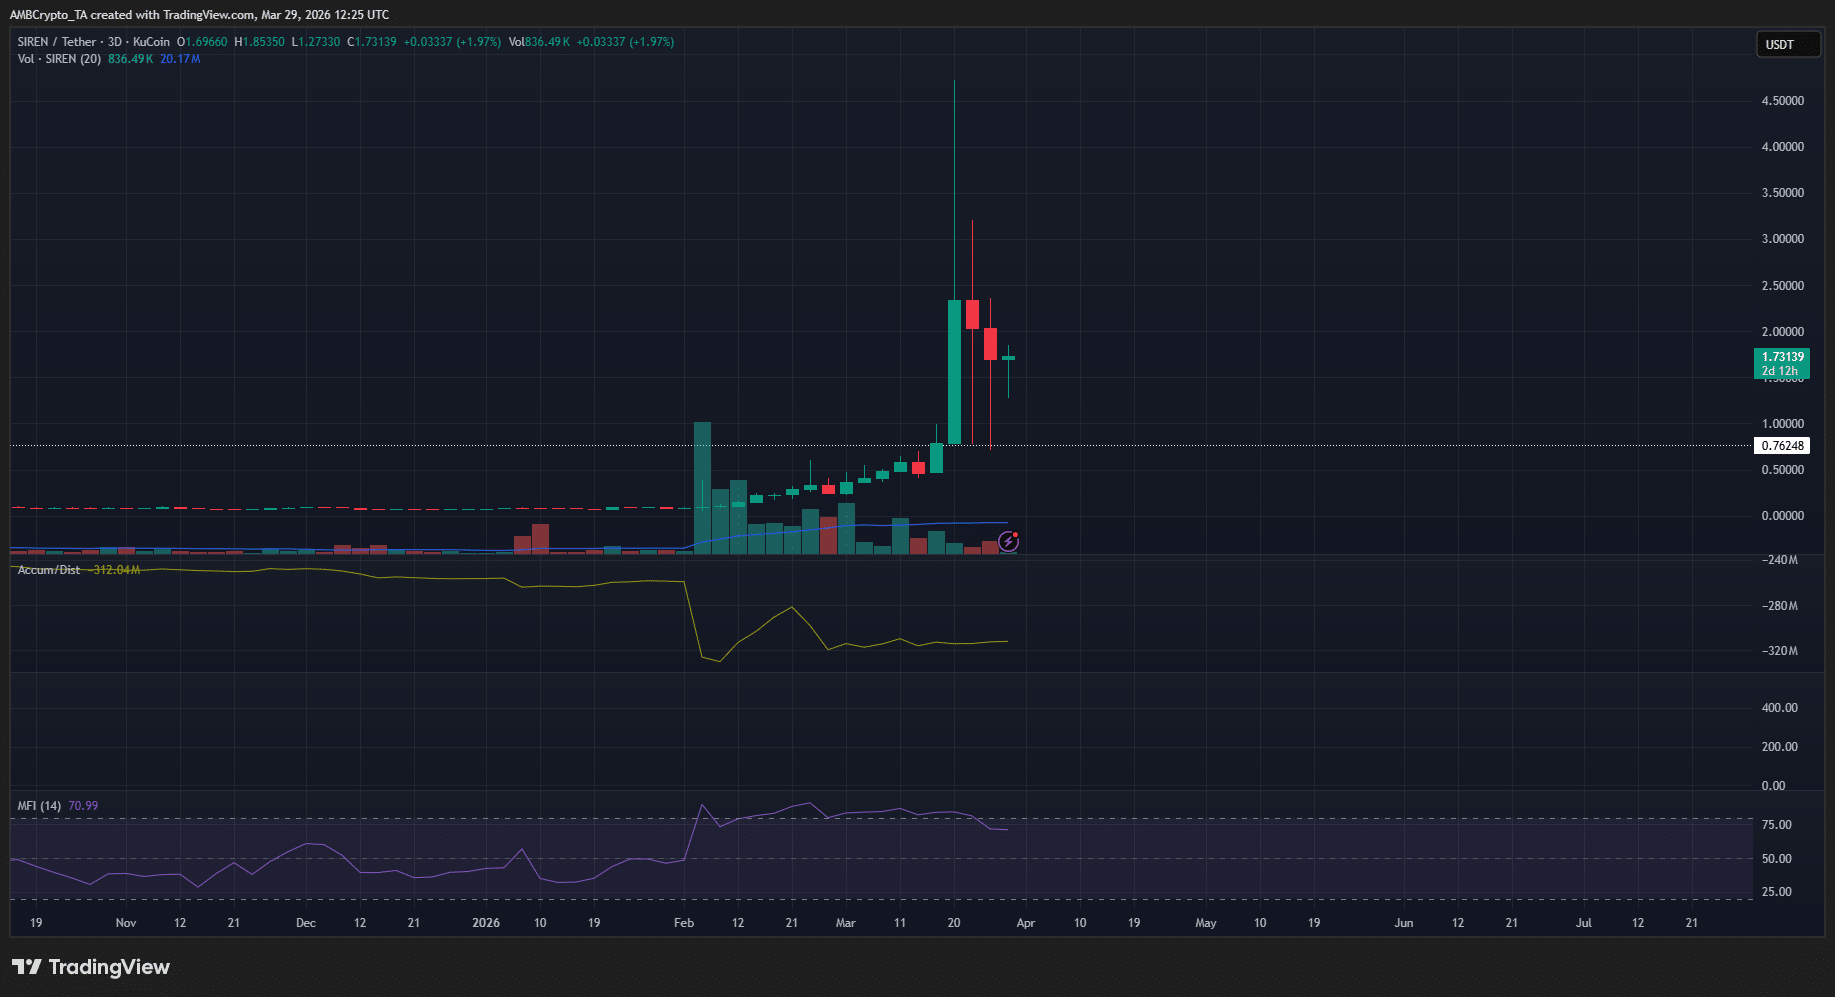
The 3-day chart’s trend remained firmly bullish. The RSI was correcting from overbought levels, explaining the drawdown of the past few days. At the same time, the large upside candle wicks during some 3-day sessions have dragged the A/D indicator lower.

The drop-off in trading volume compared to February was striking, even more so because March saw SIREN make more gains. Any recovery would need a massive influx of trading volume and demand to sustain the next move higher.

In the short term, a deeper price drop appeared likely. The coin has tested the $0.78 local support and bounced higher but has yet to end the contraction it entered over the past week. Its descending triangle chart pattern will soon see a resolution.

SIREN to test the local support once again

Source: SIREN/USDT on TradingView

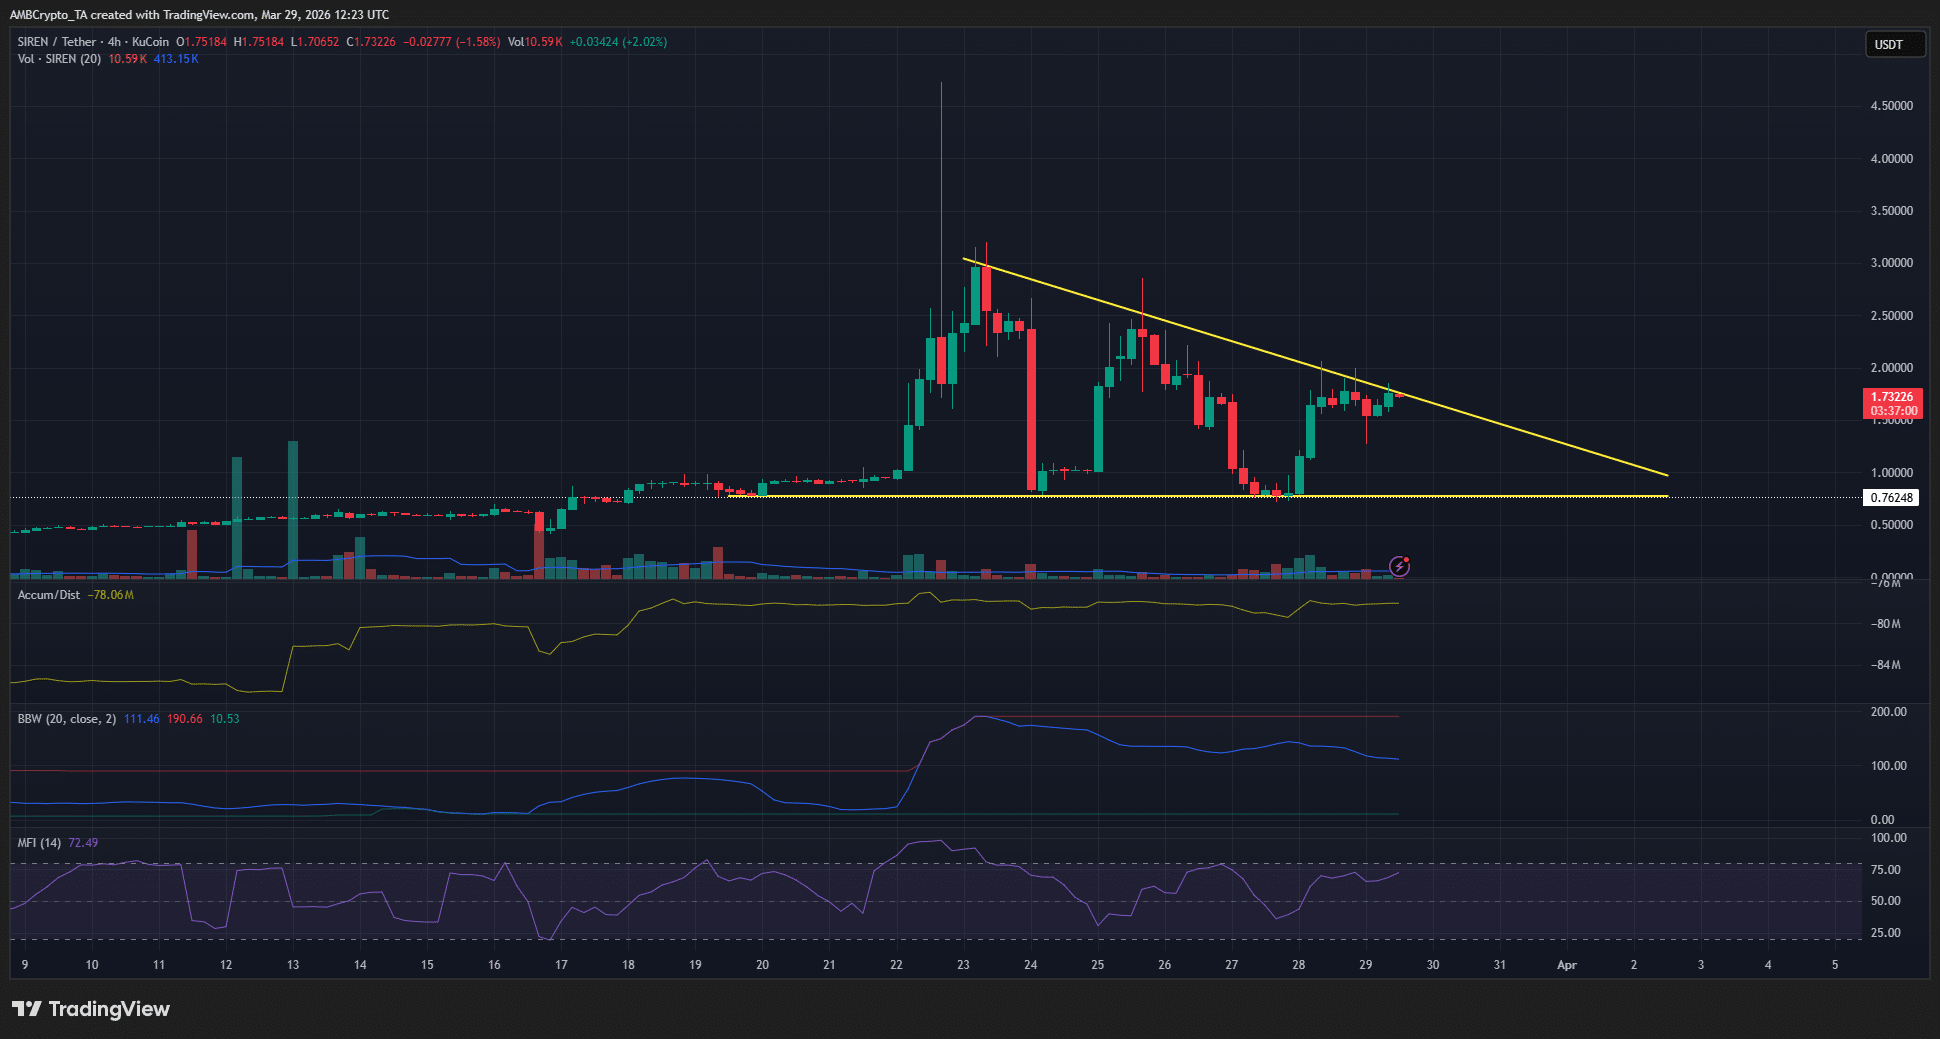
The falling triangle pattern was a concern for the bulls. The $0.8 support zone has been tested multiple times in recent days. Meanwhile, each subsequent price bounce is shallower.

In other words, seller conviction remained high, and buyers were holding on. High volatility and low demand could see the $0.8 support zone breached, sending SIREN into a deeper correction.

A breakout beyond $2 is needed to convince swing traders to go long en masse.

Traders’ call to action – Wait

Source: CoinGlass

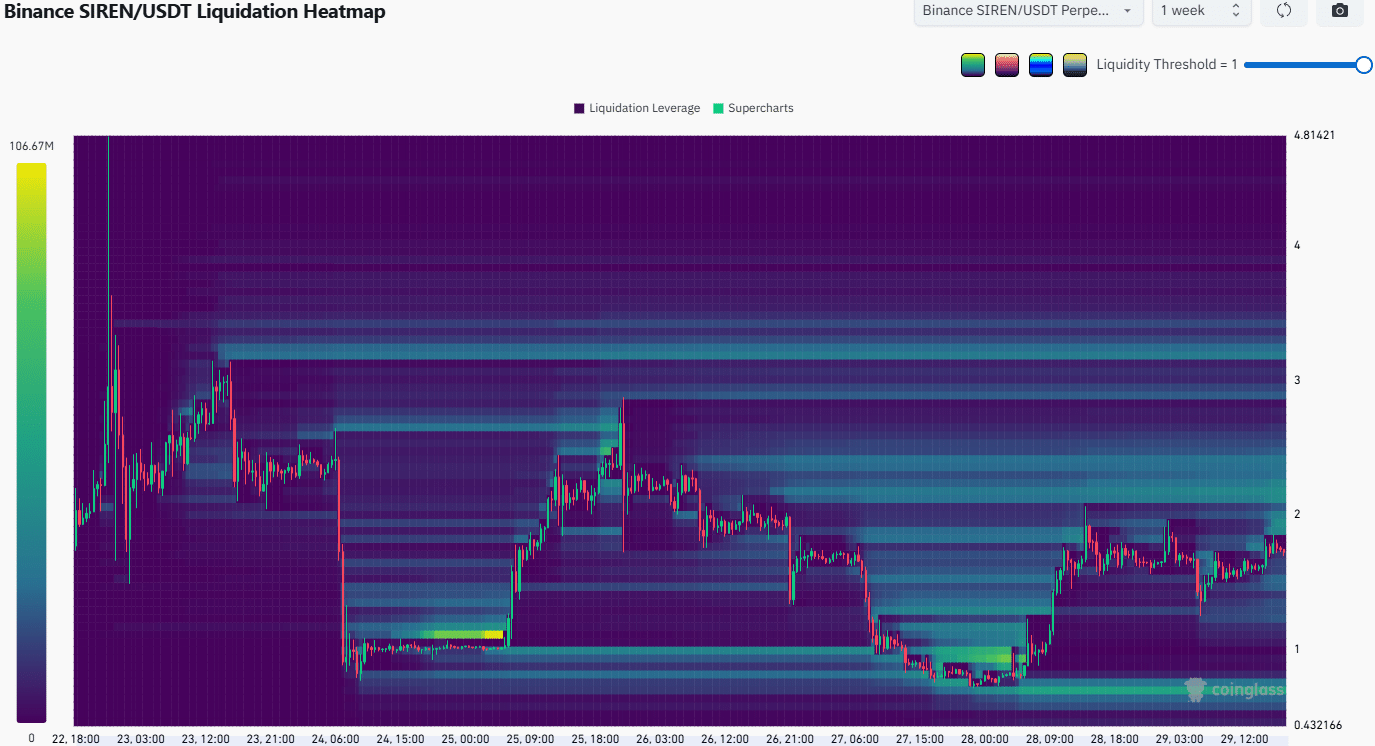
The liquidation heatmap warned of a potential liquidity sweep into the $2 area. This might look like a breakout, but it has a threat of reversing, especially if low demand conditions persist.

In this scenario, a drop to the $0.7 magnetic zone to hunt down long liquidations might commence in the coming days. Combined with the triangle pattern, a deeper price drop appears likely.

A true breakout and retest of $2, on high volume, is unlikely as things stand.


Final Summary

  • SIREN was one of the only memecoins showing bullish strength in recent weeks.
  • The descending triangle pattern was a warning to the bulls of a drop below the $0.8 local support.

Связанные с этим вопросы

QWhat is the current technical pattern observed in SIREN's price chart and what does it suggest?

AThe current technical pattern is a descending triangle, which suggests a potential drop below the local support level of $0.8, indicating a bearish signal for the price.

QWhat key level does SIREN need to break to convince swing traders to go long?

ASIREN needs to break out beyond the $2 level to convince swing traders to go long en masse.

QWhy is a massive influx of trading volume and demand crucial for SIREN's recovery?

AA massive influx of trading volume and demand is crucial to sustain the next move higher, as the current drop-off in volume compared to February is striking, and low demand conditions could lead to a deeper price correction.

QWhat is the potential downside target if the $0.8 support zone is breached?

AIf the $0.8 support zone is breached, SIREN could drop to the $0.7 magnetic zone to hunt down long liquidations, leading to a deeper correction.

QWhat does the liquidation heatmap warn about a potential move to the $2 area?

AThe liquidation heatmap warns that a move to the $2 area might look like a breakout but has a threat of reversing, especially if low demand conditions persist, making it a potential liquidity sweep rather than a sustainable rally.

Похожее

Торговля

Спот
Фьючерсы

Популярные статьи

Как купить S

Добро пожаловать на HTX.com! Мы сделали приобретение Sonic (S) простым и удобным. Следуйте нашему пошаговому руководству и отправляйтесь в свое крипто-путешествие.Шаг 1: Создайте аккаунт на HTXИспользуйте свой адрес электронной почты или номер телефона, чтобы зарегистрироваться и бесплатно создать аккаунт на HTX. Пройдите удобную регистрацию и откройте для себя весь функционал.Создать аккаунтШаг 2: Перейдите в Купить криптовалюту и выберите свой способ оплатыКредитная/Дебетовая Карта: Используйте свою карту Visa или Mastercard для мгновенной покупки Sonic (S).Баланс: Используйте средства с баланса вашего аккаунта HTX для простой торговли.Третьи Лица: Мы добавили популярные способы оплаты, такие как Google Pay и Apple Pay, для повышения удобства.P2P: Торгуйте напрямую с другими пользователями на HTX.Внебиржевая Торговля (OTC): Мы предлагаем индивидуальные услуги и конкурентоспособные обменные курсы для трейдеров.Шаг 3: Хранение Sonic (S)После приобретения вами Sonic (S) храните их в своем аккаунте на HTX. В качестве альтернативы вы можете отправить их куда-либо с помощью перевода в блокчейне или использовать для торговли с другими криптовалютами.Шаг 4: Торговля Sonic (S)С легкостью торгуйте Sonic (S) на спотовом рынке HTX. Просто зайдите в свой аккаунт, выберите торговую пару, совершайте сделки и следите за ними в режиме реального времени. Мы предлагаем удобный интерфейс как для начинающих, так и для опытных трейдеров.

1.2k просмотров всегоОпубликовано 2025.01.15Обновлено 2025.03.21

Как купить S

Sonic: Обновления под руководством Андре Кронье – новая звезда Layer-1 на фоне спада рынка

Он решает проблемы масштабируемости, совместимости между блокчейнами и стимулов для разработчиков с помощью технологических инноваций.

2.2k просмотров всегоОпубликовано 2025.04.09Обновлено 2025.04.09

Sonic: Обновления под руководством Андре Кронье – новая звезда Layer-1 на фоне спада рынка

HTX Learn: Пройдите обучение по "Sonic" и разделите 1000 USDT

HTX Learn — ваш проводник в мир перспективных проектов, и мы запускаем специальное мероприятие "Учитесь и Зарабатывайте", посвящённое этим проектам. Наше новое направление .

1.8k просмотров всегоОпубликовано 2025.04.10Обновлено 2025.04.10

HTX Learn: Пройдите обучение по "Sonic" и разделите 1000 USDT

Обсуждения

Добро пожаловать в Сообщество HTX. Здесь вы сможете быть в курсе последних новостей о развитии платформы и получить доступ к профессиональной аналитической информации о рынке. Мнения пользователей о цене на S (S) представлены ниже.

活动图片